PRIVATE HEALTH INSURANCE IN AUSTRALIA, 1983–95
Deborah Schofield, Simon Fischer and Richard Percival
Discussion Paper No. 18 May 1997
The National Centre for Social and Economic Modelling was established on 1 January 1993, following a contract between the University of Canberra and the then federal Department of Health, Housing, Local Government and Community Services (now Health and Family Services).
NATSEM aims to enhance social and economic policy debate and analysis by developing high quality models,
applying them in relevant research and supplying consultancy services.
NATSEM’s key area of expertise lies in developing and using microdata and microsimulation models for a range of purposes, including analysing the distributional impact of social and economic policy. The NATSEM models are
usually based on individual records of real (but unidentifiable) Australians. This base produces great flexibility, as results can be derived for small subgroups
of the population or for all of Australia.
NATSEM ensures that the results of its work are made widely available by publishing details of its products and research findings. Its technical and discussion papers are produced by NATSEM’s research staff or visitors to the centre, are the product of collaborative efforts with other
organisations and individuals, or arise from commissioned research (such as conferences). Discussion papers present preliminary research findings
and are only lightly refereed. Its policy papers are designed to provide rapid input to current policy debates
and are not externally refereed.
It must be emphasised that NATSEM does not have views on policy and that all opinions are
the authors’ own. Director: Ann Harding
BEHIND THE DECLINE:
THE CHANGING COMPOSITION
OF PRIVATE HEALTH INSURANCE
IN AUSTRALIA, 1983–95
Deborah Schofield, Simon Fischer
and Richard Percival
Discussion Paper No. 18 May 1997
© NATSEM, University of Canberra 1998
National Centre for Social and Economic Modelling GPO Box 563
Canberra ACT 2601 Australia
Phone: + 61 6 275 4900 Fax: + 61 6 275 4875
Email: Client services [email protected] General [email protected] World Wide Web site http://www.natsem.canberra.edu.au
Core funding for NATSEM is provided by the federal Department of Health and Family Services.
Abstract
Since the early 1980s there has been a substantial decline in the pro-portion of Australian families with private health insurance. This paper examines the decline in private health insurance between 1983 and 1995. In particular, it focuses on the changes in the types of private health insurance held, and in the incomes, ages, family types and geographic regions of residence of the people with private health insurance.
This paper also examines the impact of changes in the price of private health insurance across different income groups.
Author note
Deborah Schofield was a Research Fellow at NATSEM. She now works for the Australian Institute of Health and Welfare, Canberra. Simon Fischer is a Research Officer and Richard Percival a Senior Research Fellow at NATSEM.
Acknowledgments
The authors would like to thank Jenny Badham, Sidney Sax, Ann
Harding and Ralph Lattimore for their helpful comments on the paper.
General caveat
NATSEM research findings are generally based on estimated character-istics of the population. Such estimates are usually derived from the application of microsimulation modelling techniques to microdata based on sample surveys.
These estimates may be different from the actual characteristics of the population because of sampling and nonsampling errors in the
microdata and because of the assumptions underlying the modelling techniques.
The microdata do not contain any information that enables identification of the individuals or families to which they refer.
Contents
Abstract ... iii
Author note ...iv
Acknowledgments ...iv
General caveat ...iv
1 Introduction ... 1
2 A review of recent studies of the incidence of private health insurance ... 2
2.1 The impact of Medicare ...3
2.2 Income ...4
2.3 Insurance type ...5
2.4 Age ...6
2.5 State of residence ...6
2.6 Cost ...7
3 Changing composition of private health insurance, 1983–95 ... 8
3.1 Data sources and methodology ...8
3.2 Health insurance type ...9
3.3 Income ...10
3.4 Family type ...13
3.5 Age ...17
3.6 Location of residence ...20
4 Price of private health insurance ... 22
4.1 The changing cost of insurance ...22
4.2 Expenditure on private health insurance ...23
4.3 Impact of the private health insurance rebate ...24
5 Summary and conclusions ... 26
1
Introduction
Since 1983 (immediately prior to the introduction of Medicare) private health insurance has been an important issue in health policy —while it remained a significant source of funding for health services1, its coverage progressively fell from about 65 per cent of all persons in 1983 (ABS 1983) to about 48 per cent in 1992 (ABS 1992).
Analysing the factors behind this decline is important for two reasons: first, it may represent a continuing trend and, second, there is a relation-ship between the incidence of private health insurance and the cost of providing public health services — as insurance coverage declines, the public health system effectively subsidises a greater share of health costs. One estimate is that for every 1 per cent fall in private health insurance coverage, there is a corresponding $100 million rise in the cost of
providing public health services (Liberal Party of Australia 1996). However, most recent work on private health insurance coverage in Australia has been concerned with determining its causes at a single point in time (for example, ABS 1993; Burrows, Brown and Gruskin 1993; Hopkins and Kidd 1993; Schofield 1997) or two points (Cameron and Trivedi 1991), or have been restricted to either a simple macro-level description of its decline (Private Health Insurance Administration Council, various dates) or some very limited disaggregation (Australian Institute of Health and Welfare 1996, pp. 129–37).
Although such approaches can increase our understanding of the
demand for private health insurance, they have significant shortcomings. For example, cross-sectional studies are unable to account for important factors such as changes in price structures, economic circumstances or demographic characteristics (Ngui, Burrows and Brown 1989; Scotton 1993, p. 202).
1 For example, private health insurance helped fund 39 per cent of all hospital
admissions in 1991-92 (Private Insurance Taskforce 1993). In 1992-93 private health insurance contributions funded 5.7 per cent of public acute hospital recurrent expenditure and 83.3 per cent of private hospital recurrent expenditure. In 1993-94 funding of total health expenditure from health insurance funds was 11.2 per cent, only 2.4 percentage points more than in 1984-85 (Goss 1995, 1996).
Similarly, macro-level analysis is unable to explain much about the comparative effects on the health sector of changing levels of insurance cover among different groups. This can be clearly seen when the high average use of health services by the elderly is compared with the much lower use by young people. A reduction in health insurance coverage among the elderly would be expected to place a greater burden on the public purse than would an equal reduction in coverage among young people. Conversely, an increase in the number of young people with private health insurance would increase revenue for private health
insurance companies, but would do relatively little to reduce the burden on the public health system.
To overcome these difficulties, this paper undertakes a time-series analysis of private health insurance coverage using cross-sectional data from health insurance surveys undertaken in 1983, 1986, 1988, 1990 and 1992 (ABS 1983, 1986, 1988, 1990a, 1992). As these surveys were discon-tinued after 1992 in anticipation of the public release of the 1995 national health survey, microanalytical techniques were used to simulate health insurance coverage in 1995.
Using this comprehensive data collection, health insurance coverage — disaggregated by health insurance type, income, age, geographic region and family type — is analysed between 1983 and 1995. In doing so, earlier work in this area by Willcox (1991) — which included an analysis of health insurance coverage between 1976 and 1990, disaggregated by insurance type, age and state — is extended and updated.
2
A review of recent studies of the incidence of
private health insurance
As already noted, a number of authors have reported on the decline in the incidence of private health insurance in Australia for different family types. These studies have included specific analyses by type of private health insurance, incomes, ages and state of residence. There has also been some attention given to the impact of prices on the demand for private health insurance. The findings of these studies, as they relate to the decline in private health insurance coverage and the more important characteristics that might determine coverage, are now summarised.
2.1 The impact of Medicare
Several studies have reported on the decline in private health insurance since the introduction of Medicare in 1984.
The introduction of Medicare, a system of universal public health insurance, appeared to result in a significant decline in the number of people with private health insurance. According to a federal government report prepared by the Private Health Insurance Taskforce (1993), this decline was anticipated by the government. If this can be confirmed then the introduction of Medicare provides an example of how public health policy can affect the demand for private health insurance — and there does appear to be some support for this.
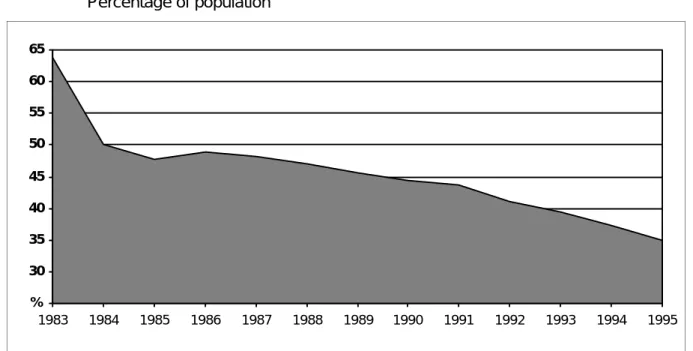
The Private Health Insurance Taskforce (1993) used Private Health Insurance Administration Council (various dates) data to examine the decline in private health insurance between June 1983 and June 1993. In doing so it found that the sharpest decline over this period was between 1983 and 1984, immediately before and immediately after the
introduction of Medicare. In that period coverage declined from around 64 per cent to 50 per cent (figure 1).
Further support for the proposition that the provision of public health insurance displaced its private counterpart was presented by Willcox
Figure 1 Basic hospital private health insurance coverage, Australia
Percentage of population 25 30 35 40 45 50 55 60 65 1983 1984 1985 1986 1987 1988 1989 1990 1991 1992 1993 1994 1995 %
(1991) who analysed the coverage of private health insurance over the period 1976–90. Between 1976 and 1981 (when universally free health services were provided under Medibank, a precursor to Medicare), private health insurance declined steadily. However, this trend was sharply reversed from 1981 to 1982, when public coverage was removed. With the introduction of Medicare in 1984 and the reintroduction of universal cover, private health insurance coverage fell sharply again. As figure 1 shows, except for a slight rise from 47.7 per cent in 1985 and to 48.8 per cent in 1986, private cover has continued to fall, albeit at a more gradual rate. Based on data collected by the Private Health Insurance Administrative Council (various dates), the average rate of decline between 1983 and 1995 was 2.2 per cent a year. After the years 1984 and 1985 the rate of decline was highest (5.5 per cent) over the period 1991–95. By June 1995 only 35 per cent of people had private health insurance (Private Health Insurance Administrative Council 1995).
2.2 Income
Of the studies that considered the determinants of private health
insurance since the introduction of Medicare, the most comprehensive have been by Hopkins and Kidd (1993), the Australian Bureau of Statistics (ABS 1993) and Schofield (1997). Each confirmed that high income families were the most likely to have private health insurance. In this context, it is also worth noting, as the Australian Council of Social Service (1994) did, that the relatively sharp decline in coverage in 1992 may have been a result of the recession in the Australian economy — that is, a result of the decline in real incomes. A decline in the coverage of private health insurance during periods of recession is not surprising, given that income has been found to be one of the most significant
predictors of health insurance coverage.
However, it must be remembered that this finding is based on cross-sectional analyses of persons or families currently holding private health insurance. A very different relationship may exist between income and the retention of insurance, and income and the take-up of insurance. This point is expressed in the Australian Institute of Health and Welfare
following a recession, persons who dropped insurance prior to the recession will not necessarily reinsure even if their incomes return to an economically viable income level.
2.3 Insurance type
Although there has been a steady decline in the overall incidence of private health insurance, as pointed out by Willcox (1991) and the Australian Institute of Health and Welfare (1994), the coverage of some types of insurance has been growing.
According to the Australian Institute of Health and Welfare, after the introduction of Medicare, ancillary2 insurance cover grew (see table 1).
Table 1 Ancillary-only private health insurance coverage, Australia
June 1984 June 1987 Sept. 1990 Dec. 1993
% % % %
Ancillary 29.6 38.4 39.7 35.3
Source: Australian Institute of Health and Welfare (1994).
Willcox reported that between 1986 and 1990 while private hospital insurance cover fell from 44 per cent to 43 per cent (table 2) the coverage of ancillary insurance (with or without hospital insurance) rose from 35 per cent to 37 per cent. According to Willcox this may have been due, in part, to the limited supply of public ancillary services.
Table 2 Hospital-only and ancillary private health insurance coverage,
Australia
1986 1988 1990
% % %
Hospital-only 44.2 43.6 43.1
Ancillarya 35.1 36.5 37.0
a Includes contributors with either hospital and ancillary or ancillary-only insurance.
Source: Willcox (1991).
2 Ancillary insurance covers health services such as dental, optical and
2.4 Age
The decline in health insurance coverage has varied considerably across different age groups. In general, younger people have been dropping out of health insurance at a faster rate than older people have (Private Health Insurance Taskforce 1993). As a result, the age structure of the insured population has changed.
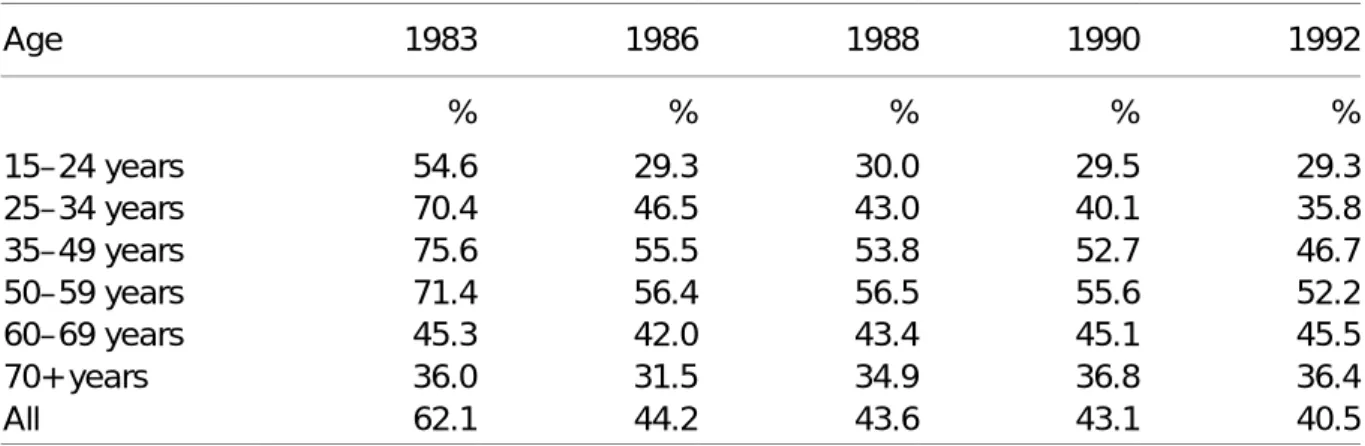
As shown in table 3, Willcox (1991) found that, while the coverage of 15– 24 year olds and 25–34 year olds almost halved between 1983 and 1992, it remained constant for those aged 60 years and over.
The reduction in the number of younger people with private health insurance, together with the ageing of the population, has resulted in an ageing pool of insured (Private Insurance Health Taskforce 1993; Willcox 1991).
Table 3 Private health insurance coverage, by age groups, Australia
Age 1983 1986 1988 1990 1992 % % % % % 15–24 years 54.6 29.3 30.0 29.5 29.3 25–34 years 70.4 46.5 43.0 40.1 35.8 35–49 years 75.6 55.5 53.8 52.7 46.7 50–59 years 71.4 56.4 56.5 55.6 52.2 60–69 years 45.3 42.0 43.4 45.1 45.5 70+ years 36.0 31.5 34.9 36.8 36.4 All 62.1 44.2 43.6 43.1 40.5 Source: Willcox (1991). 2.5 State of residence
One of the more interesting findings of some of the studies was that there have been significant interstate differences in the changes in the incidence of private health insurance over time.
Between 1984 and 1990 the incidence of private health insurance in Western and South Australia fell by 25 and 21 per cent respectively. However, in New South Wales and Victoria, over the same period the incidence fell by only 3.7 and 6.7 per cent respectively. A suggested reason was the comparatively high level of industrial action and
disputations involving public health sector workers in these states (Willcox 1991).
Of all the states, Queensland consistently had the lowest insurance coverage. This may in part be explained by the historically greater provision of free public health services by that state’s government (Australian Institute of Health and Welfare 1994, p. 137).
2.6 Cost
A number of authors have suggested that the rapid increase in private health insurance premiums in recent years may have contributed to the reduction in private insurance coverage. Data collected by the Prices Surveillance Authority (1993) showed that the nominal value of annual premiums for private health insurance covering hospital treatment in Victoria increased from $795 in 1986 to $2195 in 1993 (figure 2).
The direct connection between such increases and the decline in private health insurance has been pointed out in two government commentaries (ABS 1992; Private Health Insurance Taskforce 1993). The ABS, which reported the results of the 1992 private health insurance survey, found that 67 per cent of people who dropped insurance between 1990 and 1992 said they did so because they could no longer afford it.
Figure 2 Average annual private hospital insurance premiums, Victoria
Nominal values 0 500 1000 1500 2000 2500 1986 1987 1988 1989 1990 1991 1992 1993 $
3
Changing composition of private health
insurance, 1983–95
3.1 Data sources and methodology
This chapter uses data from the 1983, 1986, 1988, 1990 and 1992 ABS health insurance surveys (ABS 1983, 1986, 1988, 1990a, 1992) and
estimates for 1995 from NATSEM’s private health insurance dataset to analyse the decline in private health insurance by type of health
insurance, income, age, geographic region and family type. The analysis is undertaken at the contributor unit (or, in the case of NATSEM’s
dataset, income unit) level.
The principal data source used to simulate private health insurance coverage in 1995 was the 1989-90 national health survey (ABS 1990b). The national health survey provided a particularly useful resource for analysing private health insurance because of its comparatively large sample size (about 55 000 persons) and the large number of important socioeconomic, health insurance, health risk and health service use variables it contains.
However, before the national health survey could be used to model current aspects of private health insurance arrangements, information it contained needed to be updated to 1995. This was undertaken in three stages.
The first stage was to ‘age’ the data from 1989-90 to 1995 to capture the demographic, labour force and family composition changes that had occurred over this period.
The second stage was to uprate from 1989-90 to 1995 what is perhaps the key determinant of who has private health insurance —family income. The third stage used a regression model and data from the 1983, 1986, 1988, 1990 and 1992 private health insurance surveys to determine the composition of the decline in private health insurance and to predict for important subgroups the trends through to 1995. See Percival, Schofield and Fischer (1997) for a full description of the modelling processes used in compiling NATSEM’s private health insurance dataset.
3.2 Health insurance type
Over the period 1983–95, hospital and ancillary insurance was the most popular type of private health insurance, followed by the less
comprehensive (and, consequently, less expensive) hospital-only and ancillary-only insurance types (figure 3). However, since 1983 a
substantial portion of the market share of hospital and ancillary
insurance has been lost to the less comprehensive forms of insurance. Hospital and ancillary insurance covered 59 per cent of all families in 1983 but only an estimated 25 per cent in 1995.
Some of this decline was initially taken up by hospital-only insurance, whose coverage increased from 4 per cent in 1983 to 12 per cent in 1986. However, between 1986 and 1990 there was a slight recovery in the incidence of hospital and ancillary insurance (from 33 per cent to 34 per cent) while the incidence of hospital-only insurance declined (from 12 per cent to 9 per cent). Between 1990 and 1995 hospital and ancillary insurance coverage declined from 34 per cent to 25 per cent while the coverage of hospital-only insurance continued to decline to 7 per cent by 1995.
According to the Australian Institute of Health and Welfare (1994, p. 139) the more rapid decline in participation rates in the early 1990s may be attributed to the 1990-91 economic recession. This was accompanied by a
Figure 3 Private health insurance coveragea, by private health insurance
type, Australia 0 10 20 30 40 50 60 1983 1986 1988 1990 1992 1995 %
Hospital and ancillary
Hospital-only Ancillary-only
a 1983–92 data are for contributor units; 1995 NATSEM estimates are for income units.
suggestion that coverage might not increase even in more favourable economic circumstances. If this is correct, and both a predicted rise in the unemployment rate (from 8.6 per cent in 1995-96 to 9.2 per cent in 1996-97) and a decline in the economic growth rate (from 3.2 per cent to 2.5 per cent over the same period) occurs, as suggested by Access Economics (1996), then at least over the short term a further decline in private health insurance can be expected.
As figure 3 shows, of the three types of insurance, ancillary-only
insurance was the only one showing fairly constant growth, albeit from a low base of 1 per cent in 1983 to about 4 per cent in 1995.
3.3 Income
Analysis of private health insurance coverage by income was undertaken by dividing the population in the datasets for each year into income
quintiles, ranked by the combined gross incomes of the adults in either the contributor or (for 1995) income units.
As noted, income has consistently been found to be an important
determinant of who holds private health insurance. Therefore, it was not surprising to find that families in the fifth quintile (those with the highest incomes) had the highest incidence of private health insurance, while families in the first and second quintiles had the lowest (figure 4). This ranking was maintained between 1983 and 1995, although the declines in private health insurance coverage were not uniform across income
groups.
The declines in coverage were greatest for families in the third and fourth quintiles, the sharpest drops occurring between 1983 and 1986 (from 75 to 47 per cent and 90 to 61 per cent respectively). Between 1986 and 1990 the declines stalled and there were even slight recoveries in the proportions of families insured in the first and second quintiles.
However, from 1990 there were declines for all income groups.
The dispersion of private health insurance between the income quintiles altered significantly over the period 1983–95. In 1983, there were two broad groupings — one consisting of the first and second quintiles and the other the third, fourth and fifth quintiles. In 1995 the grouping with the lowest incidence of private health insurance consisted of the bottom three quintiles, each with participation rates of 20–25 per cent. The fourth
quintile was estimated in the model to take up an intermediate position in 1995 with coverage of about 41 per cent, and the fifth quintile
occupied a position by itself as the only grouping with over 60 per cent of families covered by private health insurance.
The lowest income quintiles had, on average, the lowest rates of decline in insurance coverage. This might reflect at least in part the greater concentration of aged persons in these quintiles. To determine whether this was the case, further analysis was undertaken of income quintiles by the ages of the heads of the contributor units. It was found that those aged 55 years and over made up about 50 per cent of the population of the bottom two quintiles. By contrast, they made up less than 14 per cent of the top quintile.
Interestingly, not only the aged, but most age groups in the bottom quintile appeared to have held onto private health insurance over the 1983–95 period (table 4). In the second quintile, however, there was a noticeable difference in the declines of private health insurance coverage between contributor units aged 55 years and over and younger units. The insurance coverage of units aged 55 years and over remained reasonably stable, while there were substantial declines among the younger groups. In the third and fourth quintiles, the declines were more consistent across all the age groups, while in the top quintile it was
Figure 4 Private health insurance coveragea, by gross income quintile,
Australia 10 20 30 40 50 60 70 80 90 1983 1986 1988 1990 1992 1995 % Third quintile Second quintile First quintile Fourth quintile Fifth quintile
a 1983–92 data are for contributor units; 1995 NATSEM estimates are for income units.
again more substantial among the younger groups. (Further analysis by age is discussed in section 3.5.)
As noted in section 3.2, the proportion of families choosing hospital and ancillary insurance in 1995 was much lower than in 1983, despite this insurance type remaining the most common form of private health
insurance for all income groups (table 5). The drop was found to be most
Table 4 Private health insurance coveragea, by gross income quintile and
age group, Australia
1983 1986 1988 1990 1992 1995 % % % % % % First quintile 15–24 years 21 16 22 23 24 22 25–34 years 20 17 13 16 15 9 35–54 years 23 20 19 19 19 20 55–74 years 24 21 23 25 24 29 75 and over 29 26 27 26 28 27 Second quintile 15–24 years 59 30 32 32 27 25 25–34 years 33 23 22 19 15 11 35–54 years 36 28 28 28 20 20 55–74 years 29 31 32 34 31 28
75 years and over 33 32 32 35 33 27
Third quintile
15–24 years 71 39 38 38 38 21
25–34 years 74 44 39 38 29 18
35–54 years 78 52 46 48 39 30
55–74 years 79 60 56 58 55 47
75 years and over 73 58 52 58 47 36
Fourth quintile
15–24 years 80 47 45 38 46 30
25–34 years 87 57 56 53 47 35
35–54 years 93 64 64 63 55 47
55–74 years 93 72 74 72 69 58
75 years and over 92 83 81 73 65 61
Fifth quintile
15–24 years 76 58 46 53 50 55
25–34 years 88 70 65 62 62 68
35–54 years 90 77 76 76 74 82
55–74 years 93 85 84 87 85 82
75 years and over 92 84 82 94 97 78
a 1983–92 data are for contributor units; 1995 NATSEM estimates are for income units.
marked in the middle income quintiles (the differences in coverage between 1983 and 1995 being 53 and 56 percentage points for the third and fourth quintiles respectively). In contrast, the proportion of families choosing ancillary-only insurance was estimated to have been higher in 1995 than in 1983 for all quintiles.
Table 5 Private health insurance coveragea, by gross income quintile and
insurance type, Australia
1983 1986 1988 1990 1992 1995
% % % % % %
First quintile
Hospital and ancillary 16 10 13 13 14 12
Hospital-only 6 8 8 8 6 6
Ancillary-only 1 1 1 2 2 2
None 77 80 78 77 77 79
Second quintile
Hospital and ancillary 34 17 19 20 17 13
Hospital-only 5 10 9 7 7 6
Ancillary-only 1 2 2 3 2 3
None 60 71 70 70 74 78
Third quintile
Hospital and ancillary 70 32 32 33 27 17
Hospital-only 4 12 8 8 8 5
Ancillary-only 1 3 3 4 4 4
None 25 53 56 55 61 75
Fourth quintile
Hospital and ancillary 86 45 46 45 40 30
Hospital-only 3 12 11 10 9 6
Ancillary-only 0 3 4 4 5 4
None 10 39 39 41 46 59
Fifth quintile
Hospital and ancillary 83 58 58 57 57 51
Hospital-only 4 14 11 11 10 8
Ancillary-only 1 3 3 4 4 4
None 12 25 27 27 29 37
a 1983–92 data are for contributor units; 1995 NATSEM estimates are for income units.
Data sources: ABS (1983, 1986, 1988, 1990a, 1992); NATSEM’s private health insurance dataset.
3.4 Family type
Over the period 1983–92, couples with children had the highest incidence of private health insurance followed by couples without children, single people and sole parents. This ranking is estimated to
have held through to 1995, although the rate of decline in the incidence of insurance varied among the family types (figure 5).
For all family types there was a rapid decline in private health insurance coverage following the introduction of Medicare. This was followed by a period of relative stability from 1986 to 1990 when a second decline
emerged. The most significant decline between 1983 and 1995 was
among couples with children whose coverage dropped from 83 per cent to 47 per cent. This drop is of particular significance because, for each family that withdraws from private insurance, three or more health
consumers become uninsured and more reliant on public health services. The differences in the rates of decline among family types has resulted in the insurance coverage of couples with children being little more than that of couples without children. In 1983 the difference between the proportion of couples with children insured and the proportion of couples without children insured was 16 percentage points. In 1995 the estimated difference was only 5 percentage points.
The initial rapid decline in the proportion of single people with private health insurance also narrowed the gap between the proportions of singles and of sole parent families insured from 21 percentage points in 1983 to about 8 percentage points in 1995.
Figure 5 Private health insurance coveragea, by family type, Australia
0 10 20 30 40 50 60 70 80 90 1983 1986 1988 1990 1992 1995 %
Couple and dependants
Head only
Head and dependants Couple only
a 1983–92 data are for contributor units; 1995 NATSEM estimates are for income units.
Despite the overall decline in insurance coverage, the change in the composition of insurance types held by different family types was less marked than that among different income groups.
While figure 5 might suggest that the decline in insurance coverage was fairly constant across all family types, this was not the case when the ages of different families were taken into account. For this part of the analysis families were classified into one of four broad age groups based on the age of the head of the household: 15–24 years, 25–34 years, 35–54 years, and 55 years and over.
When the family analysis was repeated using these age groups, several interesting trends emerged (figure 6). Among the younger age groups,
Figure 6 Private health insurance coveragea, by family type and age,
Australia 0 10 20 30 40 50 60 70 80 90 1983 1986 1988 1990 1992 1995 %
Couple and dependants Head only
Head and dependants Couple only
Unit head 15–24 years old
0 10 20 30 40 50 60 70 80 90 1983 1986 1988 1990 1992 1995 % Couple and dependants Head only
Head and dependants Couple only
Unit head 25–34 years old
Figure 6 (continued) 0 10 20 30 40 50 60 70 80 90 1983 1986 1988 1990 1992 1995 %
Couple and dependants
Head only
Head and dependants Couple only
Unit head 35–54 years old
0 10 20 30 40 50 60 70 80 90 1983 1986 1988 1990 1992 1995 %
Couple and dependants
Head only Head and dependants
Couple only
Unit head 55 years old and over
a 1983–92 data are for contributor units; 1995 NATSEM estimates are for income units.
Data sources: ABS (1983, 1986, 1988, 1990a, 1992); NATSEM’s private health insurance dataset.
there were precipitous declines in insurance coverage among couples, both with and without dependants. While over the period of the study these families had been the backbone of private health insurance this suggests that many may not be taking out insurance in the next stage of their life cycles.
In contrast to the younger age groups, the decline in health insurance coverage was much less dramatic among the older age groups. The
tendency for the elderly to have insurance while the young are more and more disinclined to take it up has resulted in an increasing concentration of the aged in the private insurance ‘pool’.
When private health insurance trends of families were then examined by insurance type it was clear that hospital and ancillary insurance declined as the insurance type of choice across all family types (table 6), as did hospital-only insurance after an increase in 1986.
The proportion of families with ancillary-only insurance grew across all family types, most markedly among families with children, increasing from 1 per cent in 1983 to an estimated 5 per cent in 1995.
Table 6 Private health insurance coveragea, by family type and insurance
type, Australia
1983 1986 1988 1990 1992 1995
% % % % % %
Head only
Hospital and ancillary 46 23 26 26 25 18
Hospital-only 5 10 8 8 7 5
Ancillary-only 1 2 2 3 3 3
None 48 65 64 64 65 74
Head and dependants
Hospital and ancillary 26 17 15 20 15 10
Hospital-only 3 4 4 3 3 2
Ancillary-only 1 2 4 3 4 5
None 69 77 78 75 78 83
Couple only
Hospital and ancillary 61 38 38 38 37 31
Hospital-only 5 15 13 13 11 9
Ancillary-only 1 2 2 3 3 3
None 33 45 47 47 50 57
Couple and dependants
spital and ancillary 79 48 48 47 42 36
Hospital-only 3 13 10 10 8 7
Ancillary-only 1 4 4 5 5 5
None 17 36 38 39 45 53
a 1983–92 data are for contributor units; 1995 NATSEM estimates are for income units.
Data sources: ABS (1983, 1986, 1988, 1990a, 1992); NATSEM’s private health insurance dataset.
3.5 Age
Although private health insurance coverage has declined across all age groups, there have been noticeable differences in the rates of decline between the different age groups. Between 1983 and 1995 the coverage of the 25–34 year age group declined rapidly from 72 per cent to 27 per
cent, slipping from being the age group with the second highest
coverage to the group with the second lowest (figure 7). The coverage of the 15–24 year age group declined from 55 per cent to 22 per cent,
moving this group from middle ranking to the lowest.
Importantly, it was estimated that the overall declines in the coverage of both the 55–743 years and 75 years and over age groups were relatively low between 1986 and 1995 — from 44 to 39 per cent and 32 to 30 per cent respectively — their coverage having increased in some of the intervening years before falling again. These lower overall declines resulted in the 55–74 year age group rising from the second lowest coverage to the second highest between 1983 and 1995 and the 75 years and over group rising from bottom to middle position.
As in 1983 the 35–54 year age group was the age group most likely to have been insured in 1995.
The change in the insurance coverage of the aged relative to other age groups has been noted by other researchers. Willcox (1991), for example,
3 It is important to note that the 55–74 year age group overlaps the before and after
retirement life cycle period. People aged 55–65 years tend to have a higher rate of insurance coverage than the 65–75 year age group. The data from ABS health insurance surveys did not, however, provide data in these age ranges.
Figure 7 Private health insurance coveragea, by age of the head of
contributor unit, Australia
10 20 30 40 50 60 70 80 1983 1986 1988 1990 1992 1995 % 25–34 years 15–24 years 75 years and over
35–54 years
55–74 years
a 1983–92 data are for contributor units; 1995 NATSEM estimates are for income units.
noted that the changing age composition of the insured has led to an increasing pool of insured aged over 60 years. This is very significant as the demand for health services and health service expenditure increase substantially with age (Cameron et al. 1988). An increase in the ratio of claims to insurance holders could be expected to place pressure on private health insurance premiums, which in turn might result in an even more rapid decline in private health insurance coverage.
While hospital and ancillary insurance remained the most popular insurance type across all age groups, there was a substantial move towards less comprehensive types of insurance (table 7). There was a notable increase in ancillary-only insurance cover, particularly among
Table 7 Private health insurance coveragea, by age of the head of
contributor unit and insurance type, Australia
1983 1986 1988 1990 1992 1995
% % % % % %
15–24 years
Hospital and ancillary 51 24 25 25 24 15
Hospital-only 3 6 5 5 5 3
Ancillary-only 1 3 3 3 4 3
None 45 67 67 67 68 78
25–34 years
Hospital and ancillary 67 37 35 33 28 19
Hospital-only 4 10 8 7 6 4
Ancillary-only 1 3 4 4 4 4
None 28 50 54 56 61 72
35–54 years
Hospital and ancillary 73 44 45 45 39 33
Hospital-only 3 12 10 9 8 6
Ancillary-only 1 3 3 4 5 4
None 23 41 42 42 49 56
55–74 years
Hospital and ancillary 43 27 29 30 31 27
Hospital-only 6 15 13 13 12 10
Ancillary-only 1 2 2 2 2 3
None 50 56 56 54 56 61
75 years and over
Hospital and ancillary 25 14 17 18 20 16
Hospital-only 11 18 16 16 14 12
Ancillary-only 0 1 1 1 1 2
None 64 68 67 66 65 70
a 1983–92 data are for contributor units; 1995 NATSEM estimates are for income units.
the younger groups.
There was also an overall increase in hospital-only insurance cover, especially among the older age groups. The reduction in hospital and ancillary insurance in favour of hospital-only insurance should not alter the demand for private hospital services but might well reduce the demand for private ancillary health services such as physiotherapy and dental services, particularly among the elderly.
3.6 Location of residence
As can be seen from figure 8 there have always been some differences among the states in the proportion of families insured. These have become more marked with time and the ranking of the states according to insurance coverage has altered considerably.
In 1983, between 60 and 70 per cent of people were covered by private health insurance in all states except Queensland where only about 43 per cent of the population had such insurance.
By 1995 the ranking had altered markedly, following particularly sharp declines in insurance coverage in New South Wales and Victoria
(estimated at 34 and 32 percentage points respectively). As a result, in
Figure 8 Private health insurance coveragea, by state of residence,
Australia 30 35 40 45 50 55 60 65 70 1983 1986 1988 1990 1992 1995 % NSW Qld Vic. SA WA Tas.
a 1983–92 data are for contributor units; 1995 NATSEM estimates are for income units.
1995 the largest three states by population had the lowest coverage of private health insurance, at an average of about 33 per cent. The 1995 estimates for the states of South Australia, Western Australia and Tasmania formed a second clump, with coverage of about 41 per cent. Further locational analysis was undertaken after dividing each state into capital city (metropolitan) and rest of state (nonmetropolitan) regions and including the two territories (table 8).
In 1983 the regions with the highest rates of private health insurance were the ACT and the Northern Territory (75 per cent and 73 per cent respectively). Brisbane and the rest of Queensland had by far the lowest insurance coverage of all regions (just 43 and 42 per cent respectively). Overall, across most regions there was a marked decline in private
health insurance coverage between 1983 and 1986, lesser declines to 1992 and another period of estimated rapid decline.
It was estimated that between 1983 and 1995 the regions with the largest declines in private health insurance coverage were the Northern
Territory and Melbourne (41 and 38 percentage points respectively). Those reporting the smallest overall declines were Brisbane and the rest
Table 8 Private health insurance coveragea, by region of residence,
Australia Region of residence 1983 1986 1988 1990 1992 1995 % % % % % % Sydney 67 50 48 48 46 35 NSW – rest of state 62 45 46 44 41 32 Melbourne 70 48 49 49 43 32
Vic. – rest of state 65 46 48 47 40 30
Brisbane 43 36 33 35 34 32 Qld – rest of state 42 34 32 34 32 32 Adelaide 68 53 51 54 49 42 SA – rest of state 65 50 49 53 48 37 Perth 65 51 48 47 48 39 WA – rest of state 70 49 49 47 48 42 Hobart 65 50 49 48 45 44
Tas. – rest of state 60 47 47 48 44 39
NT 73 46 45 42 40 32
ACT 75 47 52 48 48 38
a 1983–92 data are for contributor units; 1995 NATSEM estimates are for income units.
of Queensland (11 and 10 percentage points respectively).
The dispersion of rates of insurance by location of residence also altered considerably between 1983 and 1995. In 1983 there was a 33 percentage point difference in the proportion of families insured between the top (ACT) and the bottom ranked region (rest of Queensland). By 1995 the difference between the new top (Hobart) and bottom (rest of Victoria) ranked regions was estimated to be 14 points.
4 Price of private health insurance
4.1 The changing cost of insuranceIn examining the decline in private health insurance coverage, it is worthwhile to consider some of the factors that have influenced this trend. One likely factor is the increase in the price of insurance. As shown in section 2.6 the nominal price of private health insurance had increased for hospital and ancillary insurance between 1986 and 1993. However, it is more important to know if there had also been an increase in the real cost of private health insurance.
Figure 9 Weekly basic private health insurance premiums, by selected
funds In1996 dollars 5 10 15 20 25 30 1984 1985 1986 1987 1988 1989 1990 1991 1992 1993 1994 1995 1996 $
SA, Mutual Community Vic., HBA Qld, Medibank Private
NSW, MBF Tas., MBF WA, HBF
In the following analysis, the premiums of health insurers with the largest membership in each state in 1992-93 (Private Health Insurance Administration Council 1993, pp. 70–2) were used. Their premiums for basic cover were then adjusted for changes in the consumer price index (CPI) (excluding health care costs) and updated to 1996 dollar values. As figure 9 shows, the premiums for this type of cover had increased in real terms between 1984 and 1996 by between 58 and 173 per cent.
4.2 Expenditure on private health insurance
The cost of health insurance is an important factor in a family’s decision to take up or to drop private health insurance. Using data from the 1993-94 Australian Bureau of Statistics household expenditure survey (ABS 1994), average household expenditure on private health insurance was estimated by gross household income deciles (table 9). Two trends were evident. The first was the marked increase in the proportion of house-holds with insurance as average incomes increased. The second was that households with higher incomes were also more likely to spend more on private health insurance. This may reflect either the purchase of more comprehensive and expensive insurance types, or the lower proportion of single person households in higher deciles of income who would purchase the cheaper non-family rate insurance.
Table 9 Households with hospital, medical and dental insurance and
their average weekly expenditure on that insurance, by gross household income deciles, Australia, 1993-94
Gross household income decile Households insured
Average householda expenditure
in 1993-94 dollars % $ pw 1 (lowest) 30 25 2 27 20 3 31 23 4 35 24 5 38 25 6 48 25 7 55 26 8 60 26 9 67 27 10 (highest) 77 28
a Only households with private health insurance.
Figure 10 Average householda expenditure on hospital, medical and
dental insurance as a proportion of gross household income, by gross income quintileb, Australia
0 2 4 6 8 10 12 First (lowest)
Second Third Fourth Fifth (highest)
All 1984 1988 1993-94
%
a Only households with private health insurance. b Ranking based on all households except those that reported
zero or negative incomes.
Data sources: ABS (1984, 1989, 1994).
The impact of the overall increase in the cost of health insurance in real terms on the different income groups is likely to have varied consider-ably. As figure 10 shows, while the proportion of gross income required to pay for private health insurance premiums increased across all income groups between 1984 and 1993-94, the most significant impact was on families with the lowest incomes.
In 1993-94, private health insurance premiums represented, on average, almost 11 per cent of the incomes of families in the lowest (first) income quintile, compared with about 2 per cent of the incomes of families in the highest income quintile. For families in the lowest quintile, this means that the cost of insurance had increased by about 60 per cent since 1988.
4.3 Impact of the private health insurance rebate
As the preceding analysis indicates, the cost of private health insurance has increased substantially as a proportion of family incomes, most particularly for low income families. To partly reduce the cost of
insurance for low and middle income families, the federal government announced in the 1996-97 budget a tax rebate aimed at encouraging
families to retain and to take up private health insurance (Budget Paper 1996, pp. 3–100).
The rebate will be introduced on 1 July 1997 and its value will vary across different family and insurance types (table 10). The rebate will be available to:
• single people with taxable incomes of up to $35 000 a year;
• families with combined taxable incomes of up to $70 000 a year if they have no children or one child; and
• families with combined taxable incomes of up to $70 000 a year plus $3 000 for each additional child when they have more than one child. To provide preliminary and indicative estimates of the impact of the rebate on family incomes, NATSEM’s private health insurance dataset was used to calculate the average value of subsidies that will be pro-`duced by the rebate across the gross income quintiles. It should be noted that this analysis was based on estimated family incomes and private health insurance premiums in November 1995. If the trends shown in figure 10 continue it is likely that the impact of the rebate when it is introduced in July will be less than has been estimated in this analysis. As figure 11 shows, private health insurance premiums, less the
subsidies, still represent about 11 per cent of the gross incomes of
families on the lowest income quintile. If present trends of prices increas-ing as a proportion of family income continue, further declines in private health insurance coverage are likely, particularly as the cost of private health insurance has been given as the main reason for families dropping it (ABS 1993).
Table 10 Annual private health insurance rebates, by family type and
insurance type, Australia
Hospital Ancillary Both
$ $ $
Per single 100 25 125
Per couple 200 50 250
Per family with dependantsa 350 100 450
a Families with dependants include both couples with children and sole parents.
Figure 11 Average household expenditure on private health insurance,
before and after the private health insurance rebate, as a proportion of gross household income, by gross income quintile, Australia, 1995 -2 4 6 8 10 12 14
First (lowest) Second Third Fourth Fifth (highest) 1995 full premium 1995 premium less rebate
%
Data source: NATSEM’s private health insurance dataset.
5
Summary and conclusions
Between 1983 and 1995 the composition of private health insurance coverage changed considerably. In 1983, 64 per cent of the population had some form of private health insurance. By 1995 the proportion had declined to an estimated 38 per cent.
Over the period covered by this study, not only had the overall level of insurance coverage declined, but many of the characteristics of groups most likely to have insurance had also changed.
Income has consistently been found to be a good indicator of private health insurance coverage. However, a notable trend has been the
greater rate at which health insurance cover has declined among middle income families compared with both upper and lower income groups. The decline in health insurance coverage has been fairly consistent across different family types, and there are indications that there are now two distinct groups forming, with couple families continuing to have a much
higher rate of insurance than single person or sole parent families (approximately 45 and 23 per cent respectively).
By contrast, there have been major shifts in the distribution of private health insurance when considered by age. In particular, the decline in the insurance among families headed by a person over 55 years old was much less than among younger families. This shift carries serious impli-cations for insurance funds who are faced with having an increasing concentration of members who are the highest users of health services, and thus the recipients of the highest levels of benefit.
The other significant shift that has occurred has been between the states. Health insurance coverage declined dramatically in all states between 1983 and 1986 and then generally stabilised between 1986 and 1990. However, from 1990 generally the rate of decline began to accelerate again, most notably in New South Wales and Victoria. By 1995 insurance coverage in these, the largest two states that traditionally had consider-able health insurance coverage, had almost reached the level of Queens-land, traditionally the state with the lowest level of private health
insurance coverage.
An analysis of health insurance premiums showed that there has been a constant rise in the cost of insuring privately, although indications are that the rate of this increase has not been consistent across the states or between funds. This rise has had the greatest impact on low income families, the proportion of family income required to purchase private health insurance having risen from about 7 per cent in 1984 to an estimated 14 per cent in 1995 for the 20 per cent of families with the lowest incomes.
While the introduction of the health insurance rebate in July 1997 will help offset some of the recent rise in insurance costs, it is likely that for many families the continuing rise in the cost of private insurance policies will make their purchase hard to justify. In the absence of major shocks to the existing system, the declining trends evident in private health insurance coverage over the past 12 years are likely to continue.
References
Access Economics 1996, Five Year Economic Outlook, Canberra.
ABS (Australian Bureau of Statistics) 1983, Health Insurance Survey, Australia, Cat. no. 4335.0, Canberra.
—— 1984, Household Expenditure Survey 1983-84, Unit Record Tape, Canberra. —— 1986, Health Insurance Survey, Australia, Cat. no. 4335.0, Canberra.
—— 1988, Health Insurance Survey, Australia, Cat. no. 4335.0, Canberra.
—— 1989, Household Expenditure Survey 1988-89, Unit Record Tape, Canberra. —— 1990a, Health Insurance Survey, Australia, Cat. no. 4335.0, Canberra.
—— 1990b, National Health Survey 1989-90, Unit Record Tape, Canberra. —— 1992, Health Insurance Survey, Australia, Cat. no. 4335.0, Canberra. —— 1993, Apparent Determinants of Private Health Insurance, Product no.
4335.0.40.001, Canberra.
—— 1994, Household Expenditure Survey 1993-94, Unit Record Tape, Canberra. Australian Council of Social Service 1994, Reforming Private Health Insurance,
ACOSS Paper no. 64, Sydney.
Australian Institute of Health and Welfare 1994, Australia’s Health 1994, AGPS, Canberra.
—— 1996, Australia’s Health 1996, AGPS, Canberra.
Budget Paper 1996, Budget Statements 1996-97, Budget Paper no. 1, Circulated by the Treasurer and the Minister for Finance, Commonwealth of
Australia, Canberra, 20 August.
Burrows, C., Brown, K. and Gruskin, A. 1993, ‘Who buys health insurance?: A survey of two large organisations’, Australian Journal of Social Issues, vol. 28, no. 2, pp. 106–23.
Cameron, A. and Trivedi, P. 1991, ‘The role of income and health risk in the choice of health insurance: evidence from Australia’, Journal of Public
Economics, vol. 45, pp. 1–28.
—— , —— , Milne, F. and Piggott, J. 1988, ‘A microeconomic model of the demand for health care and health insurance in Australia’, Review of
Goss, J. 1995, Health Expenditure Bulletin, no. 11, Australian Institute of Health and Welfare, Canberra.
—— 1996, Health Expenditure Bulletin, no. 12, Australian Institute of Health and Welfare, Canberra.
Hopkins, S. and Kidd, M. 1993, The Determinants of the Demand for Private
Health Insurance Under Medicare, Discussion Paper Series no. 93.02, Curtin
Business School Public Sector Research Unit, Perth.
Liberal Party of Australia 1996, Coalition Policy on Private Health Insurance, Canberra.
Moylan, J. 1996, Strengthening Families, AGPS, Canberra.
Ngui, M., Burrows, C. and Brown, K. 1989, ‘Health insurance choice: an econometric analysis of A.B.S. health and health insurance surveys’, in C. Selby Smith (ed.), Economics and Health 1989, Proceedings of the Eleventh
Australian Conference of Health Economists, Public Sector Management
Institute, Monash University, Melbourne.
Percival, R., Schofield, D. and Fischer, S. 1997, Modelling the Coverage of Private
Health Insurance in Australia in 1995, Technical Paper no. 12, National Centre for Social and Economic Modelling, University of Canberra. Prices Surveillance Authority 1993, The Cost of Private Health Insurance,
Discussion Paper no. 2, Canberra.
Private Health Insurance Administration Council (various dates), PHIAC A
Report, AGPS, Canberra.
—— 1993, Annual Report 1992-93, AGPS, Canberra.
Private Health Insurance Taskforce 1993, Reform of Private Health Insurance, Discussion Paper, Commonwealth Department of Health, Housing and Local Government, AGPS, Canberra.
Schofield, D. 1997, The Distribution and Determinants of Private Health Insurance
in Australia, 1990, Discussion Paper no. 17, National Centre for Social and
Economic Modelling, University of Canberra.
Scotton, R. 1993, ‘Commentary’, in C. Selby Smith (ed.), Economics and Health:
1993, Proceedings of the Fifteenth Australian Conference of Health Economists,
Monash University, Melbourne.
Willcox, S. 1991, A Healthy Risk?: Use of Private Insurance, National Health Strategy Background Paper no. 4, Treble Press, Canberra.
Copies of NATSEM publications and information about NATSEM may be obtained from:
Publications Officer
National Centre for Social and Economic Modelling University of Canberra
GPO Box 563
Canberra City ACT 2601 Australia
Ph: + 61 6 275 4900 Fax: + 61 6 275 4875 Email: [email protected] See also NATSEM’s World Wide Web site:
http://www.natsem.canberra.edu.au
Periodic publications
NATSEM News keeps the general community up to date with the
developments and activities at NATSEM, including product and
publication releases, staffing and major events such as conferences. This newsletter is produced twice a year.
The Income Distribution Report (IDR), which is also produced twice a year, provides information and comment on the average incomes of Australian families, covering the incidence of taxation for different family types, the income support provided by the government and how different family groups are faring. The IDR, which is available on
subscription, presents this information in a simple, easy-to-follow format.
NATSEM’s Annual Report gives the reader an historical perspective of the centre and its achievements for the year.
No. Authors Title
1 Harding, A. Lifetime Repayment Patterns for HECS and
AUSTUDY Loans, July 1993 2 Mitchell, D. and
Harding, A.
Changes in Poverty among Families during the 1980s: Poverty Gap Versus Poverty Head-count Approaches, October 1993
3 Landt, J., Harding, A., Percival, R. and
Sadkowsky, K.
Reweighting a Base Population for a Microsimulation Model, January 1994
4 Harding, A. Income Inequality in Australia from 1982 to 1993: An Assessment of the Impact of Family,
Demographic and Labour Force Change, November 1994
5 Landt, J., Percival, R., Schofield, D. and Wilson, D.
Income Inequality in Australia: The Impact of Non-Cash Subsidies for Health and Housing, March 1995
6 Polette, J. Distribution of Effective Marginal Tax Rates
Across the Australian Labour Force, August 1995
7 Harding, A. The Impact of Health, Education and Housing
Outlays on Income Distribution in Australia in the 1990s, August 1995
8 Beer, G. Impact of Changes in the Personal Income Tax
and Family Payment Systems on Australian Families: 1964 to 1994, September 1995
9 Paul, S. and Percival, R. Distribution of Non-Cash Education Subsidies in Australia in 1994, September 1995
10 Schofield, D., Polette, J. and Hardin, A.
Australia’s Child Care Subsidies: A Distributional Analysis, January 1996
11 Schofield, D. The Impact of Employment and Hours of Work
on Health Status and Health Service Use, March 1996
12 Falkingham, J. and Harding, A.
Poverty Alleviation Versus Social Insurance Systems: A Comparison of Lifetime
Redistribution, April 1996
13 Schofield, D. and Polette, J. How Effective Are Child Care Subsidies in Reducing a Barrier to Work?, May 1996
No. Authors Title
14 Schofield, D. Who Uses Sunscreen?: A Comparison of the Use
of Sunscreen with the Use of Prescribed Pharmaceuticals, May 1996
15 Lambert, S., Beer, G. and Smith, J.
Taxing the Individual or the Couple: A Distributional Analysis, October 1996
16 Landt, J. and Bray, J. Alternative Approaches to Measuring Rental Housing Affordability in Australia, April 1997 17 Schofield, D. The Distribution and Determinants of Private
Health Insurance in Australia, 1990, May 1997
Policy Paper series
No. Authors Title
1 Harding, A. and Polette, J. The Distributional Impact of a Guns Levy, May 1996
2 Harding, A. Lifetime Impact of HECS Reform Options,
May 1996
3 Beer, G. An Examination of the Impact of the Family Tax
Initiative, September 1996
DYNAMOD Technical Paper seriesa
No. Authors Title
1 Antcliff, S. An Introduction to DYNAMOD: A Dynamic
Microsimulation Model, September 1993
a Discontinued series. Topic is now covered by the broader Technical Paper series.
Dynamic Modelling Working Paper seriesa
No. Authors Title
1 Antcliff, S., Bracher, M., Gruskin, A., Hardin, A. and Kapuscinski, C.
Development of DYNAMOD: 1993 and 1994, June 1996
No. Authors Title
1 Lambert, S., Percival, R., Schofield, D. and Paul, S.
An Introduction to STINMOD: A Static Microsimulation Model, October 1994
2 Percival, R. Building STINMOD’s Base Population,
November 1994
3 Schofield, D. and Paul, S. Modelling Social Security and Veterans’ Payments, December 1994
4 Lambert, S. Modelling Income Tax and the Medicare Levy,
December 1994
5 Percival, R. Modelling AUSTUDY, December 1994
6 Landt, J. Modelling Housing Costs and Benefits,
December 1994
7 Schofield, D. Designing a User Interface for a Microsimulation Model, March 1995
8 Percival, R. and Schofield, D.
Modelling Australian Public Health Expenditure, May 1995
9 Paul, S. Modelling Government Education Outlays,
September 1995 10 Schofield, D., Polette, J.
and Hardin, A.
Modelling Child Care Services and Subsidies, January 1996
11 Schofield, D. and Polette, J. A Comparison of Data Merging Methodologies for Extending a Microsimulation Model,
October 1996
a Series was renamed the Technical Paper series in 1997.
Technical Paper series
No. Authors Title
12 Percival, R., Schofield, D. and Fischer, S.
Modelling the Coverage of Private Health Insurance in Australia in 1985, May 1997