1
ORGANIZATIONS COMPETING IN THE REALM OF SOCIAL NETWORKING: AN
ANALYSIS OF AACSB ACCREDITED SCHOOLS OF BUSINESS
Carl J. Case, St. Bonaventure University, [email protected] Darwin L. King, St. Bonaventure University, [email protected]
ABSTRACT
Electronic social networking has found popularity with individuals of all ages. It has also gained acceptance in the business world. Previous research, however, found that implementation was lagging with respect to institutions of higher learning. This study, therefore, was undertaken to expand upon this prior research and determine if the state of social networking has changed. Results suggest that in the current environment of increasing business competition, social networking is becoming an integral tool at the Association to Advance Collegiate Schools of Business (AACSB) accredited schools of business. A comparison of results with the 2011 baseline study demonstrates that both the percentage of institutions and number of technologies per institution have nearly doubled in one year. Moreover, academic program and enrollment size may be factors relative to usage. Finally, institutional control is likely a determinant of behavior as a greater percentage of private institutions versus public institutions implemented each technology.
Keywords: Electronic Social Networking, Facebook, Twitter, Institutional Control
INTRODUCTION
Electronic social networking sites are literally and figuratively becoming the gathering place for all ages. A Pew Internet & American Life Project report, for example, found that 16% of young individuals, ages 12 to 17, admit to using Twitter [15]. Furthermore, a study of 1,000 adults by Social Science Research Solution found that 69% of individuals ages 18-49 and 38% of those 50 years and older use social media [2]. Moreover, a 2012 AARP Pew Internet Project found that more than one third of online Americans ages 65 and older are active on social networking sites [18]. Interestingly, for those ages 75 and older, the average Facebook network size is 42 friends, as compared to 319 for individuals in their twenties.
Business adoption and acceptance has been astounding. A 2010 study found, for instance, that electronic social networking has been implemented at nearly three-quarter, or 71%, of the Fortune 200 [8]. A 2012 informationweek.com Global COP survey also found that while only 14% of companies have performed a major project that incorporates social networks into their company's IT infrastructure, 23% plan a major implementation within a year [17]. However, an Information Week 2012 Social Networking Survey of IT professionals found that only 38% rate the results from enterprise social networking as excellent or good [5]. Another survey of Information Week 500 executives found that 43% have completed promoting an internal social network for employee use [16]. Moreover, 25% are pilot testing and 19% plan to implement within 12 months. Finally, it appears that organizations are relatively tolerant of employee personal use of social networks. The survey of executives found that only 20% of organizations block most employees' access to social networks and that 76% have no plans to block access. Forrester also estimates that 76% of enterprises allow access to social networking sites from within the corporate networks [19].
In terms of usage, a 2012 Jobvite survey found that 92% of U.S. companies use social networks to locate talent, with LinkedIn being the most popular network [4]. Social networking has even become a component of treating the seriously ill. The Children's Medical Center Dallas implemented a social network as part of its Children's Online
2
Experience initiative for children ages 13 and older [9]. In fact, the 2012 McKinsey "The Social Economy" study predicts that social technologies could pump $900 billion to $1.3 trillion per year into the economy [5].
The primary technologies include Facebook, YouTube, Twitter, and LinkedIn. A ten-month comparison of unique visitors demonstrates both the pervasiveness and dramatic growth of social networking. In December 2011, there were 147 million visitors to Facebook, 148 million visitors to YouTube, 38 million visitors to Twitter, and 23 million visitors to LinkedIn [11,14,13,12]. By October 2012, there were 161 million visitors (10% increase) to Facebook, 157 million visitors (7% increase) to YouTube, 43 million visitors (26% increase) to Twitter, and 28 million visitors (22% increase) to LinkedIn. One additional social networking platform is the blog. Technorati, a blog search engine, tracked 1.3 million blogs, 34,000 of which were business blogs, in December 2012 [20]. While previous research studies have explored facets such as the determinant factors for the successful implementation of Facebook marketing by enterprises [21] and motivation to use Twitter [3], this study was conducted to build upon a 2011 study that examined electronic social networking at all of the AACSB accredited schools of business.
This research, therefore, examines several questions. What are the currently implemented social networking technologies? Does implementation vary by academic program, institutional control, or institution enrollment size? Is the current state of implementation different than 2011? Results are important in helping institutions of higher learning to better understand social network technology implications and to assist in identifying potential competitive opportunities.
PREVIOUS RESEARCH
This study's authors conducted an exploratory research study in 2011 to better understand university social networking behavior and to establish a baseline for future research [6,7]. In particular, the study was undertaken to examine the state of Web 2.0 implementation at all of the AACSB accredited schools of business. Findings indicated that although these institutions lag behind business implementation, schools were adopting the technologies.
Results indicated that programs had implemented a variety of Web 2.0 technologies. Facebook was the most common technology, utilized by 37.8% of AACSB accredited schools of business. This was followed by Twitter (30.3%), YouTube (21.3%), LinkedIn (20.2%), Flickr (9.2%), blogs (5.2%), and other technologies (6.5%). From a programmatic perspective, executive MBA and doctoral programs had the highest implementation percentage of Facebook (42.6% each), Twitter (37.3% and 36%, respectively), and YouTube (24% each). Moreover, executive MBA programs had the highest implementation percent with respect to LinkedIn (25.4%), blogs (8.9%), and other technologies (9.5%). Undergraduate programs had the highest percentage with regard to Flickr (9.1%).
In terms of the use of social networking technologies, 39% of undergraduate programs used at least one technology. With respect to other programs, 41% of MBA programs, 46% of executive MBA programs, 42% of specialized Master’s programs, and 45% of doctoral programs implemented at least one technology. Interestingly, the use of multiple technologies was prevalent. Three or more technologies were implemented by 28% of undergraduate programs, 29% of MBA programs, 35% of executive MBA programs, 29% of specialized Master’s programs, and 30% of doctoral programs.
When examining institutional control, no uniformity was found among programs. With regard to undergraduate programs, a great percentage of public schools implemented Facebook and blogs and a lesser percentage, relative to private schools, implemented the other five technologies. The percentage of YouTube implementation was, however, found to be significantly different. In terms of MBA programs, a great percentage of private schools implemented all technologies with the exception of blogs than public schools. The percentage difference between
3
private minus public with respect to nearly all technologies was large (i.e., 8.7%, 22.5%, 58.5%, 33.3%, 52.8%, and 47.4%) with the YouTube implementation statistically significantly different. With regard to doctoral programs, a greater percentage of private schools implemented all technologies with the exception of Flickr and blogs than public schools. No statistically significant differences were found, however.
With respect to school enrollment, technology use varied by size. The largest percent of YouTube (26.1% of schools) and Flickr (12.4% of schools) users were small schools. Medium schools were the largest percentage implementers of other technologies (7% of schools). Large schools were the largest percentage implementers of Facebook (43.9% of schools), Twitter (36.1% of schools), LinkedIn (25.8% of schools), and blogs (7.7% of schools).
RESEARCH DESIGN
This study utilized the AACSB website list of the AACSB accredited schools of business to obtain institution names and identify each school’s website URL [1]. Each institution’s website was then examined to determine Twitter, Facebook, LinkedIn, YouTube, Flickr, and other web 2.0 technology utilization. Demographic data such as institutional control and program enrollment were obtained through the research office at AACSB International. As per AACSB categorization, programs were delineated as undergraduate, MBA, executive MBA, specialized Master’s degree, and doctoral. One hundred percent of the AACSB accredited schools of business were examined. Social networking utilization was next evaluated to determine if there were differences with regard to institutional control for each academic program. Finally, social network usage was examined by total school of business enrollment to explore if usage varies by enrollment size. Enrollment was categorized as small, medium, or large. An institution can be considered "small" if there are fewer than 5,000 students, "medium-size" with between 5,000 to 15,000 students, and “large” with more than 15,000 students [10]. However, the authors found no commonly accepted size definitions for schools of business. As a result and in order to approximate a bell-shaped curve, the authors discriminately defined “small” as less than 1,000 students, such as Butler University (private) and the Jacksonville State University (public). “Medium” schools of business would include those with 1,001 to 3,000 students, such as the Rochester Institute of Technology (private) and the California State University at Bakersfield (public). “Large” schools of business are those with more than 3,000 students such as Temple University (private) and the University of Georgia (public). By utilizing this scheme, 28% of schools were classified as small, 44% as medium, and 28% as large.
RESULTS
A review of the 647 AACSB accredited schools of business found that institutions utilize a variety of social networking technologies. The technologies include Facebook, Twitter, YouTube, LinkedIn, Flickr, blogs, and other. The “other” category includes Daily Motion, Delicious, Foursquare, GooglePlus, iTunes, Viadeo, Vimeo, Weibo, and so on. The most common “other” technologies are Foursquare (28 schools), iTunes (25 schools) and GooglePlus (11 schools).
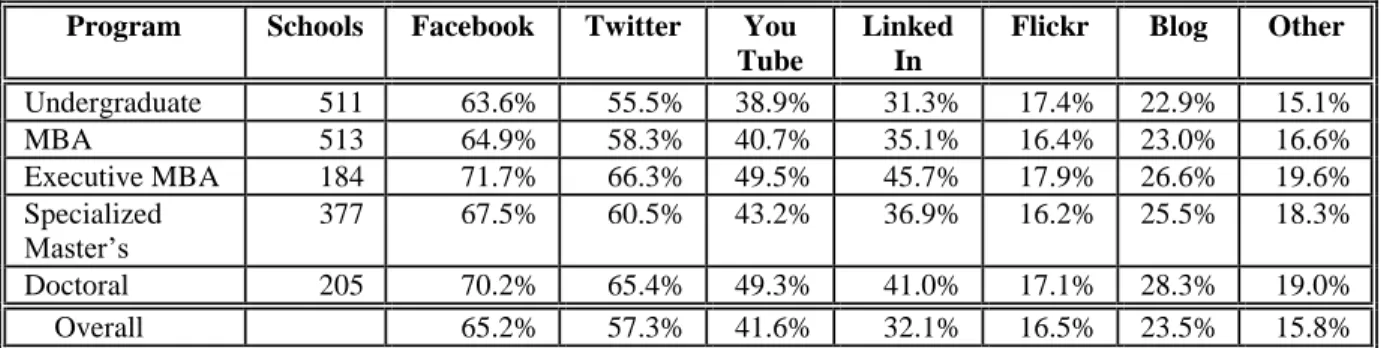
Table 1 provides an analysis of technology usage by program. In terms of the 511 undergraduate programs, 63.6% use Facebook, 55.5% use Twitter, 38.9% use YouTube, 31.3% use LinkedIn, 17.4% use Flickr, 22.9% use blogs, and 15.1% use other technologies. With regard to the 513 MBA programs, 64.9% use Facebook, 58.3% use Twitter, 40.7% use YouTube, 35.1% use LinkedIn, 16.4% use Flickr, 23.0% use blogs, and 16.6% use other technologies. Relative to the 184 executive MBA programs, 71.7% use Facebook, 66.3% use Twitter, 49.5% use YouTube, 45.7% use LinkedIn, 17.9% use Flickr, 26.6% use blogs, and 19.6% use other technologies. With respect to the 377 specialized master’s programs, 67.5% use Facebook, 60.5% use Twitter, 43.2% use YouTube, 36.9% use LinkedIn, 16.2% use Flickr, 25.5% use blogs, and 18.3% use other technologies. In terms of the 205 doctoral programs,
4
70.2% use Facebook, 65.4% use Twitter, 49.3% use YouTube, 41.0% use LinkedIn, 17.1% use Flickr, 28.3% use blogs, and 19.0% use other technologies. Overall, the most commonly used technologies include Facebook (65.2% of schools), Twitter (57.3% of schools), YouTube (41.6% of schools), and LinkedIn (32.1% of schools). The least utilized technologies include blogs (23.5% of schools), Flickr (16.5% of schools), and other technologies (15.8% of schools).
Table 1. Overall Social Network Usage
Program Schools Facebook Twitter You
Tube
Linked In
Flickr Blog Other
Undergraduate 511 63.6% 55.5% 38.9% 31.3% 17.4% 22.9% 15.1% MBA 513 64.9% 58.3% 40.7% 35.1% 16.4% 23.0% 16.6% Executive MBA 184 71.7% 66.3% 49.5% 45.7% 17.9% 26.6% 19.6% Specialized Master’s 377 67.5% 60.5% 43.2% 36.9% 16.2% 25.5% 18.3% Doctoral 205 70.2% 65.4% 49.3% 41.0% 17.1% 28.3% 19.0% Overall 65.2% 57.3% 41.6% 32.1% 16.5% 23.5% 15.8%
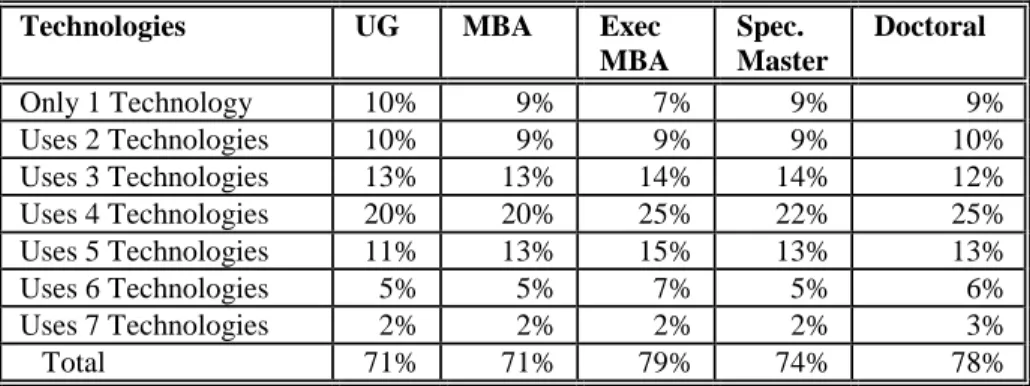
Table 2 details the quantity of technologies utilized by schools of business in each program. Relative to undergraduate programs, 10% of schools employ only one technology, 10% use two technologies, 13% use three technologies, 20% use four technologies, 11% use five technologies, 5% use six technologies, and 2% use seven technologies. Overall, 71% of these schools use at least one form of electronic social networking.
With regard to MBA programs, 9% of schools employ only one technology, 9% use two technologies, 13% use three technologies, 20% use four technologies, 13% use five technologies, 5% use six technologies, and 2% use seven technologies. Overall, 71% of these schools use at least one form of electronic social networking.
In terms of executive MBA programs, 7% of schools employ only one technology, 9% use two technologies, 14% use three technologies, 25% use four technologies, 15% use five technologies, 7% use six technologies, and 2% use seven technologies. Overall, 79% of these schools use at least one form of electronic social networking.
With respect to specialized master’s programs, 9% of schools employ only one technology, 9% use two technologies, 14% use three technologies, 22% use four technologies, 13% use five technologies, 5% use six technologies, and 2% use seven technologies. Overall, 74% of these schools use at least one form of electronic social networking.
Relative to doctoral programs, 9% of schools employ only one technology, 10% use two technologies, 12% use three technologies, 25% use four technologies, 13% use five technologies, 6% use six technologies, and 3% use seven technologies. Overall, 78% of these schools use at least one form of electronic social networking.
5
Table 2. Usage of Multiple Social Networking Technologies
Technologies UG MBA Exec
MBA Spec. Master Doctoral Only 1 Technology 10% 9% 7% 9% 9% Uses 2 Technologies 10% 9% 9% 9% 10% Uses 3 Technologies 13% 13% 14% 14% 12% Uses 4 Technologies 20% 20% 25% 22% 25% Uses 5 Technologies 11% 13% 15% 13% 13% Uses 6 Technologies 5% 5% 7% 5% 6% Uses 7 Technologies 2% 2% 2% 2% 3% Total 71% 71% 79% 74% 78%
Table 3 provides a breakdown of social network usage by institutional control for undergraduate programs. In terms of the public institutions, 61.7% use Facebook, 53.3% use Twitter, 35.9% use YouTube, 29.9% use LinkedIn, 14.4% use Flickr, 22.6% use a blog, and 13.0% use another social networking product. In terms of the private institutions, 68.5% use Facebook, 62.2% use Twitter, 46.9% use YouTube, 35.0% use LinkedIn, 25.2% use Flickr, 23.8% use a blog, and 20.3% use another social networking product. When comparing public versus private institutions, a greater percentage of the private institutions have implemented every technology. Specifically, 11.0% more of the private schools use Facebook, 16.7% more use Twitter, 30.6% more use YouTube, 17.1% more use LinkedIn, 75.0% more use Flickr, 5.3% more use a blog, and 56.2% more use other technologies. There were no significant differences between public versus private with the exception of Flickr implementation. There was a difference between public and private Flickr usage at the .005 significance level.
Table 3. Undergraduate Program Social Network Usage by Institutional Control
Program Facebook Twitter You
Tube
Linked In
Flickr Blog Other
Public 61.7% 53.3% 35.9% 29.9% 14.4% 22.6% 13.0% Private 68.5% 62.2% 46.9% 35.0% 25.2% 23.8% 20.3% %Difference 11.0% 16.7% 30.6% 17.1% 75.0% 5.3% 56.2% Chi-Square Difference .149 .067 .022 .267 .004** .768 .040
** Significant at the .005 level (2-tailed)
Table 4 provides a breakdown of social network usage by institutional control for MBA programs. In terms of the public institutions, 60.8% use Facebook, 53.7% use Twitter, 35.5% use YouTube, 31.3% use LinkedIn, 12.8% use Flickr, 21.9% use a blog, and 13.1% use another social networking product. In terms of the private institutions, 73.9% use Facebook, 68.3% use Twitter, 52.2% use YouTube, 43.5% use LinkedIn, 24.2% use Flickr, 25.5% use a blog, and 24.2% use another social networking product. When comparing public versus private institutions, a greater percentage of the private institutions have implemented every technology. Specifically, 21.5% more of the private schools use Facebook, 27.2% more use Twitter, 47.0% more use YouTube, 39.0% more use LinkedIn, 89.1% more use Flickr, 16.4% use a blog, and 84.7% more use other technologies. There were significant differences between public versus private with regard to all technologies with the exception of blog implementation. There was a difference between public and private Facebook, Twitter, YouTube, Flickr, and other usage at the .005 significance level. There was a difference between public and private LinkedIn usage at the .01 significance level.
6
Table 4. MBA Program Social Network Usage by Institutional Control
Program Facebook Twitter YouTube LinkedIn Flickr Blog Other
Public 60.8% 53.7% 35.5% 31.3% 12.8% 21.9% 13.1% Private 73.9% 68.3% 52.2% 43.5% 24.2% 25.5% 24.2% % Difference 21.5% 27.2% 47.0% 39.0% 89.1% 16.4% 84.7% Chi-Square Difference .004** .002** .000** .007* .001** .370 .002** * Significant at the .01 level (2-tailed)
** Significant at the .005 level (2-tailed)
Table 5 provides a breakdown of social network usage by institutional control for doctoral programs. In terms of the public institutions, 69.4% use Facebook, 63.1% use Twitter, 46.5% use YouTube, 39.5% use LinkedIn, 16.6% use Flickr, 29.3% use a blog, and 15.9% use another social networking product. In terms of the private institutions, 72.9% use Facebook, 72.9% use Twitter, 58.3% use YouTube, 45.8% use LinkedIn, 18.8% use Flickr, 25.0% use a blog, and 29.2% use another social networking product. When comparing public versus private institutions, a greater percentage of the private institutions have implemented every technology, other than blogs. Specifically, public schools have 14.7% more usage of blogs. In terms of private institutions, 5.0% more use Facebook, 15.5% more use Twitter, 25.4% more use YouTube, 15.9% more use LinkedIn, 13.3% more use Flickr, and 83.6% more use other technologies. There were no significant differences between public versus private implementation.
Table 5. Doctoral Program Social Network Usage by Institutional Control
Program Facebook Twitter YouTube LinkedIn Flickr Blog Other
Public 69.4% 63.1% 46.5% 39.5% 16.6% 29.3% 15.9% Private 72.9% 72.9% 58.3% 45.8% 18.8% 25.0% 29.2% % Difference 5.0% 15.5% 25.4% 15.9% 13.3% -14.7% 83.6% Chi-Square Difference .643 .209 .151 .434 .724 .563 .041
Finally, social network usage was examined by school of business enrollment size (Table 6). Because the authors found no commonly accepted size definitions for schools of business, the authors discriminately defined “small” schools as those with less than 1,000 students, “medium” as 1,001 to 3,000 students, and “large” more than 3,000 students. By utilizing this scheme, 28% of schools were classified as small, 44% as medium, and 28% as large. Results show that with regard to small schools, 67.1% use Facebook, 58.4% use Twitter, 40.4% use YouTube, 29.2% use LinkedIn, 19.3% use Flickr, 16.8% use blogs, and 16.1% use other technologies. With regard to medium schools, 60.6% use Facebook, 50.8% use Twitter, 36.6% use YouTube, 30.5% use LinkedIn, 15.4% use Flickr, 21.5% use blogs, and 14.6% use other technologies. Relative to large schools, 69.8% use Facebook, 66.0% use Twitter, 44.4% use YouTube, 40.7% use LinkedIn, 16.7% use Flickr, 30.9% use blogs, and 17.9% use other technologies.
Table 6. Social Network Usage By Total Enrollment
Students Schools Facebook Twitter You
Tube
Linked In
Flickr Blog Other
1-1,000 (small) 161 67.1% 58.4% 40.4% 29.2% 19.3% 16.8% 16.1% 1,001-3,000 (med) 256 60.6% 50.8% 36.6% 30.5% 15.4% 21.5% 14.6% 3,001+ (large) 162 69.8% 66.0% 44.4% 40.7% 16.7% 30.9% 17.9%
7
CONCLUSIONS, IMPLICATIONS, AND LIMITATIONS
Results indicate that programs have implemented a variety of Web 2.0 technologies. Facebook is the most common technology, utilized by 65.2% of AACSB accredited schools of business. This was followed by Twitter (57.3%), YouTube (41.6%), LinkedIn (32.1%), blogs (23.5%), Flickr (16.5%), and other technologies (15.8%). From a programmatic perspective, executive MBA had the highest implementation percentage of Facebook (71.7%), Twitter (66.3%), YouTube (49.5%), LinkedIn (45.7%), Flickr (17.9%), and other technologies (19.6%). Doctoral programs had the highest implementation percent with respect to blogs (28.3%) and were second in percentage with respect to every other technology.
In terms of the use of social networking technologies, 70% of undergraduate programs used at least one technology. With respect to other programs, 71% of MBA programs, 79% of executive MBA programs, 75% of specialized Master’s programs, and 79% of doctoral programs implemented at least one technology. The use of multiple technologies was prevalent. Three or more technologies were implemented by 51% of undergraduate programs, 53% of MBA programs, 63% of executive MBA programs, 56% of specialized Master’s programs, and 59% of doctoral programs.
When examining institutional control, considerable uniformity was found among programs. With regard to undergraduate programs, MBA programs, and doctoral programs, a great percentage of private schools versus public schools implemented each technology. For example, in terms of MBA programs, while 52.2% of private institutions implemented YouTube, only 35.5% of public schools did so. The only except is that with regard to doctoral programs, a slightly larger percentage (29.3%) of public versus private (25%) implemented a blog.
With respect to school enrollment, technology use varies by size. Large schools are the largest percentage implementers of all of the technologies with the exception of Flickr, which was most implemented by small schools (19.3% of schools). With respect to large schools, 69.8% implement Facebook, 66% implement Twitter, 44.4% implement YouTube, 40.7% implement LinkedIn, 30.9% implement a blog, and 17.9% implement other technologies. Medium schools were the smallest percentage implementers with respect to all technologies except LinkedIn and blogs.
Implications
There are four important implications as a result of these findings:
1. One implication is that academic program remains a factor with respect to electronic social network implementation at AACSB accredited schools of business. Executive MBA programs, for example, are the most active in terms of the number of technologies per institution and the percentage of institutions utilizing social networking. Undergraduate programs, on the other hand, are the least active. These findings are consistent with the 2011 study. It is possible that institutions have found that social networking is an effective mechanism to bridging the time and distance issues commonly associated with the likely commuter graduate student.
2. A second implication is that institutional control is a determinant in social network usage. Whether it be an undergraduate, MBA, or doctoral program, a greater percentage of private (versus public) institutions implement each technology. This finding, however, is in stark contrast to the 2011 study that found implementation differences within and between academic program. It is likely private institutions are more aggressive in social networking because they are finding it increasingly difficult to achieve enrollment goals and/or private institutions believe that social networking creates a more personal relationship with prospective, current, and former students.
8
3. A third implication is that enrollment size is factor. Large institutions, as a percentage of institutions, dominate in implementation in six of the seven social networking technologies. Medium institutions, on the contrary, have the lowest implementation percentage in five of the seven technologies. Small institutions have just slightly less implementation percentages than the large institutions. It is possible that information technology economies of scale allow the large institutions to economically network and that small institutions have a interest in social networking because many are private schools.
4. A fourth implication is that social networking is becoming an integral tool at AACSB accredited schools of business. A comparison of results with the 2011 baseline study conducted by the authors demonstrates that both the percentage of institutions and number of technologies per institution have nearly doubled in one year. However, this dramatic increase suggests that social networking may offer less competitive advantage than it previously may have.
The limitations of this study are primarily a function of each school’s website and the nature of the research methodology. If a school utilizes a technology, for example, but does not have the logo displayed on the web page that is linked from the AACSB web site, then it was not counted. As a result, the social networking participation may be higher than reported in this study. The second weakness is due to the nature of the research methodology. Seventy-seven institutions do not report enrollment size to AACSB so they were not counted in the size analysis of Table 6. Moreover, there is no way to discriminate if a given technology is used for a specific program in that a web page may display a Facebook logo, but one cannot determine if this is solely for undergraduates or graduates or both. Finally, because there is no commonly accepted definition for small, medium, and large programs, the discriminate choice by these researchers could be called to question.
REFERENCES
1. AACSB. (2012). Schools Accredited in Business. AACSB.net. November. Available: https://www.aacsb.net/eweb/DynamicPage.aspx?Site=AACSB&WebKey=ED088FF2-979E-48C6-B104-33768F1DE01D
2. AARP. (2012). The Poll: Social Media. aarp.org/bulletin. 53(7), September, 4.
3. Agrifoglio, R., Black, S., Metallo, C., & Ferrara, M. (2012). Extrinsic Versus Intrinsic Motivation in Continued Twitter Usage. Journal of Computer Information Systems. 53(1), 33-41.
4.
Brandpoint (2012). 6 Ways to Use Social Media When Looking for a New Job. The Times Herald. November 26, A-10.5. Carr, D. F. (2012). McKinsey's Trillion-Dollar Social Prediction. Informationweek.co. 1340, 10.
6. Case, C. J. & D. L. King (2011). AACSB Accredited Institutions and the Web 2.0: Lagging Behind Businesses in Social Networking Implementation. Issues in Information Systems. Volume XII(2), 1-8.
7.
Case, C. J. & D. L. King (2012). A Programmatic Investigation of Web 2.0 Implementation at AACSB Accredited Schools of Business. Journal of Business and Behavioral Sciences. 24.2, Summer, 86-96.8. Case, C. J., & King, D. L. (2010). Cutting Edge Communication: Microblogging At The Fortune 200, Twitter Implementation and Usage. Issues in Information Systems. XI(1), 216-223.
9. Cerrato, P. (2012). Children's Medical Center Dallas Gets Social. Informationweek.com. 1343, 66.
10. College Data (2013). Student Body Size: Small, Medium, or Large? Collegedata.com. January. Available: http://www.collegedata.com/cs/content/content_choosearticle_tmpl.jhtml?articleId=10006
11. Complete.com (2013). Site Statistics Facebook, Complete.com. January. Available: http://siteanalytics.compete.com/facebook.com/
12. Complete.com (2013). Site Statistics LinkedIn, Complete.com. January. Available: http://siteanalytics.compete.com/linkedin.com/
9
13. Complete.com (2013). Site Statistics Twitter, Complete.com. January. Available: http://siteanalytics.compete.com/twitter.com/
14. Complete.com (2013). Site Statistics YouTube, Complete.com. January. Available: http://siteanalytics.compete.com/youtube.com/
15. Irvine, M. (2012). Teens Migrating to Twitter. Pew Internet. January. Available: http://pewinternet.org/Media-Mentions/2012/Teens-migrating-to-Twitter-sometimes-for-privacy.aspx
16. Murphy, C. (2012). 500: The IT Rules Have Changed. Informationweek.com. 1343, 9-14. 17. Murphy, C. (2012). New IT Rulebook. Informationweek.com. 1327, 19-27.
18. Rainie, L. (2012). Seniors' Moment in a Digital World. aarp.org/bulletin. 53(9), November, 36. 19. Rashid, F. (2012). Network Breaches Herald More Advanced Attacks in 2012. eweek, 28(20), 22. 20. Technorati (2013). Directory of Blogs. Januaryr. Available: http://technorati.com/blogs/directory/
21. Yang, T. (2012). The Decision Behavior of Facebook Users. Journal of Computer Information Systems. 52(3), 50-59.