APPLICATION OF GIS AND AERIAL THERMAL IMAGE PROCESSING METHODS TO SOLVE ENVIRONMENTAL PROBLEMS OF THE OIL INDUSTRY
László MUCSI Associate professor,
University of Szeged, Department of Physical Geography and Geoinformatics Phone: +36-62-544-397, fax: +36-62-544-158, Email: [email protected] Abstract
Underground oil or thermal water pipeline networks can be detected by the melting of a thin snow layer over of them or in the spring as well when the vegetation grows faster over the pipeline than in its surroundings.
Old pipelines may be fractured or leaking due to different physical and chemical processes and the soil and underground water can become contaminated by natural oil, gasoline and other waste materials.
The aim of the research group was to develop a methodology for discovering pipeline leakage at a very early stage based on aerial thermal and video images. The GPS coordinates were added to the images and these data were processed in a self developed GIS platform.
The video images were less useful than thermal images in pipeline detection during spring and summer when land use changes due to vegetation and during winter when there is a thick snow cover over the ground.
Due to the spatial and thermal resolution small spots of leakage on the surface could be recognized on the thermal images. The location was quickly identified by spatial coordinates of the leakage and this was a great benefit in allowing for rapid environmental rehabilitation.
Introduction
Corrosion caused by groundwater and transported materials, physical effect (heavy track movement) and last but not least the illegal pipeline boring (gasoline robbery) can cause pipeline leakages, soil and groundwater contamination.
Different materials of different temperature, e.g. hot thermal water (60-70 °C), warm natural oil (30-60°C) and very cold liquid gas are carried on the pipeline system. The thermal contamination of pipeline can be detected by the melting of a thin snow layer over of them or in the spring as well when the vegetation grows faster over the pipeline than in its surroundings (1) (2) (3). The aim of the research group was to develop a GIS and remote
sensing based methodology for discovering pipeline leakage at a very early stage using aerial thermal and video images.
Methods
According to the literature there are different methods to measure and discover pipeline leakages. The measurement system can be installed bellow the pipeline (5). The leakage can be detected by raising of the pressure (6) in the pipeline. The CH content of the soil can be measured on the field by “digital nose” (9). The aerial surveillance can be based on color aerial photographs (8), thermal images, 3D seismic measurement (7) or flame ionization hyrocarbon analysis.
First of all we had to prove that there are measurable differences in soil temperature on the surrounding zone of pipelines. To prove this an automatic, digital soil temperature measurement system was planned and developed. The soil temperature was measured in 7 points at 5 and 40 cm depth, 1 sounder measured the soil temperature outside the supposed zone and another one measured the air temperature at 2 m in every 10 minutes.
Fig. 1. Structure of the automatic soil measurement system
Digital video and thermal cameras were located on to a Cessna-172 airplane. The thermal images were acquired in every 1 sec, the video images were stored in an AVI file. During the flights the position of the plane were recorded in a kinematic GPS file and the coordinates were joined to the center of the images.
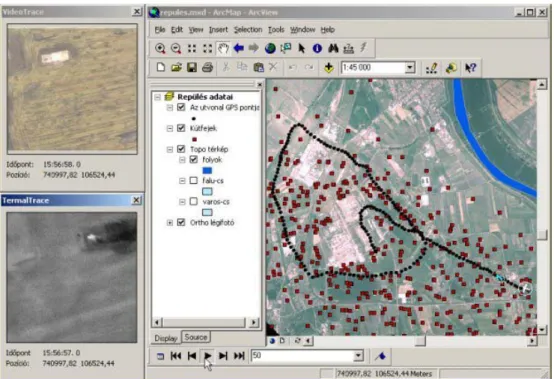
A self-developed ArcGIS extension was used to display the video and thermal images together their geographical coordinates. In the same screen, on another window, an orthorectified airphoto and different vector coverages (river, roads, wells, etc.) were displayed. The changing position of the airplane was animated by a moving symbol (Fig. 2.)
After the landing, the GIS system was filled by the images and the coordinates, so it could be used for visual interpretation and discovering pipeline leakages.
Results
The soil temperature measurement system was introduced over an active pipeline (Fig.3.) and from October 30th 2001 to January 09th 2002 more than 150000 soil temperature data were collected. The average difference between the minimum (sounder no.15, 1 m to the left from the pipeline) and maximum (sounder no.12, over the pipeline) temperature was 2 °C (Fig. 4.)
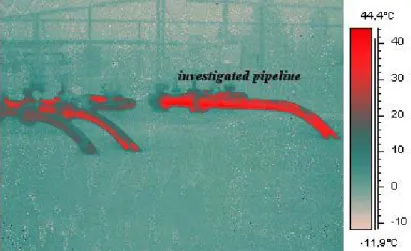
Fig. 3. Thermal image of parts above surface of the investigated pipeline
5 7 9 11 13 15 17 19 1 764 1527 2290 3053 3816 4579 5342 6105 6868 7631 8394 9157 sampling at every 10 minutes from 10.30.2001 to 01.09.2002
°C
12.Szonda 13.Szonda 14.Szonda 15.Szonda
Fig. 4. Soil temperatures at 40 cm depth to the right from the pipeline
According to the soil temperature data a cca. 3 m wide zone could be determinated, in which there was at least 2 °C difference between the minimum and maximum soil temperature. We assumed that if the geometrical resolution is about 30 cm, then this zone can be characterized by 10 pixels across. The AFOV of the used thermal camera (FLIR SC 2000) was 24°, the size of the Focal Plane Array was 320 * 240 pixel. To reach the desired resolution the height of the plane had to be 240 m (800 feets), and so the ratio of the overlapping of the successive thermal images was more than 50 %.
During 30 flights some leakages were discovered, and not only the position of the leakages could be determinated by the utilization of GIS environment, but the size and the type of the leakages were also measured and described (Fig.5.)
Fig 5 Thermal image of parts of pipelines and a typical thermal section of them
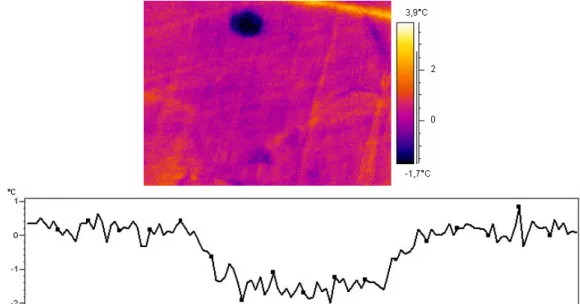
Fig 6. Localization of a “hot” leakage on a thermal image and its thermal section
Discussion
According to the above described results the utilization of thermal images integrated into a GIS system seems to be very useful. In the future the GIS system will be completed by an automatic leakage detection tool. Another way of the research program is to develop the real-time image transport by wireless network technology.
Conclusions
During the research program the thermal contamination effect of the active oil pipelines was measured by self-developed automatic soil-temperature measurement system. On the base of the measured size of this zone, parameters of thermal image acquisition (height, geometric resolution, ratio of overlapping, etc.) were calculated. GPS coordinates were joined to the image centers, and these spatial data were integrated into a GIS platform. Thermal images were analyzed by visual interpretation and the discovered leakages were investigated statistically and geometrically. According to these investigations the size and the type of the leakages were also determined.
Acknowledgements
The research program was supported by the Hungarian Scientific Research Found (OTKA T035121) and Ministry of Education (IKTA-3, OMFB-02517/2000)
References
(1) L. Mucsi:: Characterisation of oil-industrial contamination using aerial and thermal images - EARSeL Symposium, Drezda in: A Decade of Trans-European Remote Sensing Cooperation, (ed: Buchroithner). Balkema, Rotterdam pp. 373-377. ISBN 90 5809 187 2
(2001)
(2) Mucsi L. A termális képkészítő és elemző rendszer (TEKER) fejlesztése c. projekt bemutatása – I. Magyar Földrajzi Konferencia, Szeged,. (2001)
(3) L. Mucsi – Sz. Varga – M. Ferenczy): Introduction to research project organizing for characterization and monitoring of the environmental effect of petroleum industrial contamination in Hungary Acta Geographica Szegediensis (2001)
(4) Airwave Environmental Technologies – Aerial Pipeline Surveillance useing AET Model AE2420 Flame Ionization Hyrocarbon Analyzer – www.gasdetect.com.airbornedoc.html
(5) DiTest – pipeline temperature and leakage monitoring –
www.smartec.ch/HTMLFiles/Berlin_Brine_Pipeline.html
(6) FLEXIM – http://www.flexim.de/english/leakage.htm
(7) Fugro Airborne Surveys jelentése – Enhanced 3D Seismic Surveys Using a New Airborne Pipeline Mapping – www.fugroairborne.com/CaseStudies/pipelinedetection.shtml
(8) Geoplace – GEOEurope – Aerial imaging applications in pipeline industry –
www.geoplace.com/ge/20016070160701pip.asp
(9) KAMINA Gas Detection for Intelligent Mass Products with the Karlsruhe Micronose -http://www-ifia.fzk.de/IFIA_Webseiten/Webseiten_Goschnick/