International Journal of Advances in Management and Economics Available online at: www.managementjournal.info
RESEARCH ARTICLE
Margin Setting to Short and Long Futures Contract Positions by
Coherent Risk Measures
Hamidreza Kordlouie, Mir Feiz Fallah, Alireza Nasser pour Asad
Department of Management and Accounting, Islamic Azad University, Islamshahr Branch, Tehran, Iran.
*Corresponding Author: Hamidreza Kordlouie
Abstract
This study, using gold coins spot price returns, in the period from 2008to 2016, estimates and compares IME gold coin futures contracts short and long positions Initial margin by coherent risk measures, specially Expected Shortfall and spectral risk measures.GARCH, EGARCH and GJR GARCH used for volatility process modeling. Fore moles back-test, it applies Christophersonconditional coverage likelihood ratio (LRcc) test and Lopez and Blanco-Ihel loss functions, and Fore ES models Evaluations uses MAE and RMS Eloss functions. The paper finds that, GJRGARCH has outperformed the other models that support the asymmetric response of gold coins price to positive and negative shocks. The average margin estimated for short positions with all risk measures, is significantly larger than long positions that confirm asymmetric response of gold coins price to positive and negative shocks.
Keywords: Blanco-Ihel Back test, EGARCH, Expected Shortfall, Exponential Spectral Risk Measure, Margin, Margin Setting.
Introduction
Those measurement which are based upon integrated measures percentile of risk including expected shortfall and spectral risk measurements like symbolic spectral risk measurement and power spectral risk measurements are better than other ones.
Value at Risk process is always used for determining of margin setting. In spite of high efficiency of Value at Risk models for determining of margin setting and due to some non-efficiency such as subadditivity, it is impossible to include any risk integrated measurement. Since the Value at Risk is just one percentile, it has special applications but is not satisfying as a risk measurement. Therefore expected shortfall is better than Value at Risk along with subadditivity for risk measurement [1].
Of course, there are major weak points in expected shortfall models due to their applications including necessary benefits from levels of significance and also lack of attention to the risk aversion nature. Therefore most researchers pay nice attention to applying of risk spectral measurement. The most important form of them is Exponential and Power weighting functions. These measurements provide a
final risk digit with regard to risk aversion level and free from any needs to determine confidential level.
Since the major part of all these models is based upon estimations percentile, if there are dissimilar variance in distribution of parts, any lack of attention to this matter may cause incorrect estimation of models. Therefore, we used general self-regression models of GARCH for modeling of fluctuations especially with lack of symmetric data [2].
Basic assets play the important role in extracted interactions of price fluctuations and also determining of margin setting in future contracts. It is the major tool of risk management in interaction room.
for interaction rooms to make correct calculations of margin setting [4].
This paper intends to compare various models of GARCH family for calculation of margin setting in future contracts of gold coin at Iranian Stock Exchange and by focusing on risk integrated measures including exponential & power weighting functions. Finally we have compared separately all functions of these models in estimation of margin setting in buying / selling positions.
Theoretical literature & Research History
If we show the margin setting, price changes and probable distribution function of price changes respectively by ML and F(x), then we may calculate any probable insufficiency of margin setting in a day by the use of a dangerous value model as follows [5]:
F(ML) =
ML) > p prob( =
p (1)
Although any attitudes based upon value at Risk Approach are suitable models for estimation of margin setting, but there is a weak point here which is higher losses than the same. This is exactly the same factor which is really important for extracted contracts interaction room. This is because in case of any fluctuations in prices rather than Value at Risk, this case is really serious from viewpoint of risk management.
Whether the mentioned amounts in current guarantee accounts which are sometimes more than specified rates by Stock Exchange could cover any losses resulted from these changes or not. This criteria that means 𝛼 percent average is the worst loss and could be calculated by the following formulation [6]:
𝐸𝑆𝛼=1 𝛼0
𝑎
∫ 𝑉𝑎𝑅 (𝑥)𝑑𝑥 (2)
Regarding some application weak points with which most expected shortfall models are facing, it is useful to apply risk spectral measurement. Risk measurement may not only calculate considered risk without any needs to level of significance but also will consider people risk aversion level in weighing function. This measure is the weighted average of efficiency distribution percentile. If we consider 𝑀𝜑 as the risk measurement, we will have:
𝑀𝜑=∫ ∅(𝑝)𝐹1 −1(𝑥)𝑑𝑝
0 (3)
Where:
∅(𝑝)is the weighted function which should be determined and named as risk spectral function. As a result, ES and VaR are special cases out of the above-mentioned relationship. Weighting functions should bear three conditions of non-negative, normal and weakly increasing.
The first two conditions which are always available mean that all weights should be non-negative and their total amount is equal to 1. It is also true for Value at Risk and expected shortfall. But the third condition illustrates risk aversion. This means that special weights for higher weights should be higher and/or equal with smaller losses.
Since all these weights are related to risk aversion of people in spectral risk measures, therefore they are increasing weights. The weight rate of weights depends upon people risk aversion. Therefore we should determine risk aversion of people in order to extract any weighting function in a risk spectral measurement. The most famous functions are
Exponential weighting Function and Power
Weighting Function.
Experimental History
Up to now there are lots of studies about various dimensions of future contracts. Regarding the importance of margin setting in structure of future interactions and their mutual relationship with most parameters of market, a considerable share of these studies are about optimization of margin setting in future contracts.
Hessieh could explain the importance of conditional non-harmonized model making in margin setting for the first time. He proposed that Conditional Probable Distribution Function could be useful in determining of margin setting [7].
By applying GARCH model, Cutter considered a conditional process for distribution of future prices (in order to evaluate any relevant issues with activity
characteristics of future price
Models [9]. By the use of Garch model and considering inter-activation of future contracts, Cutter and Langin calculated Fotsi Index and margin setting of future contracts [10]. Doud et al. considered spectral risk index and further advantages and disadvantages as well [11].
By the use of Risk Integrated measurements, Cutter and Doud evaluated the margin setting in any contracts for buying/selling contracts [12]. Jayans Varma evaluated in their research any situation of extracted stock exchanges in financial crisis of 2008.
They concluded that extracted stock exchange need to use Risk Integrated Measurement including expected shortfall for determining of margin setting [13]. In order to calculate required margin setting for outer-stock exchange extractions which are settled in stock exchange, Heller &Vaous used Risk Integrated measurements and concluded that the best solution for reducing of required guaranteed amount is to combine extracted interactions rooms out of the stock exchange [14].
In another research, the expected shortfall models have been calibrated with Value at Risk and other measurements for calculation of required guaranteed amount plus interest rate and future contracts. Then the result has been applied in historical margin setting of stock exchange [15].
Although there are not some considerable studies in this field in Iran, but there are only two specific researches in this spectral. In a research based upon statistics of future contracts of gold coin at Iranian Stock Exchange and by the use of multimodal GARCH model, Fallah could studied any effects of changing the margin setting on price, price fluctuations and volume of transactions.
According to the results, there is a negative relationship between increase of margin setting and price of future contracts and volume of transactions and also a positive relationship between increase f margin setting and price fluctuations of future contracts [16]. In another research, Karimi has calculated the margin setting of future contracts by the use of conditional value theory [17].
The present study has estimated required margin setting for buying/selling of gold coin future contracts in Stock Exchange by the use of Value at Risk and integrated risk measures such as expected shortfall and symbolic risk spectral based upon GARCH family models and traditional value models.
Then we have compared them accordingly. Regarding all applied models in this study, followings are relevant hypotheses of this research:
First Hypothesis
Value at Risk model and expected shortfall of GJR has better functions in any level of significance than GARCH model.
Second Hypothesis
Value at Risk model and symbolic GARCH expected shortfall has better functions in any level of significance than GARCH model.
Third Hypothesis
The average of estimated margin setting by all measures for selling positions is significantly higher than buying ones.
Research Methodology
This study is promotional-applicable from viewpoint of the goal and also a back-test study based upon data analysis as well. We have used maximum likelihood method for estimating of GARCH parameters. In addition, we used Simpson s Rule and p division into 10,000 pieces in order to calculate of risk integrated measure. Also we used Comp Econ calculations in MATLAB software. In order to measure acceptable rate of models from statistical viewpoint, we used Kupiec Backtest and Christffersen Conditional Coverage Test and also Lopez Loss Function and Blanco-Ihel for classification of expected shortfall models and also applied both loss functions including Mean Absolute Error (MAE) and Root Mean Squared Error (RMSE) as well[18]. We used MATLAB and SPSS software for estimation of parameters and also margin settings and test performances.
Data Collection Tools
cash prices of gold coin from 2008 up to 2015; therefore the local scope of this research is cash prices of gold coin in Iranian Market. Regarding the startup of future contracts at Iranian Stock Exchange from 2008, the time scope of this study is within 2008 up to 2015. Meanwhile the only applicable and active contract in Stock Exchange is based upon BaharAzadi Coin which has been started on 26.Nov.2008 up to now. It has included about 1991 interactional days. As a result, we used totally 1990 cash price output for gold coin. Furthermore, price logarithm differential has been used as entrance data in all estimations.
Research Models
It is necessary to have fluctuations modeling in order to calculate any value at risk and expected shortfall and risk measures. All fluctuations are modeled in this research by various models such as GARCH (1, 1), EGARCH (1, 1) and GJRGARCH (1, 1) as follows:
Conditional Variance Dissimilar Model Following is the Conditional Variance Model
σt2 = k + ∑𝑝𝑖=1𝛼𝑖ϵt−i2 + ∑𝑞𝑗=1β𝑖σt−j2
(4) Where GARCH (1, 1) k illustrates the fixed amount and 𝛼1 illustrates the regression coefficient of previous fluctuations and 𝛽1 illustrates the regression coefficient of final period. All parameters of this model are positive with relevant condition of:
𝛼 + 𝛽 < 1.
Exponential Conditional Variance Dissimilar Model (EGARCH)
By the use of this model, it is possible to make a model for leverage effects. According to the meanings of leverage effects by Black & French et al., all changes in price of an asset has a negative coefficient with the fluctuations as well[19]. There is not any limitation on coefficient sign in this model; therefore it is not necessary to make any limitations for non-negative coefficients. Secondly, in above-mentioned model, there are some positive and negative shocks for non-fixed condition as well. EGARCH (1, 1) model which is applied in financial literature is as follows:
𝑙𝑛𝜎𝑡2= 𝑘 + ∑𝑝𝑖=1𝛼𝑖𝜖𝑡−𝑖2 +∑𝑞𝑗=1𝛽𝑖𝑙𝑛𝜎𝑡−𝑗2 + ∑ 𝛾𝑖 ( |𝜖𝑡−𝑖|
𝜎𝑡−1 − √ 2 𝜋) 𝑝
𝑖=1 (5)
Parameter 𝛾 could measure any dissimilarity effects of shocks. If it is not zero, then it is a sign of dissimilar effect of shocks on fluctuations. If it is positive, it is a sign that positive shocks have more effects on conditional fluctuations than negative ones.
Conditional Variance Dissimilar Model of GJR
This method could make a model for non-comparable situation in GARCH process and has been presented by Glasten, Janathan and Ronkel. In case of more shocks in negative fluctuations, then this model is suitable for model making of fluctuations [20] .
σ2t = k + ∑𝑝𝑖=1𝛼𝑖ϵt−i2 + ∑𝑞𝑗=1β𝑖σt−j2 + ∑𝑖=1𝑝 γ𝑖𝐼𝑡−1 ϵt−i2 (6)
Coherent Risk Measures
The following formula is applied for calculation of Value at Risks after model making of fluctuations.
VARt+1,p =μt+1+σt+1ɸ−1(p) (7)
Where:
ɸ−1(p)= the standard normal distribution percentile
μt+1&σt+1 = are estimations of average and standard violation within t+1 which are calculated out of information
Expected shortfall based upon mentioned model is also calculated as follows [21]:
(8)
Where: 𝑓(𝑥𝛼)
= 𝐷𝑒𝑛𝑠𝑖𝑡𝑦 𝑜𝑓 𝑝𝑟𝑜𝑏𝑎𝑏𝑙𝑒 𝑛𝑜𝑟𝑚𝑎𝑙 𝑑𝑖𝑠𝑡𝑟𝑖𝑏𝑢𝑡𝑖𝑜𝑛 𝑓𝑜𝑟 𝛼 𝑡ℎ𝑝𝑒𝑟𝑐𝑒𝑛𝑡𝑖𝑙𝑒
In order to calculate exponential & power weighting functions, we should define suitable weighing functions as well. The most famous function is exponential weighting function and power weighting one. Following
t t
p x f
ES
) (
is the calculation method of Exponential weighting function: k e p k ke p 1 ) 1 ( ) (
(9)
Where absolute risk aversion coefficient is greater than zero and p is probable occurrence of each percentile. Therefore the following formulation illustrates Exponential Spectral Risk Measure.
(10)
Regarding the above-mentioned equation, following is the calculation method of exponential risk spectral measure for normal distribution with average 𝜇 and standard violation of𝜎: (11)
If we use Power weighting function instead of exponential weighting function, then power spectral risk measure is as follows for
standard normal distribution:
(12)
Where:
𝛾= Relative risk aversion coefficient
0(0< 𝛾 < 1)
Regarding the above-mentioned equation, following is the calculation method of power risk spectral measure for normal distribution with average 𝜇 and standard violation of 𝜎:
(13)
Verification of Models
For verification of models, we used a 2-step process. We applied Kupiec non-conditional coverage tests and Christopher son conditional coverage in first step. Then we used loss functions including Lopez second function of loss and Blancko-Ihel Loss function for comparing of models in second step.
We are searching for accuracy tests of models from statistical viewpoint in first step. In case of higher and real data (price changes) than estimated amount by model, then it is considered as a failed accident. In first step we are searching to find an answer to this question that whether it is possible to have probable equation in each test (it means model level of significance) according to the number of fails to total estimated amounts. As a result, accuracy of a value at risk model is tested from statistical viewpoint. If is not rejected, then it is accepted accordingly. Needless to state that all models are
approved in this step from statistical viewpoint. The major remained problem is selecting a suitable model from among approved ones. Therefore, we will have classification of models by suitable loss functions in second step. For better classification of models, we should specify the loss function from among different loss functions as well. The second Lopez Loss Function is one of the most applicable loss functions which is defined as follows:
t t t t t t t VaR ifL VaR ifL VaR L C 0 ) ( 1 2 (14)
This formulation makes it possible to calculate current losses in a sequence and provides more amounts to a model with higher sequence losses. Therefore in case of higher average of sequence losses will have weaker functions in return.
Ct
T
QPS 2 (15)
One of the defects of this model is lack of specific meaning for square of higher losses than VaR. It will make us so much confused. In order to solve this problem, Blanckko – Ihel have proposed the following loss function: t t t t t t t t VaR ifL VaR ifL VaR VaR L C 0 / )
( (16)
Intuition of this loss function is so much easy and will ensure us about higher losses than
1 0 1 0 ) 1 ( 1 ) ( ) 1 , 0( e z dp
e k dp q p SRM E M p p k k p ) 1 , 0 ( SRM E t σ + t u = SRM E = ) σ , μ ( M 1 0 1 0 1 ) 1 ( ) ( ) 1 , 0 ( dp p z p dp p q p SRM P
M
Ct. Meanwhile; we have comparison criteria
as follows:
t t t t
VaR
VaR
ES
P
17)Grade function for Blancko-Ihel model is as follows:
(18)
The obtained results illustrate the loss function of models. Higher amount of loss function in a model means weak operation of it [1]. In addition, for classification of expected shortfall models we will use Mistakes Absolute Estimated Loss function and also RMSE for selection the best model of expected shortfall.
Lower amount of these mistakes will naturally have better functions in return [18].
Descriptive statistics of data illustrates a wider sequence of normal distribution and skewed to the right for data. Jarque-Bera test has also similar results as well. As it is obvious in table 1, test statistics is greater than critical amount in error level of %5. Therefore we seriously reject normal output of prices. As it is obvious in descriptive statistics of data, the real reason is mainly tension of data more than ever. Regarding any presence of unique root, Dickey-Fuller test illustrates that any changes of prices are fixed with the intercept.
(19)
(20)
Table 1: Descriptive statistics of data & results of data normality test No. of
data
Elongation Skewness Standard violation
Mean Critical amount of test at error
level of %5
Test statistics
P-va lu e
Differential of price logarithms
1990 17.83 0.37 0.01585 0.00095 5.96 16899 0.0 01
Estimation of Garch Models Parameters
Firstly we made a GARCH model (1, 1) for all GARCH models in order to evaluate any self-regression and ARCH effect. Table 2 illustrates the results of estimations. We used Ljung-Box test for all zero assumption models. It means rejection of any lack of presence of any self-regression for disorder parts. Therefore all these data have a self-regression. In addition, we used ARCH LM
test for evaluation of any ARCH effects. ARCH test will seriously reject any presence of variance similarity in mistake parts.
Therefore it is acceptable to use GARCH models. The results of Ljung-Box & ARCH tests for square of standard parts after estimation of model parameters may approve the assumption of no more efficiency and variance similarity in different stops.
Table 2: The results of garch model parameters estimation
Parameters GARCH Exponential GARCH GJR GARCH
K 0.0 -0.685 0.0
Standard violation 0.0 0.099 0.0
𝛼 0.355 0.493 0.255
Standard violation 0.0270 0.031 0.03
𝛽 0.644 0.916 0.66
Standard violation 0.024 0.011 0.023
𝛾 -0.097 0.168
Standard violation 0.017 0.04
Determining of Data Framework for Estimation of Margin Setting
In order to benefit from data and estimate margin setting by the relevant measures, firstly we should determine mobile
framework of data. For this purpose, we should classify all data into two groups of inter-sample and outer-sample as well. For performing of after-test experiments and comparing of method with each other, we
2
) (
2
t t P
C T
QPS
2
) (
2
t t ES
C T
RMSE
t t ES
C T
used from data 1 to 990 and estimated under-risk vale by different methods for 991st period
with different level of significances. Then we used data 2 to 991st and relevant estimation
of 992nd period and so on up to final
estimation of 1990[21]. In order to calculate margin setting for buying/selling positions separately from higher and equal to zero data and smaller and equal to zero data, we
classified all processed buying/selling positions including 1134 and 1066 into two groups of inter-sample and outer-sample. Inter-sample data are applied for selling position of 634 data and buying position of 566 data. We made 500 estimations in each case. All estimations in this research will be performed with 3 levels of significances of 95, 99.9 and 99 percent.
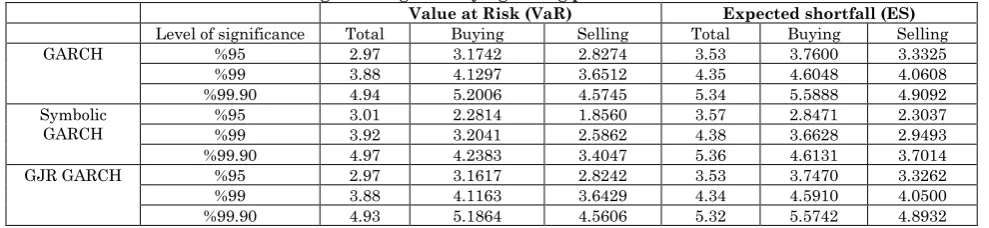
Table 3: The results of estimation margin settings for buying/selling positions with ES &var
Value at Risk (VaR) Expected shortfall (ES)
Level of significance Total Buying Selling Total Buying Selling GARCH %95 2.97 3.1742 2.8274 3.53 3.7600 3.3325 %99 3.88 4.1297 3.6512 4.35 4.6048 4.0608 %99.90 4.94 5.2006 4.5745 5.34 5.5888 4.9092 Symbolic
GARCH
%95 3.01 2.2814 1.8560 3.57 2.8471 2.3037 %99 3.92 3.2041 2.5862 4.38 3.6628 2.9493 %99.90 4.97 4.2383 3.4047 5.36 4.6131 3.7014 GJR GARCH %95 2.97 3.1617 2.8242 3.53 3.7470 3.3262 %99 3.88 4.1163 3.6429 4.34 4.5910 4.0500 %99.90 4.93 5.1864 4.5606 5.32 5.5742 4.8932
Tables 3 & 4 illustrate the estimation results of margin setting which are calculated by average margin settings for any selling & buying positions by symbolic & power spectral risk measurements and Value at Risk and expected shortfall.
Results
Tables 5 & 6 illustrate the results of back-tests of models. According to the results, it is understood that:
The percentage of all models in Christopher son conditional coverage test is approved at level of significance of %95 and %99. Meanwhile none of the models were approved at level of significance of %99.9. Since the conditional coverage test is the consequent of both LRUC and LRind tests, it is more
important. But as it is obvious in table 6,
there are some different results in both mentioned tests.
We classified value at risk models in accordance with Blancko –Ihel loss function and also Lopez 2nd loss function from which
Blancko-Ihelloss function is more suitable as well. In addition, we made necessary classification just for any models which have not yet rejected in first step.
No more models have been approved at level of significance of %99.9. GJRGARCH Model had the best functions among value at-risk models and expected shortfall at level of significances of %99 and %95. Therefore with regard to MAE and Blancko-Ihel criteria, we could approve the first hypothesis but it is not the same for second hypothesis.
Table 5: The results of margin setting at various level of significances & back-tests of models
Level of significance VaR Breakage rate LRcc LRind LRuc
GARCH %95 2.97 0.037 4.04 0.14 3.89 %99 3.88 0.014 3.06 1.62 1.43 %99.90 4.94 0.007 19.13 3.85 15.27 Exponential
GARCH %95 %99 3.01 3.92 0.038 0.014 3.53 7.90 0.24 6.46 3.29 1.44
%99.90 4.97 0.009 33.49 9.88 23.61 GJR GARCH %95 2.97 0.038 3.48 0.19 3.29
%99 3.88 0.019 7.20 0.73 6.47 %99.90 4.93 0.006 15.93 4.40 11.53
Table 6: The results of comparison of models at various level of significances with lopez, blancko –ihel, mae and rmse functions
Expected shortfall value at risk
95 rank 99 rank 99.9 95 rank 99 rank 99.9 GARCH ES 3.53 4.35 5.34 VaR 2.97 3.88 4.94
Standard deviation
1.98 2.45 3.00 Standard deviation
RMSE 0.003 (1) 0.00
49 (3) 0.0075 Lopez 0.074 (1) 0.0280 (1) 0.0140 MAE 0.0686 (2) 0.08
61
(2) 0.106 2
Blancko-Ihel
0.1112 (2) 0.0479 (2) 0.021 5 Exponential
GARCH Standard ES 3.57 4.38 5.36 VaR 3.01 3.92 4.97 deviation
1.75 2.16 2.65 Standard deviation
1.48 1.93 2.45
RMSE 0.003 (1) 0.00
47 (1) 0.0071 Lopez 0.0760 (2) 0.0280 (1) 0.0180 MAE 0.0695 (3) 0.08
69
(3) 0.106 7
Blancko-Ihel
0.1267 (3) 0.0546 (3) 0.024 2 GJR
GARCH Standard ES 3.53 4.34 5.32 VaR 2.97 3.88 4.93 deviation
1.98 2.44 2.99 Standard deviation
1.66 2.18 2.77
RMSE 0.003 (1) 0.00
48 (2) 0.0074 Lopez 0.076 (2) 0.0380 (2) 0.0120 MAE 0.0684 (1) 0.08
54
(1) 0.105 9
Blancko-Ihel
0.1103 (1) 0.0473 (1) 0.021 1
Table 7 illustrates the results of comparison tests for buying/selling positions for spectral risk measures. The results illustrate that estimated margin setting for selling positions are significantly greater than buying ones along with all GARCH models. Furthermore, the margin setting of sale is greater than
total margin setting in most models except in exponential GARCH model. There were similar results for both tests of value at-risk measures and expected shortfall. Therefore the third hypothesis is approved accordingly.
Table 7: Average comparisons test of estimated results out of spectral risk measures for buying/selling positions Absolute & estimated risk
aversion coefficients (K, 𝜸)
Comparing with all positions Comparing with buying positions
GARCH Exponential GARCH
GJR GARCH
GARCH Exponential GARCH
GJR GARCH Exponential
measure 1 5 0.00782* 0.00717* -0.00101* -0.00197* 0.00752* 0.00695* 0.00083* 0.00238* 0.00040* 0.00266* 0.00065* 0.00225* 25 0.00646* -0.00301* 0.00633* 0.00407* 0.00513* 0.00399* 100 0.00601* -0.00368* 0.00594* 0.00513* 0.00668* 0.00509* 500 0.00562* -0.00424* 0.00561* 0.00604* 0.00802* 0.00603* Power measure 0.1 0.00648* -0.00299* 0.00635* 0.00401* 0.00506* 0.00394* 0.5 -0.00152* 0.00722* 0.00748* 0.00164* 0.00159* 0.00149* 0.9 0.00797* -0.00079* 0.00765* 0.00047* 0.00012 0.00029*
Conclusion
Regarding the importance of margin setting in future contracts as an important function and in fact better chances for the holders, the calculation method of margin setting by interaction room is always so much important. Upon estimation of expected margin setting in future contracts and by the use of value at-risk models and expected GARCH shortfall based upon Normal disorders and T-student, exponential GARCH and GJR GARCH, we find out different results in this study. Therefore upon
applying of back-tests we may find out a general conclusion.
All models had no more suitable functions at high levels of significance. Furthermore, GJRGARCH model had better functions than other models. This is a sign of dissimilar reactions of gold coin price fluctuations against negative/positive shocks. In addition, all estimated amounts for margin setting are significantly greater than sales and by the use of all measures. This is a sign of dissimilar reaction of price fluctuations to negative/positive shocks.
References
1. AbdehTabrizi H, Radpour M (2009) Measuring & Market Risk management: Value At-risk attitude. Tehran: Agah Press
3. Hull J (1993) Options, futures and other derivatives. New Jersey: Prentice Hall. 4. Broussard JP (2001) Extreme-value and
margin setting with and without. The Quarterly Review of Economics and Finance, 41,365-385.
5. Longin F M (1999) Optimal Margin Levels in Futures Markets: Extreme Price Movements. Journal of Futures Markets, 19,127-152.
6. RahnamayRoudposhti F, NikooMaram H ToloeiOshlaghi A, Hussein ZadehLotfi F, Bayat M (2015) Optimization of Portfolio based upon fixed model and classic optimization, Financial Engineering & Management of Stock Notes Magazine, 23, 29-59
7. Hsieh DA (1991) Chaos and Nonlinear Dynamics: Application to Financial Markets. Journal of Finance, 46, 1839-1877.
8. Cotter J (2001) Margin Exceedances for European Stock Index Futures using Extreme Value Theory. Journal of Banking and Finance, 25, 1475-1502. 9. Knott R, Polenghi M (2006) Assessing
central counterparty margin coverage on futures contracts. London: Bank of England.
10.Cotter J, Longin F (2004) Margin requirements with intraday dynamics. Working paper.
11.Dowd K, Cotter J, Sorwar G (2008) Spectral Risk Measure: Properties and Limitation. Nottingham.
12.Cotter J, Dowd K (2006) Spectral Risk Measures with an Application to Futures Clearinghouse Variation. Dublin: University College Dublin. School of Business. Centre for Financial Markets.
13.Varma JR (2009) Risk Management Lessons from the Global Financial Crisis for Derivative Exchanges. Working paper. 14.Heller D, Vause N (2012) Collateral Requirements for Mandatory Central Clearing of Over-the-Counter Derivatives. BIS Working Paper 373.
15.Garcia CC, Henrard M, Macrina A (2016).Estimation of Future Initial Margins in a Multi-Curve Interest Rate Framework. London, WC1E 6BT, United Kingdom.
16.Fallah J (2014) Any effects of changes of margin setting on market of gold coin future contracts at Iranian Stock Exchange. Tehran: PhD. Thesis (Non-published). Islamic Azad University, Research Sciences Branch.
17.Karimi S (2012) Calculation of margin setting of future gold coin contracts by the use of Conditional Value Theory. Tehran: Master of Science Thesis (Non-published), Sharif University
18.Žiković S (2008) Friends and Foes: A Story of Value at Risk and. Dubrovnik: 14 Dubrovnik Econometric conferences. 19.French KR, Schwert GW, Staumbaugh
RF (1987) Expected Stock Returns and Volatility. Journal of Financial Economics, 19, 3-29.
20.Glosten LR, Jagannathan R, Runkle DE (1993) On the Relation between the Expected Value and the Volatility of the Nominal Excess Return on Stocks. Journal of finance, 5, 1779-1801.