Computer Science and Software Engineering
ISSN: 2277-128X (Volume-7, Issue-6)
2017
Wetland Mapping of Sundar Ban Delta Using Automatic
Feature Extraction
1
Arvind Pandey*, 2Vineet Pal, 3Ritu Goyal, 4Kishor C Kandpal, 5Nisha Chand, 6Jyoti Bari
1, 2, 3, 4, 6
Department of Geography, SSJ Campus Almora, Uttarakhand, India
5
Department of Geography, L S M G P G College, Pithoragarh, Uttarakhand, India
DOI: 10.23956/ijarcsse/V7I6/0263
Abstract: The automatic extraction of objects from data and images has been a topic of research for decades. This paper proposes an improved snake model that focuses on automatic feature extraction from colour aerial images and satellite images data. A snake is defined as an energy minimizing spline guided by external constraint forces and influenced by image forces that pull it toward features such as lines or edges. Based on the radiometric and geometric behaviours of feature, the snake model is modified in two areas: the criteria for the selection of initial seeds and the external energy function. The proposed snake model includes a new height similarity energy factor and regional similarity energy. The snake approaching the object contours. Compared with the traditional snake model, this algorithm can converge to the true feature contours more quickly and more stably, especially in feature environments. Examination of the results shows that wetland feature extracted from a dense and complex area using supervised classification shape accuracy, whereas the improved automatic feature extraction method has a good shape and area accuracy.
Key Words: Wetland, Remote Sensing, Mapping, Classification Change.
I. INTRODUCTION
It is increasingly realized that the planet earth is facing grave environmental problems with fast depleting natural resources and threatening the very existence of most of the ecosystems [1]. One of the difficulties most frequently faced for decision making is lack of scientific data of our natural resources [2]. Often the data are sparse or unconvincing, rarely in the form of geospatial database (map), thus open to challenges [3]. Thus, the current thrust of every country is to have an appropriate geospatial database of natural resources that is based on unambiguous scientific methods [4]. Wetlands are one of the crucial natural resources. Wetlands are areas of land that are either temporarily or permanently covered by water [5]. This means that a wetland is neither truly aquatic nor terrestrial; it is possible that wetlands can be both at the same time depending on seasonal variability. Thus, wetlands exhibit enormous diversity according to their genesis, geographical location, water regime and chemistry, dominant plants and soil or sediment characteristics [6]. Because of their transitional nature, the boundaries of wetlands are often difficult to define [8]. Wetlands do, however, share a few attributes common to all forms. Of these, hydrological structure (the dynamics of water supply, throughput, storage and loss) is most fundamental to the nature of a wetland system. It is the presence of water for a significant period of time which is principally responsible for the development of a wetland. Remote sensing and GIS provide powerful tools for data acquisition, spatial analysis, and graphical display. Recent applications have demonstrated the importance of these technologies to wetland mapping [8], [9]. Multiple satellite sensors (Landsat TM/ETM+, MODIS, and ALOS/PALSAR) also provide reliable data sources that reveal the dynamic changes of wetlands [10], [11]. MODIS time-series vegetation indices have a great capacity to monitor wetlands in large-scale regions. However, the coarse spatial resolution (or the mixed pixel problem) may reduce the classification accuracy from county to regional scale. Landsat TM/ETM+ imagery with fine spatial resolution (30 m) will significantly improve the classification results. More importantly, the United States Geological Survey (USGS) has gradually made Landsat imagery free over the Internet since 2008 [12]. Before this move, high cost and limited access were two major reasons for the underutilization of Landsat imagery [13]. The Landsat TM/ ETM+ instrument has seven to eight spectral bands for NDVI and LSWI calculations, but its long revisit cycle (16 days) makes time-series analysis difficult. To date, reports on the use of Landsat-derived LSWI and NDVI to detect and map wetlands remain scarce.
Objective
II. STUDY AREA
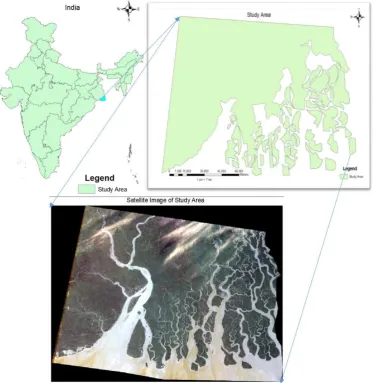
The great Ganga Delta is one of the largest wetland area. 60% area are in Bangladesh and 40% delta are in India. In India is called Sunder ban Delta which is in West Bangle and location is 87°45'57.962"E, 22°35'28.616"N to 89°0'14.978"E, 22°24'54.616"N and 87°32'4.256"E, 21°36'19.628"N to 89°6'10.252"E, 21°28'17.61"N
Fig. 1 Study Area with Satellite Imagery.
III. DATA AND METHODOLOGY
In this research work we have used Landsat-5 data used for mapping of Wetland area. Landsat-5 satellite imagery is divided into 7 bands which are useful for easy interpretation of an area visually. Landsat satellite covers 26896 Sq. Km Area in an image. In this research SWIR and NDVI Models are used and usage of Short wave band, Near Infrared band and Red band were used for the calculation of SWIR and NDVI.
A unique physical feature of the given wetlands is the seasonal change of land-cover types annually covered by exposed soils, shallow flooding water, and wetland plants. Spectral image data show great promise for capturing the notable land-cover changes of the wetlands at different time windows. For example, the Red (0.63μmto0.69μm) and near infrared (NIR, 0.76μmto0.90μm) bands are mostly used to calculate the Normalized Difference Vegetation Index (NDVI) (Tucker1979) for monitoring the growth condition of Wetland plants. Moreover, the short-wave infrared (SWIR, 1.55μmto1.75μm) band is highly sensitive to soil/leaf water content [14], [15] and is used together with NIR in the formula of the Land Surface Water Index (LSWI). Note that LSWI is the negative of the Normalized Difference Built-up Index [16]. Both indices are calculated as normalized ratios between NIR and SWIR bands. In particular, a temporal anomaly exists between NDVI and LSWI during the period of flooding and transplanting of wetland plants [17]. The majority of previous research on wetland detection and discrimination generally utilized the physical features of wetlands through phonological variations of vegetation indices derived from digital imagery. For instance, Karlsen et al. (2008) developed a new combined pixel-specific NDVI threshold and decision rule-based mapping method to determine the onset and end of the growing season.
IV. WETLAND MAPPING
V. SEGMENTATION
Image segmentation process is important for object oriented image analysis because this technique works on image objects and segmentation to create image as object. Segmentation algorithm is used to subdivide entire image as a pixel based image, or specific image objects from other domains into smaller image objects. Segmentation is pixel based classification which Aims to extract or segment, object or region from the background and by which pixel in one or more images are groped in to segments or object that share a homogenous spectral similarity. It is a critical pre-processing step to the success of image recognition, image compression, image visualization and image retrieve.
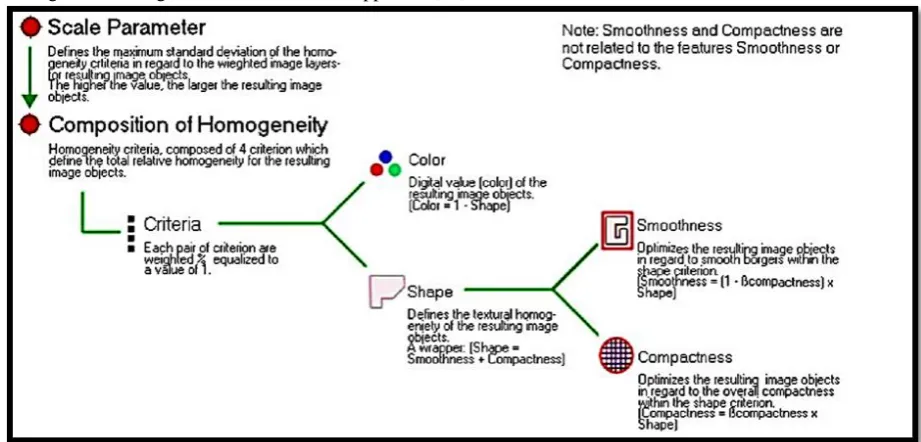
VI. MULTI-RESOLUTION SEGMENTATION
Multi-resolution segmentation is new procedure for image object extraction. It allows the segmentation of an image in to a network of homogenous image region at any chosen resolution. Multi-resolution segmentation separates adjacent regions in an image as long as they are significantly contrasted-even when the region themselves are characterized by a certain texture or noise. Thus, even textured data can be analysed. Homogeneous image objects provide a signal-to-noise ratio compared to single pixel as to the attributes to be used for classification. Thus independent of multitude of additional information, the classification is more robust. It produces highly homogeneous segments in any chosen resolution, fitting your purpose. The resulting image segmentation can be universally applied to almost all data types. It is especially suited for high resolution data or highly textured data (e.g., radar). Multi-resolution segmentation is a well-known technique to segment image objects into homogenous patterns. Object dimension such as size, shape and texture etc. can be measured. Multi-resolution segmentation is a base of image object-based classification [18]. Not just segmentation, and object-based classification is combined with other algorithm such as fuzzy theory, and some knowledge on the image is also added into the approach [19].
Fig. 2. Multi-resolution Concept
Working of Multi- resolution Segmentation
The Spectral Difference Segmentation algorithm merges neighbouring image objects according to their mean image layer intensity values. Neighbouring image objects are merged if the difference between their layer mean intensities is below the value given by the maximum spectral difference.
This algorithm is designed to refine existing segmentation results, by merging spectrally similar image objects produced by previous segmentations. It cannot be used to create new image object levels based on the pixel level domain. Parameters
wn [k1,k2,k3] are the normalized layer weights w [k1,k2,k3]
,
Image classification using object feature customizing and fuzzy logic
Object feature customizing analysis approach combines spectral as well as spatial information, so in this approach not only the spectral information of the image is used in classification but it’s textural and context information is also used. The main advantage of this approach is that we can analyse groups of pixels rather than individual pixels. With the help of object feature customizing we create on formulas for extract feature easily. After the Segmentation process applying on the image the next step is calculation of range or DN value of different band combinations and composite bands with various parameters by using feature view tool in e-Cognition, to assign the membership value for classify the objects. Different logical operators are used to support combining of different features within one class. Classification is done using set of rule. Ranges for each parameters feature are calculated. The highest and lowest values of homogeneity for wetland are calculated. In some texture feature wetland are not differentiable with surroundings, so range identification for such features are not possible. Only few texture features range is calculated.
Object feature customizing we use the LSWI and NDVI NDVI and LSWI
The NDVI and LSWI are calculated from the surface reflectance of Red, NIR, and SWIR bands of Landsat TM/ETM sensor with the following formulas
LSWI= Land surface water index
NDVI= Normalized Difference Vegetation Index
Where NIR, R, and SWIR are the reflectance in the NIR, Red, and SWIR bands, respectively
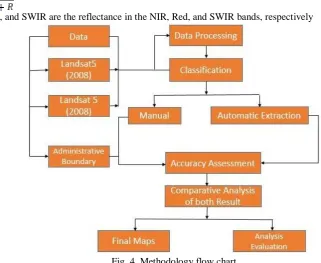
Fig. 4. Methodology flow chart
VII. RESULT
The required highest and lower threshold values for NDVI and LSWI feature parameter has been selected based on statistical analysis. Table 5. Shown that how wetland and other features have increased from 2005-2008 by 34.15 to 34.31 by manual classification and 33.84 to 34.48 by automatic classification. Which shows both the classification techniques are same somehow but varies in the processing time and accuracy, here automatic classification seems to have good accuracy more than 90% and which less time consuming then manual classification. Hence the study shows the positive result over the sunder ban delta.
Figure 5. Classification Result.
Table 1 is show the compression of the classification result.
Features
Manual
Classification (Area in Sq.Km.)
Automatic Extraction (Area in Sq.Km.)
Change
(Area in Sq.Km.)
Year 2005 2008 2005 2008 2005 2008
Wetland 5601.99 5601.90 5524.65 5629.25 27.34 77.34
Water 5380.15 5379.79 5396.18 5394.14 14.36 -16.03
Other Feature 5342.83 5343.27 5404.13 5301.57 -41.70 -61.30
Total 16324.97 16324.97 16324.97 16324.97
Comparison
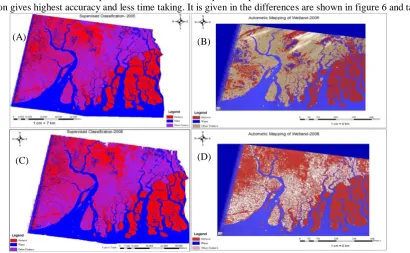
In this present study, two algorithms for wetland mapping i.e. manual classification and automatic feature extraction. The spectral parameters used for the extraction of wetland are NDVI and LSWI. We have used Landsat 5(TM) data 2005 and 2008 with 30 * 30 spatial resolution. If we compare the process & result from both methods, automatic classification gives highest accuracy and less time taking. It is given in the differences are shown in figure 6 and table 1.
Figure 6. (A) Showing the manual classification result of 2005 imagery, (B) is showing 2005 automatic classification, (C) Showing 2008 image manual classification and (D) is showing 2008 automatic classification result.
(A) (B)
Below Table show Result area in Sq. Km.
Manual Classification Automatic Classification
2005 2008 2005 2008
Feature Area
(Sq.Km)
Area (Sq.Km)
Difference Feature Area
(Sq.Km)
Area (Sq.Km)
Difference
Wetland 5601.99 5601.90 -0.088 Wetland 5524.65 5629.24 104.59
Water 5380.15 5379.79 -0.38 Water 5396.18 5394.15 -2.035
Other Feature 5342.83 5343.27 -258.72 Other Feature 5404.13 5301.57 -102.56
VIII. CONCLUSION
Geo-spatial technology is a powerful tool to determine wetland area using satellite imagery. Remotely sensed data can be used effectively in wetland detection and mapping. In this research, we proposed a method based on the unique physical feature of wetlands and highlighted the seasonal change among exposed soils, shallow water cover, and growing wetland plants. To analyse the qualities of wetland mapping results, the supervised classification and object-oriented methods were selected and compared both method. Evaluation and comparison show that wetland mapping by the proposed method can achieve the highest accuracy. The results of wetland detection were very satisfactory, indicating that the approach of NDVI and LSWI during an optimum temporal window holds great potential in mapping wetlands. We have run the data processing using two software to determine the better accuracy.
ACKNOWLEDGMENT
We are thankful to Prof. J. S. Rawat, Head of Geography, SSJ Campus Almora, and Dr. Pankaj Kumar Bhatt, LSM GPG College, Pithoragarh, Kumaun University, Nainital for provide the facility. And we also thank to Mr. Naveen Chandra, for given excellent idea to complete this study.
REFERENCES
[1] Dryzek, J.S., 2013. The politics of the earth: Environmental discourses. Oxford University Press.
[2] Fiorino, D.J., 1990. Citizen participation and environmental risk: A survey of institutional mechanisms. Science, Technology, & Human Values, 15(2), pp.226-243.
[3] Priya, J., 2014. Geo-Spatial approach in Soils and Land resource mapping of Katihar district of Bihar (Doctoral dissertation, Deptt. of Soil Science & Agricultural Chemistry, BAU, Sabour).
[4] Sharma, N., Pradhan, S., Arrawatia, M.L. and Shrestha, D.G., 2010. Study on types and distribution of wetlands in Sikkim Himalayas using satellite imagery with remote sensing and GIS technique.
[5] Anderson, J.R., 1976. A land use and land cover classification system for use with remote sensor data (Vol. 964). US Government Printing Office.
[6] Keddy, P.A., 2010. Wetland ecology: principles and conservation. Cambridge University Press.
[7] Akcay, H. and Aksoy, S. (2008). Automatic detection of geospatial objects using multiple hierarchical segmentations, IEEE Transactions Geosciences Remote Sensing, 46(7): 2097-2111.
[8] Chris, L. L., William, H. B., & Jerry, L. W. (2002). Testing a GIS model of habitat suitability for a declining grassland bird.Environ Manag, 30(1), 88–97.
[9] Weiers, S., Bock, M., Wissen, M., & Rossner, G. (2004). Mapping and indicator approaches for the assessment of habitats at different scales using remote sensing and GIS methods. Landsc Urban Plan, 67, 43 – 65.
[10] Okamoto, K. and Fukuhara, M., 1996. Estimation of paddy field area using the area ratio of categories in each mixel of Landsat TM. International Journal of Remote Sensing, 17(9), pp.1735-1749.
[11] Zhang, X., Wang, M. and Liang, X., 2009. Quantitative classification and carbon density o f the forest vegetation in Lüliang Mountains of China. Plant ecology, 201(1), pp.1-9.
[12] Woodcock, C. E., & Allen, R. (2008). Free access to Landsat imagery. Science, 320 (5879), 1011. doi: 10.1126/science.320.5879.1011a.
[13] Martínez-Casasnovas, J.A., Martín-Montero, A. and Casterad, M.A., 2005. Mapping multi-year cropping patterns in small irrigation districts from time-series analysis of Landsat TM images. European Journal of Agronomy, 23(2), pp.159-169.
[14] Hunt, E.R. and Rock, B.N., 1989. Detection of changes in leaf water content using near-and middle-infrared reflectances. Remote sensing of environment, 30(1), pp.43-54.
[15] Muthukumar, V.S., Kiran, J.K., Reppert, J., Satyajit, R., Krishna, V., Rao, G.N., Krishnan, S.S.R., Sai, S.S.S., Venkataramaniah, K. and Rao, A.M., 2008. Nonlinear optical transmission of surface-modified nickel sulfide nanoparticles: saturation of absorption and optical limiting. Nano, 3(03), pp.161-167.
[16] Zha, Y., Gao, J. and Ni, S., 2003. Use of normalized difference built-up index in automatically mapping urban areas from TM imagery. International Journal of Remote Sensing, 24(3), pp.583-594.
[17] Xiao, X., Boles, S., Liu, J., Zhuang, D. and Liu, M., 2002. Characterization of forest types in Northeastern China, using multi-temporal SPOT-4 VEGETATION sensor data. Remote Sensing of Environment, 82(2), pp.335-348.
[19] Li, X., Zhao, S., Rui, Y. and Tang, W., 2007, June. An object-based classification approach for high-spatial resolution Imagery. In Proc. of SPIE Vol (Vol. 6752, pp. 67523O-1).
[20] Adger, W.N. and Luttrell, C., 2000. Property rights and the utilisation of wetlands. Ecological Economics, 35(1), pp.75-89
[21] Aytekin, O., Erener, A., Ulusoy, I. and Düzgün, H. S. (2009). Automatic and Unsupervised Building Extraction in Complex Urban Environments from Multi-Spectral Satellite Imagery, 4th International Conference on Recent [22] Advances in Space Technologies, Space for the Developing World, RAST 2009, Istanbul, Turkey, June 2009. [23] Baatz, M.A.S. (1999). Object-Oriented and Multi-Scale Image Analysis in Semantic Networks. In: Proc. of the
2nd International Symposium on Operationalization of Remote Sensing (Enschede. ITC).
[24] Hongjian, Y. and Shiqiang, Z. (2006). 3D building reconstruction from aerial CCD image and sparse laser sample data. Optics and Lasers in Engineering, 44(6), 555–566.
[25] Jensen, J. R. (2005). Introductory Digital Image Processing: A Remote Sensing Perspective. Third Edition, Pearson Prentice Hall, Upper Saddle River.
[26] Jensen, J. R. (2006). Remote Sensing of the Environment: An Earth Resource prospective. Pearson Education Low price edition, New Delhi.
[27] Ji, M. and Jensen, J. R. (1996). Fuzzy Training in Unsupervised Digital Image Processing. Geographic Information Science, 2(1): 1-11.
[28] Katartzis, A. and Sahli, H. (2007). A stochastic framework for the identification of building rooftops using a single remote sensing image. IEEE Transactions on Geosciences and Remote Sensing46, 259-271.
[29] Maas, H. G. (1999). The potential of height texture measures for the segmentation of airborne laser scanner data. Fourth International Airborne Remote Sensing Conference and Exhibition/21st Canadian Symposium on Remote Sensing, Ottawa, Canada, pp. 154–161.
[30] Marhe, T. R., Kerle, N., Van, C. J. and Kumar, K. V. (2012). Object-oriented Analysis of multi-temporal panchromatic images for creation of historical Landslide inventories. ISPRS Journal of Photogrammetry and Remote Sensing, 67: 105–119.
[31] Acreman, M. C., Fisher, J., Stratford, C. J., Mould, D. J., & Mountford, J.O. (2007). Hydrological science and wetland restoration: some case studies from Europe. Hydrol Earth Syst Sci, 11,158–169.
[32] Baatz, M., & Schäpe, A. (2000).Multiresolution segmentation–an optimization approach for high quality multi-scale image segmentation (pp. 12–23). Heidelberg: Angewandte Geographische Information sverarbeitung XII. Wichmann-Verlag.
[33] Baker, C., Lawrence, R., Montagne, C., & Patten, D. (2006). Mapping wetlands and riparian areas using landsat ETM+image and decision tree based models. Wetlands, 26(2), 465–474.
[34] Bedford, B. L. (1999). Cumulative effects onwetland landscapes: links to wetland restoration in the United States and southern Canada.
[35] Wetlands, 19(4), 775–788. Cai, Z. C., & Xing, G. X. (1997). Methane and nitrous oxide emissions from rice paddy fields as affected by nitrogen fertilisers and water management. Plant Soil, 196(1), 7–14. Doi : 10.1023/ A:1004263405020.
[36] Castaneda, C., & Ducrot, D. (2009). Land cover mapping of wetland areas in an agricultural landscape using SAR and Landsat imagery.J Environ Manag, 90, 2270–2277.