Abstract
Objective: To assess, the degree of adherence to Mediterranean Diet (MD) in Syrian young people, and studying the effect of some variables on Mediterranean Adequacy Index (MAI) value and its comparison with other studies in Spain and Mediterranean area. Background: It has been observed that the Syrian population, especially the young ones, are abandoning the (MD), which affects in long term their health, the same has been observed in Spanish youth. The longitudinal study of the “seven counties” involved active rural population in Italy, was firstly demonstrated the progressively abandoning of MD. Methods: The sample under the study was 204 young people (41.7% men and 58.3% women) in the area of Damascus (65% were students). They filled in a semi-quantitative Food Frequency Questionnaire, then the Mediterranean Adequacy Index (MAI) was computed by dividing the sum in gram of typical Mediterranean food Groups (Cereals, Legumes, Fruits, Fish), by the sum in gram of non-typical Mediterranean food groups (Meats, Eggs, Cookies and cakes, dairy). It was used the SPSS program to study the correlation between the variables and MAI of the sample. Results: The average MAI of the young sample was (1.17) which is lower than another study in Spanish young people and much lower than 7.2 in Italy several decades ago. Those results demonstrated that the young Syrian are abandoning the Mediterranean Diet as well as the Spanish young people. The caloric profile has changed over time that results in lower consumption of carbohydrates and higher consumption of protein and lipids, similar to almost Mediterranean area. Moreover the war has an impact on the type of food consumed which affect MAI. The lipid profile (measured by the cocient of intake of Mono Unsaturated Fatty Acids (MUFA) and Poly Unsaturated Fatty Acids (PUFA) divided by Saturated Fatty Acids (SFA) of the sample was 3.71 better than other studies in Spain 1,69, 1,71 (the recommended value should be > 2). This illustrates a moderate consumption of olive and vegetable oil, but poor consumption of meat and eggs in contrast of Spanish diet.
Keywords: Lipid Profile, Mediterranean Diet Adequacy Index, Nutritional Assessment, Syrian Mediterranean Diet
Mediterranean Adequacy Index in
Young People in Syria
Malda Atasi
*Syrian Private University, Syria; [email protected]
1. Introduction
The Mediterranean Diet (MD) is prescribed as a diet used in countries that grow in abundance the olives trees1,there
is an association between healthy lifestyle and the intake of fruits, vegetables and legumes2,3, the MD includes
vegetables, fruits, fish, nuts and olive oil, which in turn contains a lot of minerals, antioxidants and vitamins4,5 that
are involved in the production of energy such as vitamins B6, B2, B1, B9 and B12 and minerals (magnesium and phosphorus), all of these have good effect on heath. Studies have demonstrated the effect of this diet in the prevention of Non-Communicable Diseases (NCDs) including Cardiovascular Diseases (CVDs) and chronic degenerative diseases7,8-12.
Syria is a middle-income country on the Eastern shore of the Mediterranean Sea. According to earlier investigations, Syria is host to three different dietary patterns: The Western, characterized by a high consumption of pizzas and pies, soda drinks, fast food sandwiches and sweets; the Prudent, consisting mostly of low fat milk and dairy products, whole bread, in addition to the Traditional Syrian pattern which encompasses high intakes of fruits, vegetables, legumes and olives.
The effects of globalization are producing a change in the lifestyles of Mediterranean, especially in the eating habits of young people, as being the most exposed to the various changes to cross-border problems8.
esthetic patterns, are some of the factors that influence their adherence to the Mediterranean diet. In case of the university students, added to all this, they are assuming new responsibilities in the purchase of food, the preparation of their menus and the organization of some meal times that prove to be rather irregular. In fact, it has been identified deficiencies in their intakes of micronutrients, which are far from the recommendations of the Mediterranean diet11,12. This change in dietary
habits can affect their health. Recent studies have found an association between the frequency of consumption of foods of the university students and stress, depression13
and obesity14.
The purpose of this study is to compare the index used in the sample of young people in Syria with other indexes that have been used to measure adherence to Mediterranean diet in Mediterranean Europe countries, and the effect of some variables on MAI in the young people. We have used Mediterranean Adequacy Index (MAI), whenever the result is higher the following of Mediterranean diet is greater.
2. Methodology
This is a descriptive statistics for sample, to calculate the adherence to Mediterranean diet, using a direct retrospective method to estimate the individual food intake through the Food Frequency Questionnaire (FFQ) in a population of 204 persons of 18-28 years chosen randomly between August and November 2015, the sample included students from various universities, officials, employees and housewives and unemployed of several economic levels. The sample was chosen in Damascus but constitute people who were transferred from other provinces.
2.1 Questionnaire
The questionnaire is of own processing, contains five pages and 31 questions on 32-items semi-quantitative FFQ that have been consumed during the previous year of the interview. It was tested on a convenient sample to check for clarity and cultural sensitivity.
The collection of information took place between the months of august to November 2015. It was explained in detail the purpose of the study and the participation of the subjects. Then they were a personal interview that included the structured questionnaire, with which the data was collected from the student personal and a
questionnaire on food consumption frequency. For each food item listed in the FFQ, a standard portion size was indicated, in home care measures, which reflects the average amounts of each food consumed by our people, the subjects should indicate how often (never or almost never, number of times a month, number of times a week or number of times a day) consumed, on average of the food contained in the list in the amount indicated, in the last year. Participation was voluntary and anonymous and prior to filling in the questionnaires, they were assured that their responses would be used only for research purposes and the information given would be treated with the utmost care and confidentiality.
The food frequency list contained fresh fruit; cooked vegetables; raw vegetables; potatoes, rice and pasta, bread and cereals; legumes (including beans, lentils); fish, meat, poultry and eggs; dairy (including milk, cheese and yoghurt); snacks (Biscuits, nuts, etc.); cakes. Concerning beverages, the categories were: soft drinks; wine; beer and spirits20.
2.2 Dietary Assessment
On the basis of the data obtained on the food intake-food, amount of the same, frequency of consumption of food– it will be used to determine the contribution of nutrients that the intake provides to the study population. The conversion of food into nutrients is performed by the computer program “Alimentador”, based on Spanish Food Composition Tables21. The results are expressed as a daily
average in grams, (as appropriate) consumed per day. First, it was converted the different frequencies of food consumption listed (the next day, week, month) in frequency/day (by multiplying the number indicated by 1, 7, 30 respectively), then it was calculated the weight in grams of portions in the FFQ which are listed as home measures. And, finally, were calculated the gram per day of each food, depending on the frequency per day obtained in the previous step. Dismissing those food whose consumption was equal to or less than 5 g per day, considering its contribution of nutrients not significant to the total diet.
It was introduced in the “Alimentador” Program, the grams/day of each food, to get the nutrient content of each one of them. It was determined the following nutrients: energy (kcal), proteins (g), carbohydrates (g), total lipids (g), SFA (g), MUFA (g), PUFA (g), cholesterol (mg).
(PUFA) plus Monounsaturated Fatty Acids (MUFA) divided by Saturated Fatty Acids (SFA).
2.3
Anthropometric Study and Other
Variables
The following variables were included in the analysis: Age, sex, anthropometric variables (height, weight, body mass index and waist circumference). BMI was calculated as weight (kg) divided by the square of height (m2). In
the present study, the BMI classification of the WHO was used (WHO, 1997), classifying overweight as BMI 25–29.99 kg/m2 and obesity as ≥30 kg/m2. A BMI < 18.5
kg/m2 is classified by the Center for Disease Control
and Prevention as an underweight condition. It was considered a metabolic risk if the waist circumference was greater than or equal to 102 cm in males and 88 cm in female22,23.
The Mediterranean Adequacy Index (MAI) evaluating the extent of adherence to the Mediterranean food pattern (as proposed by Alberti-Fidanza et al(54) (table1).
The diet quality was broadly defined as low adherence to Mediterranean food pattern (MAI≤1.75), medium adherence to MD (1.75<MAI<2.75) and high adherence to MD (MAI>2.75).
A national reference index must be based on the diet followed by a population with low risk factors of chronic diseases. When the values of MAI are higher than a reference index for a population, the reason can be found in the influence of too high an intake of certain Mediterranean foods such as cereals, legumes and olive oil and/or too low an intake of certain non-Mediterranean foods such as animal foods. Therefore the interpretation of the ratio has to be based not only on typical Mediterranean and non-Mediterranean foods, but also on the distribution of the same typical Mediterranean foods.
The MAI was calculated using gram/day: MAI = SUM of grams from (Cereals+legumes+Potatoes+Veget
ables+Fruits fresh and dry+Fish+Olive oil)/grams from (Milk+Cheese+Yogurt+Meats+Eggs+Animal fats and Margarines+Sweet beverages+Cakes/Pies+cookies or biscuits).
2.4 Statistics
We have used spearman correlation for lipid profile and MAI and other variables but we used Grammer between levels of MAI and BMI. We used One way Anova between gender and MAI.
3. Results
The sample was composed of (41.7%) of men and (58.3%) of women, it was divided by their adherence to Mediterranean diet, as shown in table 1, Into three groups: group 1: Medium adherence (2.06±0.2), group 2: High adherence (4.85±1,9) and group 3: Low adherence (0.84±0.4). There were statistical differences between the three groups, participants in the lowest tertile were 85.3% and the highest tertile were 6.4%. Most of the sample had low adherence to Mediterranean diet (42% of male and 58% of female), there was significance difference between levels of MAI in men and women p value<0.001 (Table 1). 65% of them were students and had low adherence. Table 1. Classification of the sample into 3 groups according to their MAI
Group 3 MAI <1.75 Low adequa-cy to MD
Group 2 MAI>2.75 High ade-quacy to MD
Group 1 1.75<MAI<2.75
Medium ade-quacy to MD
Diet quality parameter
174 (85.3%) 13 (6.4%) 17 (8.3%) N
(percent-age)
0.84 ± 0.4* 4.85 ± 1.9* 2.06 ± 0.2* MAI (average
± SD) *p<0.001 statistical difference
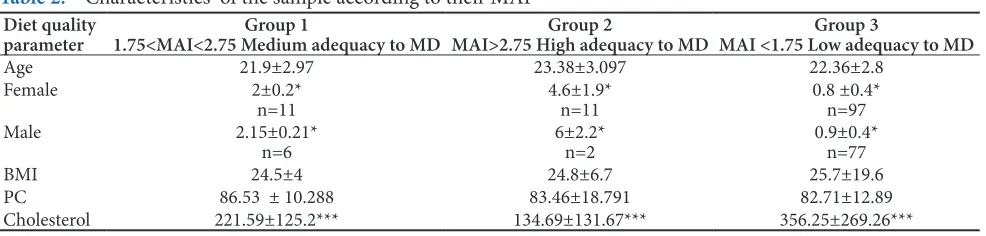
The anthropometric characteristics of the sample are presented in Table 2.
Table 2. Characteristics of the sample according to their MAI
Group 3
MAI <1.75 Low adequacy to MD Group 2
MAI>2.75 High adequacy to MD Group 1
1.75<MAI<2.75 Medium adequacy to MD Diet quality
parameter
22.36±2.8 23.38±3.097
21.9±2.97 Age
0.8 ±0.4* n=97 4.6±1.9*
n=11 2±0.2*
n=11 Female
0.9±0.4* n=77 6±2.2*
n=2 2.15±0.21*
n=6 Male
25.7±19.6 24.8±6.7
24.5±4 BMI
82.71±12.89 83.46±18.791
86.53 ± 10.288 PC
356.25±269.26*** 134.69±131.67***
221.59±125.2*** Cholesterol
From the weight and size, it was calculated BMI of the sample, whose average value indicatedabnormality and tendency to overweight (25.5±18.1), males more than female (27.34±23.04, 24.20±13.66 respectively) (p<0.001) (Table 3), which is less than an another study in Syria (21.7±1.6) in men and (21.2±2.5) in women31.
The waist perimeter showed an absence of cardiovascular risk in women (78.38±9.02) but there was a risk in men (89.63±15.115), there were no significance difference between MAI and PC. Meanwhile in other studies in Spain and international (27,33-38) showed an absence of cardiovascular risk, both in men and in women.
The energy consumed by the young Syrian sample was 2488.71±1115.53 kcal, which is in line with the recommended value39, in spite of the crisis in Syria, but
was unbalanced and did not comply with the nutritional goals. While providing the recommended energy, the diet was characterized by an excessive intake of proteins (17.82±24.5%) p<0.05, and fats (36.5±17.1%) in detriment of carbohydrates 48.27±23%. The consumption of cholesterol 330.91±260.89 mg was slightly high, the recommended value is less than (300 mg), being highly intake by the lowest adherence to Mediterranean diet (356.25±269.269 mg) p<0.001, Other parameter of the quality of the diet has been included and showed that is satisfactory. The lipid profile measured as cocient PUFAS + MUFA/SFA (3.71±0.26) was more than the recommended values in MD which is 2. Indicating high consumption of vegetable oil (10±0.7) and olive oil 15±0.7, and low consumption of fish, red meat (54.8±3.8) and moderate consumption of chicken 114.39±8.0, there is association between MAI and lipid profile at the level of 0.01.
The big standard deviation was resulted, due to the big variation in the intake of food in the sample and in the population in general, because of the big varieties in the types of dishes and combined food.
4. Discussion and Conclusions
In general, the majority of the Spanish University students were within the category of normal weight, being greater the prevalence of overweight and obesity, among the young, in men more than women, however the thinness was more frequent in females27,40,28. In our study, the
lowest adherence to MD had the highest BMI with no significance differences between MAI and BMI, similar to the results in a study of Valladolid in Spain32. In contrast
to a Project Study in Spain with significative difference p<0.00130. In Attica Study in Italy, there is an inverse
association between MAI and BMI (p = 0.04)29.
The men had highest adherence than female (6±2.2 and 4.6±1.9 respectively), this was different than the adherence to the Lebanese Mediterranean Diet (LMD) as well as the Italian MD and those reported by Patino-Alonzo et al24. In
Spain, reporting women as being more health-conscious and followers of dietary recommendations than men25,26.
Another study of Spanish student in Valladolid applying another method (Mediterranean Diet Score: MDS) showed an intermediate adherence to the Mediterranean diet slightly higher in males than in female; the same as our study. Similar results were found in the Balearic Islands28 and in Castilla La Mancha27,28 in Spain. In the
present study, there is no significance difference between age and AMI.
The MAI of the cyclists study in Spain, Spanish youth of “enkid study”, and Italian rural populations of the “seven countries longitudinal study” are shown in Table 4.
The table shows that the value of MAI in Syrian youth was relatively small in comparison with the traditional diet in Italy during the past 10 years. 20% of the Spanish young cyclist had the value of MAI = 0.8 (48), while the young males in the study of “enKID” had even Less. Therefore, there was a great concern about the quality of the diet in Spain, as well as the sedentary lifestyle which would lead to the increase of obesity among the youth as the enKID study16.
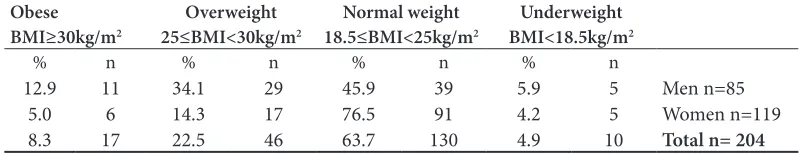
Table 3. Classification of subjects according to BMI (n,%) Obese
BMI≥30kg/m2 25≤BMI<30kg/mOverweight 2 18.5≤BMI<25kg/mNormal weight 2 BMI<18.5kg/mUnderweight 2
% n % n % n % n
12.9 11 34.1 29 45.9 39 5.9 5 Men n=85
5.0 6 14.3 17 76.5 91 4.2 5 Women n=119
In the review undertaken by Bach et al42, it was observed
that in Spain the adherence to the Mediterranean diet was lower in young people and women. Also, the survey data of the study SUN43, developed by the University
of Navarra, showed a medium-low adherence, which suggests a progressive move away of the Mediterranean dietary pattern among the young university students. Applied the KIDMED index to assess the adherence to the Mediterranean dietary pattern in students in various universities in Spain, they obtained an intermediate adherence and found no significant differences on the basis of gender or type of university studies32, which
was different to our study. Also the MAI in our sample was lower than the median in Pollica, considered in 1960 as a reference for its Mediterranean characteristics, Montegeorgio, Crevalcore, and Pollica in 1991, In Italy as shown in Table 4.
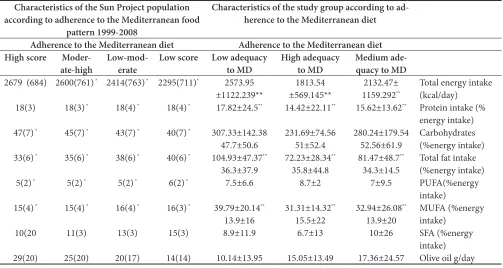
The lowest consumption of carbohydrates (47.7±50.6%) was reported by the lowest adherence to MD, meanwhile they consume the highest quantity of energy, protein (17.82±24.5%) p<0.05, and lipids (36.5±37.9) p<0.05, due to the high consumption of pulses (beans), which is popular, especially in the low income population, and the consumption of chicken in fast foods especially in university students. The highest adherence had the highest consumption of monounsaturated fatty acids (15.5±22%) p<0.05, because of the high consumption of olive oil. And who reported a medium adherence had the highest consumption of saturated fatty acids (10.5±26%) p<0.01 (Table 5). We had the same results as reported by the Sun Project study in Spain, when the lowest adherence consume the highest percentage of fat 40% and carbohydrates 40±7% p<0.001, but in contrast to our study in the consumption of monounsaturated fatty acids (MUFA) (16±3) p<0.001 and Saturated fatty acids (SFA) (15±3) (p<0.001) and energy (2265±711kcal) p<0.001. The same result obtained on Spanish students of the university of Valladolid (32), there are significant differences between levels of MAI and Energy (P<0.05), being those who had high adhesion consume less energy.
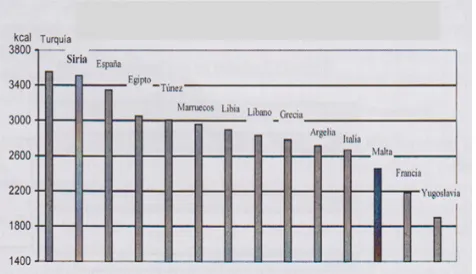
The intake of energy in Syria has increased during the years 1983, 1993, 1998, 2001 (3731 kcal/day), which was over the recommendation (Figure 1.), due to the high intake of grains which was the main source of energy31. When comparing with other countries in the
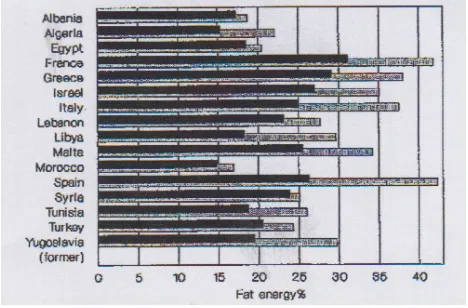
Mediterranean area, it was noted that the average energy consumption of Syria was the highest after Turkey; countries that have a lower energy intake were Yugoslavia and France (Figure 2.) (FAO, 1998)and was higher than the intake of Mediterranean area (1961-2000) (Table 6). Compared to our study, a great reduction in the energy consumption from 2001-2015 (20%) due to the crisis in the country.
Figure 1. Development of energy intake in Syria.
Figure 2. Energy intake in some Mediterranean countries.
The distribution of the energy provided by Table 4. Comparison of MAI in our study, Spanish studies and Italian studies
Montegeor-gio Italy in 1991 (n=82) (young)n=23
Crevalcore Italy in 1991(n=171) (young)†n=18
Pollica Italy in 1999 (n = x)
men
Nicotera Italyin 1960 (n = 144 men under 60 y)
Enkid study Spain in (n = 436 young
men)
Cyclists
(n = 45) Young Syrian (n=204) Diet adequacy parameter
2.6-4.8 (young) 1.9-2.9
1.7-3 (young)†
1.9-2.7
2.4 to 4.5 7.2 1.51 ± 0.5* 2.31 ± 0.7* 1.17 ± 0.08 MAI (aver-age±sd) Or
macronutrients since 1983 till 2001 in Syria (FAO, Figure 3), was very satisfactory and adapting to what is recommended: Protein 10-15%, carbohydrates >50% and lipids <30 -35%. On the contrary, in some Mediterranean countries such as France, Italy and Spain, the caloric profile can be considered similar to that of other western societies, away from the recommended43,44.
But nowadays and in our study, a change has occurred in the caloric profile to be similar to the Mediterranean countries, our profile is the same that has been observed in the whole Spanish population32. However, in the
work done in University of Madrid35 showed lower
protein intakes (14-15%) appropriate to the nutritional goals. Oliveras and cols stressed that, in Spain, the macronutrients that more were diverted from the nutritional goals were proteins, which can be explained by the high consumption of food of animal origin40. On
the other hand, the excess lipids in the diet was associated
also with the consumption of these foods, along with the culinary preparations rich in fats (fried), prepared dishes and industrial pastries. The same conclusion made of this study, especially in the students, as they live far from their families.
Figure 3. Development of caloric profile in Syria (%) (FAO).
Table 5. Comparison of the intake between our study and sun project study in Spain Characteristics of the Sun Project population
according to adherence to the Mediterranean food pattern 1999-2008
Characteristics of the study group according to ad-herence to the Mediterranean diet
Adherence to the Mediterranean diet Adherence to the Mediterranean diet High score
Moder-ate-high Low-mod-erate Low score Low adequacy to MD High adequacy to MD Medium ade-quacy to MD
2679 (684) 2600(761) * 2414(763) * 2295(711)* 2573.95
±1122.239** ±569.145**1813.54 1159.2922132.47± **
Total energy intake (kcal/day)
18(3) 18(3) * 18(4) * 18(4) * 17.82±24.5** 14.42±22.11** 15.62±13.62** Protein intake (%
energy intake)
47(7) * 45(7) * 43(7) * 40(7) * 307.33±142.38
47.7±50.6 231.69±74.56 51±52.4 280.24±179.54 52.56±61.9 Carbohydrates (%energy intake)
33(6) * 35(6) * 38(6) * 40(6) * 104.93±47.37**
36.3±37.9 72.23±28.34
**
35.8±44.8 81.47±48.7
**
34.3±14.5 Total fat intake (%energy intake)
5(2) * 5(2) * 5(2) * 6(2) * 7.5±6.6 8.7±2 7±9.5 PUFA(%energy
intake)
15(4) * 15(4) * 16(4) * 16(3) * 39.79±20.14**
13.9±16 31.31±14.32
**
15.5±22 32.94±26.08
**
13.9±20 MUFA (%energy intake)
10(20 11(3) 13(3) 15(3) 8.9±11.9 6.7±13 10±26 SFA (%energy
intake)
29(20) 25(20) 20(17) 14(14) 10.14±13.95 15.05±13.49 17.36±24.57 Olive oil g/day
*p<0.001, **p<0.05, ***p<0.01
Table 6. Comparison between energy and macronutrients in young Syrian, Syrian sample in 2001 and Mediterranean
Young Syrian Syrian sample Mediterranean 2015 2001 1961–1963 1998–2000
Total energy (kcal) Total fats (%) Carbohydrates (%) Protein (%)
2488±1115.53 36.49±17.14 48.27±23
17.5±10
3731 22 69 9.7
2952±250 26.4 ± 3.1 54.5 ± 5.3 11.9±0.7
For the nation as a whole, the average intake of carbohydrates was 677 g in a study in Syria in 200131, an
amount that represented a 69% of the total caloric intake. In the last decades, this macronutrient has remained large proportion in the diet due to the traditional food habits that have not changed. With regard to other Mediterranean countries, Syria had a high intake of carbohydrates such as Turkey and the countries of the Southern Mediterranean45.
Our study represent a drastically decrease in the intake of carbohydrates, in comparison to the intakes in previous years, and similar to other studies in Spain and Italy46.
The percentage of energy from protein was higher than the Mediterranean countries, and almost double than another study in Syria in 2001 (90.7g)31, which assume the
tendency to higher intake of protein from legumes and chicken. The consumption also has increased from 1983 to1993 but has subsequently declined slightly (Figure 3.)31.
Figure 4. The percent of total daily energy supplied by fat: 3-y averages for 1961-1963 and 1988-1990 for Mediterranean countries. Adapted from reference 12.
During the last 40 years, energy from fat has considerably increased in the Mediterranean area (48%), the same results are shown in food balance data suggest that the percentage of total energy supplied by fat has uniformly increased in the Mediterranean area during the past generation, from 15-30 % in the early 1960s to 15-40 % in the late 1980s12. In some countries such as Greece,
Syria, and Malta, this increase is mainly explained by increase in the supply of animal fats. In other countries such as Algeria, Libya, Turkey, Tunisia, and the former Yugoslavia, the increase is mainly explained by greater availability of vegetable oils (Figure 4.)47.
In Syria, in a study in 2001, the average consumption
of fat was moderate 92 g/day. If we express the fat consumption as a percentage of caloric contribution to the total energy intake, we get an average figure of 20% lower than our study (36.4±17.1 %). The average consumption of Saturated Fatty Acids (SFA), Monounsaturated Fatty Acids (MUFA) and Polyunsaturated Fatty Acids (PUFA) were: 25 (5.8%), 39 (8.5%), and 18 (4.2%) respectively31,
which was different to our study: 24.88 (8.6%), 38.68 (13.7%), 20.95(7.5%) respectively. The Table 7 shows an increase in the intake of fat, SFA due to the intake of fast food (sandwiches ..) and an increase in the intake of MUFA and PUFA, it means the intake of olive and vegetable oils, which is positive for health.
The main characteristics of the lipid intake in Syria and its development in the last decades, are shown in Table 7.
Table 7(31). Development of lipid intake in the years:
1983, 1993, 1998, 2001 and 2015
1983 1993 1998 2001 2015
Lipids 78.1 91.7 70.4 92 100.89
SFA (G) 21.4 27.3 14.8 25 24.88
PUFA (G) 19.7 18.3 22.3 39 38.66
Cholesterol (mg) 212.6 249.6 217.2 330.91
Caloric intake from (%):
Lipids 22 22 19 22 36.49
SFA 5.6 5.8 4.0 5.8 8.6
MUFA 7.6 8.5 7.3 8.5 13.7
PUFA 5.1 4.2 5.9 4.2 7.5
(PUFA+MUFA)SFA 2.3 2.1 3.3 2.1 3.7
The cocient of PUFA+MUFA/SFA was 1.6 and 1.71 in young males in the enKID study and young cyclist study in Spain respectively, which demonstrated the lipid profile was commonly poor in the youth diets in Spain. But in a better situation in Syria young people.
association between low MAI and lipid profile at the level of 0.05, the same results has obtained in Spanish cyclist48.
The lipid profile of the students in the university of Valladolid (Spain) did not comply with the recommendations, as was consumed an excess of saturated fatty acids and cholesterol. This same happens in the University of Castilla La Mancha (Spain)27 in which
the intake of SFA almost doubles the recommendations. However in students in Madrid35, the lipid profile was
adapted to the nutritional goals, although other work undertaken in Madrid36, observed an excess of cholesterol
among men, the same result was found in the study developed by the FUNIBER38.
In the last decades the amount of dietary cholesterol in Syria was around 212-250 mg, a better situation than our study, which indicates the tendency of high intake of animal food at the expense of food from plant origin.
As a result of the study and in previous studies, the appropriate consumption of protein, energy and fat are always accompanied with healthier lifestyle49.
Unfortunately the countries of the eastern basin of the Mediterranean, such as Syria and Lebanon and another countries are exposed to waves of change of food pattern and food balance such as the traditional food as well as the lifestyle toward an energy dense dietary pattern50 which
leads to an increase in chronic diseases, obesity, mortality (50) and other nutrition-related diseases of the region51.
Syria as in Lebanon the obesity was increased from 17% in 1997 to 28,2% in 200941,52 which exceeds the rate
of various advanced countries during the past 10 years, including the United States of America53. Moreover the
incidence of cardiovascular diseases and diabetes type2 are the highest in the world50. Therefore, this situation
if not improved, in the long term, this will increase the risk of hypertension, arteriosclerosis, dyslipidemia and cardiovascular disease.
5. References
1. Saarni SE, Rissanen A, Sarna S, Koskenvuo M, Kaprio J. Weight cycling of athletes and subsequent weight gain in middle age. International Journal of Obesity (Lond). 2006 Mar 28; 30(11):1639–44.
2. Naja F, Nasreddine L, Itani L, Chamieh MC, Adra N, Sibai AM, Hwalla. Dietary patterns and their association with obesity and socio-demographic factors in a national sample of Lebanese adults. Public Health Nutr. 2011; 14:1570–8. 3. Naja F, Hwalla N, Itani L, Salem M, Azar S, Zeidan MN,
Nasreddine L. Dietary patterns and odds of type 2 diabe-tes in Lebanon: A case–control study. Nutr Metab. 2012; 27(9):111.
4. Samman S, Sivarajah G, Man JC, Ahmad ZI, Petocz P, Ca-terson ID. A mixed fruit and vegetable concentrate increas-es plasma antioxidant vitamins and folate and lowers plas-ma homocysteine in men. J Nutr. 2003; 133(7):2188–93. 5. Kiefer I, Prock P, Lawrence C, Wise J, Bieger W, Bayer P,
Rathmanner T, Kunze M, Rieder A. Supplementation with mixed fruit and vegetable juice concentrates increased se-rum antioxidants and folate in healthy adults. J Am Coll Nutr. 2004; 23(3):205–11.
6. Keys A, Keys M. How to eat well and stay well the Mediter-ranean way. New York: Doubleday; 1975.
7. Willet W, Sacks F, Trichopoulou A, et al. Mediterranean pyramid: A cultural model for healthy eating. Am J Clin Nutr. 1995; 61:1402S–6S.
8. Keys A, Aravanis C, Blackburn H, Buzina R, et al. Seven countries: A multivariate analysis of death and coronary heart disease. Cambridge: Harvard University Press; 1980. 9. Sofi F. The Mediterranean diet revisited: Evidence of its ef-fectiveness grows. Curr Opin Cardiol. 2009; 24(5):442–6. 10. Sofi F, Abbate R, Gensini GF, Casini A. Accruing evidence
on benefits of adherence to the Mediterranean diet on health: An updated systematic review and meta-analysis. Am J Clin Nutr. 2010; 92(5):1189–96.
11. Vincent-Baudry S, Defoort C, Gerber M, et al. The Me-di-RIVAGE study: Reduction of cardiovascular disease risk factors after a 3-mo intervention with a Mediterranean-type diet or a low-fat diet. Am J Clin Nutr. 2005; 82(5):964–71. 12. Babio N, Bull' M, Salas-Salvad' J. Mediterranean diet and
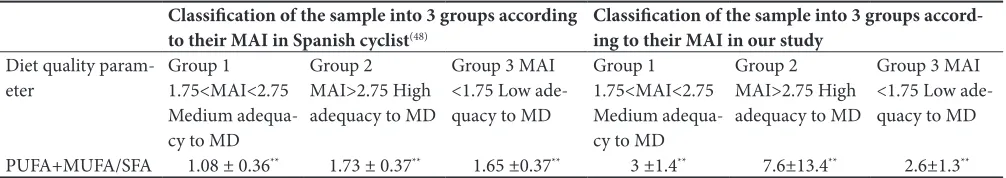
Table 8. Comparison of lipid profile according to MAI in our study and Spanish cyclist study
Classification of the sample into 3 groups according to their MAI in Spanish cyclist(48)
Classification of the sample into 3 groups accord-ing to their MAI in our study
Diet quality
param-eter Group 1 1.75<MAI<2.75
Medium adequa-cy to MD
Group 2 MAI>2.75 High adequacy to MD
Group 3 MAI <1.75 Low ade-quacy to MD
Group 1 1.75<MAI<2.75 Medium adequa-cy to MD
Group 2 MAI>2.75 High adequacy to MD
Group 3 MAI <1.75 Low ade-quacy to MD
PUFA+MUFA/SFA 1.08 ± 0.36** 1.73 ± 0.37** 1.65 ±0.37** 3 ±1.4** 7.6±13.4** 2.6±1.3**
** no statistical difference among groups
metabolic syndrome: The evidence. Public Health Nutr. 2009; 12(9A):1607–17.
13. Psaltopoulou T, Sergentanis TN, Panagiotakos DB, et al. Mediterranean diet, stroke, cognitive impairment, and de-pression: A meta-analysis. Ann Neurol. 2013; 74(4):580–91. 14. Ajala O, English P, Pinkney J. Systematic review and me-ta-analysis of different dietary approaches to the manage-ment of type 2 diabetes. Am J Clin Nutr. 2013; 97(3):505– 16.
15. Noah A, Truswell AS. There are many Mediterranean diets. Asia Pac J Clin Nutr. 2001; 10(1):2–9.
16. Serra-Majen L, Garcia-Closas R, Ribas L, Perez-Rodrigo C, Aranceta J. Food patterns of Spanish schoolchildren and adolescents: The enKid Study. Public Health Nutr. 2001; 4(6A):1433–8.
17. Bastard JP, Maachi M, Lagathu C, Kim MJ, Caron M, Vidal H, Capeau J Feve B. Recent advances in the relationship between obesity, inflammation, and insulin resistance. Eur Cytokine Netw. 2006; 17(1):4–12.
18. Marcos A, Nova E, Montero A. Changes in the immune system are conditioned by nutrition. Eur J Clin Nutr. 2003; 57(1):S66–9.
19. Brunngard H. Physical activity and modulation of systemic low-level inflammation. J Leukoc Biol. 2005; 78(4):819–35. Epub. 2005 Jul 20.
20. Dapcich V, Castell GS, Barba LR, Rodrigo CP, Bartrina JA, Majem LS. Guía de la alimentación saludable. Editado por la Sociedad Española de Nutrición Comunitaria (SENC). Madrid; 2004.
21. Farran A, Zamora R, Cervera P. Tablas de composición de alimentos del CESNID, 2ª edición. Barcelona: Edicions Universitat de Barcelona; Madrid: McGraw-Hill Inter-tamericana de España; 2004.
22. Alberti KGMM, Zimmet P, and Shaw J. IDF epidemiolo-gy task force consensus group: The metabolic syndrome- a new worldwide definition. Lancet. 2005; 366:1059–62. 23. Martin-Moreno JM, Boyle P, Gorgojo L, Maisonneuve P,
Fernandez-Rodriguez JC, Salvini S, et al. Development and validation of a food frequency questionnaire in Spain. Int J Epidemiol. 1993; 22(3):512–9.
24. Patino-Alonso MC, Recio-Rodroguez JI, Magdalena Belio JF, Colominas-Garrido R, Lema-Bartolome J, Gmez Arranz A, Agudo- Conde C, Gomez-Marcos MA, Garcia-Ortiz L. EVIDENT Group. Factors associated with adherence to the Mediterranean diet in the adult population. J Acad Nutr Diet. 2013; 13: S2212–672.01252-5.
25. Nasreddine L, Hwalla N, Sibai A, Hamze M, Parent-Massin D. Food consumption patterns in an adult urban population in Beirut, Lebanon. Public Health Nutr. 2006; 9:194–203. 26. Fagerli RA, Wandel M. Gender differences in opinions and
practices with regard to a ‘healthy diet’. Appetite. 1999; 32:171–90.
27. Burriel FC, Urrea RS, Garcia CV, Tobarra MM, Meseguer MJG. Adherencia a la dieta mediterranea en estudiantes es-panoles. Food habits and nutritional assessment in a univer-sity population. Nutr Hosp. 2013 Mar-Apr; 28(2):438–46.
28. Ortiz-Moncada R, Navarro AIN, Marti AZ, Saez JF, Blanes MCD. Do the Spanish university students follow Medi-terranean dietary patterns? Nutr Hosp. 2012 Nov-Dec; 27(6):1952–9.
29. Pitsavos Chr, Panagiotakos D, Tzima N, Chrysohoou Ch, Economou M, Zampelas A, Stefanadis Ch. Adherence to the Mediterranean diet is associated with total antioxidant capacity in healthy adults: The ATTICA study. Am J Clin Nutr. 2005; 82:694–9.
30. Martınez-Gonzalez MA, Garcia-Lopez M, Bes-Rastrollo M, Toledo E, Martinez-Lapiscina E, Delgado-Rodriguez M, Vazquez Z, Benito S, Beunza JB. Mediterranean diet and the incidence of cardiovascular disease: A Spanish cohort. Nutrition, Metabolism and Cardiovascular Diseases. 2009; 20:1–8.
31. Homsi AK. La dieta Mediterranea en Siria (Oeste de Asia) [Tesis Doctoral]. Madrid; 2001.
32. Marti CD. Adherencia a la Dieta Mediterranea en estudi-antes universitarios. Trabajo fin de grado. Valladolid; 2014 33. Durá Travé T: Nutritional analysis of breakfast on rising
and mid-morning snack in a college population. Nutr Hosp. 2013 Jul-Aug; 28(4):1291–9.
34. Izaga MA, Pablo AMR, Alday LA, Apalauza EP, Beti IS, Ochoa ER. Adherencia a la dieta mediterranea en estudi-antes espanoles. Diet quality, overweight and obesity in uni-versity students. Nutr Hosp. 2006 Nov-Dec; 21(6):673–9. 35. Roldan CM, Herreros PV, de Andres AL, Sanz JMC,
Azco-na AC. Adherencia a la dieta mediterranea en estudiantes espanoles. Nutritional status assessment in a group of uni-versity students by means of dietary parameters and body composition. Nutr Hosp. 2005 May-Jun; 20(3):197–203. 36. Cutillas AB, Herrero E, de San Eustaquio A, Zamora S,
Pe-rez-Llamas F. Adherencia a la dieta mediterranea en estudi-antes espanoles. Prevalence of underweight, overweight and obesity, energy intake and dietary caloric profile inuni-versity students from the region of Murcia (Spain). Nutr Hosp. 2013 May-Jun; 28(3):683–9.
37. Zazpe I, Marques M, Sanchez-Tainta A, Rodriguez-Mou-rille A, Beunza JJ, Santiago S, Fernandez-Montero A. Ad-herencia a la dieta mediterranea en estudiantes espanoles. Eating habits and attitudes towards change in Spanish uni-versity students and workers. Nutr Hosp. 2013 Sep-Oct; 28(5):1673–80.
38. Cano S, Elio I, Dominguez I, Calderon R, Garcia A, Fer-nandez F, Gracia S, Dzul L, Battino M, Solano HA. Ad-herencia a la dieta mediterranea en estudiantes espanoles Sumalla. Assessing the profile and nutritional intake of an Ibero-American group of nutrition postgraduate students. Nutr Hosp. 2013 Mar-Apr; 28(2):532–40.
39. Consenso de la Sociedad Española de Nutrición Comuni-taria 2011. Objetivos nutricionales para la población es-pañola. Rev Esp Nutr Comunitaria. 2011; 17(4):178–99. 40. Oliveras MJ, Nieto P, Agudo E, Martinez F, Lopez H, Lopez
MC. Evaluación nutricional de una población universitaria. Nutr Hosp. 2006; 21(2):179–83.
alimentos, energia y macronutrients en un grupo de obesos sirios. Relacion con algunos variables sociodemografcos [Teis Doctoral]. Madrid; 2004.
42. Bach A, Serra-Majem L, Carrasco JL, Roman B, Ngo J, Ber-tomeu I, et al. The use of index evaluating the adherence to the mediterranean diet in epidemiological studies: A re-view. Public Health nutrition. 2006; 9(1a):132–46.
43. Cialfa E. Food consumption in Italy: Present situation and trends. En: Food and Nutrition Policy in Mediterranean Europe. Ferro-Luzzi A, Cialfa E, Leclercq C, editors. WHO European Collaborating Centres in Nutrition Roma; 1990. 44. Fielding RA. Effects of exercise training in the elderly:
Im-pact of progressive-resistance training on skeletal muscle and whole body protein metabolism. Proc Nutr Soc. 1996; 54(3):665–75.
45. Baysal A. Food and nutntion policies in turkey en food and nutntion policy in Mediterranean Europe. Ferro-Luzzi A, Cialfa E, Leclercq C, editors. WHO European Collaborat-ing Centres in Nutntion Roma; 1990.
46. Balanza R, Garcia-Lorda P, Perez-Rodrigo C, Aranceta J, Bullo Bonet M, Salas-Salvado J. Trends in food availability determined by the food and agriculture organization’s food balance sheets in Mediterranean Europe in comparison with other European areas. Public Health Nutrition. 2006; 10(2):168–76.
47. Gudmunds K, Webb A. Time series for SOFA.93: Country time Stories (TS-View Software). Rome: FAO; 1993. 48. Sanchez-Benito JL, Sanchez-Soriano E, Ginart Suarez J.
Assessment of the Mediterranean diet adequacy index of a collective of young cyclists. Nutr Hosp. 2009; 24(1):77–86. 49. Schroder H, Marrugat J, Vila J, Covas MI, Elosua R. Ad-herence to the traditional Mediterranean diet is inversely associated with body mass index and obesity in a Spanish population. J Nutr. 2004; 134:3355–61.
50. Sibai AM, Nasreddine L, Mokdad AH, et al. Nutrition tran-sition and cardiovascular disease risk factors in Middle East and North Africa countries: Reviewing the evidence. Ann Nutr Metab. 2010; 57:193–203.
51. Zazpe I, Sanchez-Tainta A, Toledo E, et al. Dietary patterns and total mortality in a Mediterranean cohort: The SUN project. J Acad Nutr Diet. 2014; 114(1):37–47.
52. Nasreddine L, Naja F, Sibai AM, et al. Trends in nutrition-al intakes and nutrition-related cardiovascular disease risk factors in Lebanon: The need for immediate action. Leb Med J. 2012.
53. Finucane MM, Stevens GA, Cowan MJ, et al. National, re-gional, and global trends in body-mass index since 1980: Systematic analysis of health examination surveys and ep-idemiological studies with 960 country-years and 9.1 mil-lion participants. Lancet. 2011; 377(9765):557–67.