International Journal Advances in Social Science and Humanities
Available online at: www.ijassh.com
RESEARCH ARTICLE
Conventional to Modern Libraries: Changing Practices and Changing
Roles of
Information Professionals in the PG Colleges of University of
Kerala, India
Kailash Chandra Das
1*and Nidhi Alex M Ninan
21PG Dept. of Library & Information science, Utkal University, Vani Vihar, Bhubaneswar, Odisha, India.
2 Christian College, Chengannur, Kerala, India.
*Corresponding Author: E-mail: [email protected]
Abstract
Librarians diffusely feel their role absolutely altered by the advent of the Internet and electronic resources posing tremendous challenges to libraries and their professionals. The key purpose of this research study is to find out the role of information professionals in managing modernized libraries in the PG colleges under University of Kerala, India. The data was collected through structured questionnaire as well as observation and personal interviews. More particularly, questionnaires were distributed among 118 librarians of post graduate colleges under University of Kerala. But only 103 (87.28%) of them responded.
Keywords: User Study, College Libraries, ICT, Information Sources & Services, Information professional.
Introduction
The swift advancement of technological development congruent with modern information communication Technologies (ICT) in information society have rightly ushered the academic organizations, the capacity to manage both conventional and electronic resources effectively keeping pace with the changing information infrastructure and the changing needs of users’ community. The emerging “information society” and the changing role of information professionals is a matter of great concern throughout the world. Librarians and library technicians are at the heart of many exciting developments in information service in the twenty first century. Our new online services, in particular, enable libraries to deliver relevant and vibrant services to existing and new audiences. Library professionals diffusely feel their role absolutely altered by the advent of the Internet and electronic resources posing tremendous challenges to libraries and their professionals. Their role has developed to that of educator, facilitator and collaborator, with a very strong customer oriented focus. The networked environment has strongly invested librarians, putting them on a “client-centered function as facilitators and intermediaries” [1]. Moreover in Chase’s [2]
opinion, as we have entered the knowledge era and libraries and information centers are at the forefront of the digital revolution, the challenge for the profession for librarians is to transform themselves into value-adding knowledge professionals.
Role of Librarians in the Age of the Internet
the benefits that applications of modern technologies are meant to achieve. Therefore, a drastic need for changing practices and changing roles of the information managers has become inevitable.
Library users’ culture is changing as new powerful tools to easily access and create information are imposed. At the same time, the job of professionals in libraries has to adapt and integrate “virtual” services with traditional services. The spreading of the WWW has enabled, for example, reference librarians to be creative and dynamic in answering more questions than their traditional collections had previously allowed. However, there are also many challenges for internet reference – licensing for remote access, copyright, making consortial agreements for better subscription prices, keeping paces with emerging technologies, and examining the costs involved [3].
Croud et al. [4] analyse the role of librarians, stressing four major points of evolution with a strong focus on customer services. According to them, user-centered services development allows (and requires) librarians to accentuate their role in the following actions:
Mediation and assistance (selection, resources evaluation, virtual reference services, etc.); Teaching and training (general and on-demand,
tailored on new information resources, etc.); Partnership (within and outside the institution);
and
Design and production (of web pages and digital libraries).
Objectives
One of the objectives of this paper is to point out the changing practices and changing roles of information professionals in the PG colleges of university of Kerala, India. Besides, another objective is to find out what are the changes occurred when the conventional libraries were changed to modern.
Methodology
The investigators have collected data from 103 librarians of post graduate college libraries under University of Kerala which are analysed to find out their role in running a modern Post Graduate College library. The data was collected through a structured questionnaire as well as observation and personal interviews. A questionnaire was designed keeping the objective of the study in mind. More particularly, questionnaires were
distributed among 118 librarians of post graduate colleges under University of Kerala. But only 103 (87.28%) of them responded. The analytical study of the data collected has revealed a number of useful findings and are summed up here.
Data Analysis
Once the data were collected, necessary techniques were used for classification of data under individual facets. The data were tabulated and entered into the MS Excel spread sheets for subsequent analysis and interpretation.
Table 1: Sex wise distribution of samples
Sex N=103 Percentage
Male 58 56.31
Female 45 43.69
Table 1 shows that when we have categorized sex wise distribution of samples, out of 103 librarians, 58 (56.31%) are male and 45(43.69%) are females. This shows that males are dominated in the population of college librarians in Post Graduate Colleges.
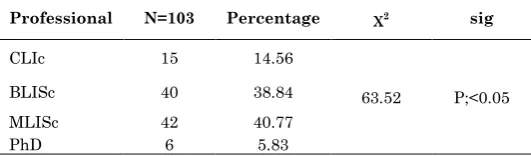
Table 2: Professional qualification wise samples (Library& Information Science)
Professional N=103 Percentage χ2 sig
CLIc 15 14.56
63.52 P;<0.05
BLISc 40 38.84
MLISc 42 40.77
PhD 6 5.83
Professional qualifications of the librarians are found (Table 2) as in Certificate in library and information science, there are 15 (14.56%) BLISc 40(38.84%) MLISc 42 (40.77%) and PhD 6 (5.83%). This shows that Master degree holders in Library and information science constitute a major part of college librarians. The obtained X2 63.52 is greater than the table value 7.81 at 0.05 level of significance. That means there exists a significant association among Professional degrees of Librarians.
Table 3: Showing computer literacy
Computer literacy N=103 Percentage
Computer Literate 95 92.23
Computer
non-literate 08 7.77
Table 3 shows that 95 (92.23 %) librarians has computer literate and 8 (7.77%) has non-literate in computer. From this we can see that most of the college librarians are computer literate.
(13.59%), Management colleges 8(7.76%), Medical Colleges are 5 (4.85%) and others 10(9.70%).
Table 4: Types of the colleges
Type of the college N=103 Percentage χ2
Arts & science 54 53.42
99.52
Training 12 11.65
Engineering 14 13.59
Medical 5 4.85
Management 8 7.76
Others 10 9.70
The general information regarding the college libraries reveals that Arts and Science college libraries constitute the major section of libraries than professional colleges.
The obtained χ2 value is 99.52 which are greater than the table value 11.07 at 0.05 level of significance. That mean there exists a significant difference in the types of college.
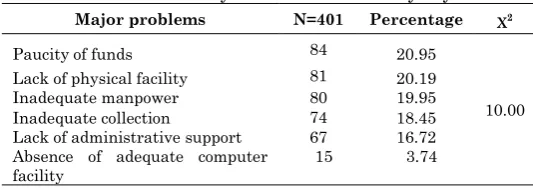
Table 5 Problems faced by the librarians in early days Major problems N=401 Percentage χ2
Paucity of funds 84 20.95
10.00
Lack of physical facility 81 20.19
Inadequate manpower 80 19.95
Inadequate collection 74 18.45
Lack of administrative support 67 16.72
Absence of adequate computer
facility 15 3.74
Table 5 shows that P.G college librarians faced a number of problems during their routine works. The samples tells us the professional difficulties facing by them like paucity of funds 84 (20.95% ), lack of physical facility 81 ( 20.19% ), Inadequate manpower 80 (19.95% ), Inadequate collection 74 ( 18.45% ), lack of administrative support 67 ( 16.72% ), and absence of adequate computer facility 15 (3.74% ). From this it is understood that lack of funds, physical facility and manpower was the major problems of the college libraries in Kerala during the past.
The obtained χ2 value is 10.00 which is less than the table value 12.59 at 0.05 level of significance. That mean there exists no significant difference in the problems faced by the librarians.
When the question was put to the samples that how many number of users visit the library per day before library modernisation. The reply to this question , majority 61 (61.10% ) have answered less than 50 per day. However, 39(37.86%) librarians have stated that between 51- 100 visitors . Only 3(2.91%) samples expressed that they have more than 100 visitors/day. From this we can understand that in most of the libraries, the number of users visited per day is
below 50. The data is collected by verifying the old issue/gate registers and consulted with the librarians.The obtained X2 value is 49.94 ,which is greater than the 5.99 at 0.05 level of significance, that means there exists significant difference in the association of Number of visitors. Table-6 shows number of users visiting libraries after modernization.
Table 6: Number of users visiting the library/day
Visitors N=103 Percentage
1-50 13 12.62
51-100 57 55.35
101- and above 33 32.03
The study reveals that the number of visitors/day is below 50 in only 13 ( 12.62% ) colleges, between 51 and 100 visitors is 57 (55.35% ), and above 101 visitors/day is in 33 (32.03%) P.G college libraries. This shows after modernisation of the library the number of visitors have been increased.
Table 7: Libraries average transaction
Transaction/day N=103 Percentage
1-50 24 23.31
51-100 39 37.86
101-150 20 19.41
151-200 14 13.59
Above 201 6 5.83
Then the researchers asked questions related to the average transaction/day, the librarians stated that the 1-50 transactions are take place in 24 ( 23.31% ) libraries, 51-100 transactions take place in 39( 37.86% ) libraries, 101-150 transactions in 20( 19.41% ) libraries, 151-200 in 14( 13.59% ) P.G libraries and above 201 in 6 (5.83% ) libraries. This table (Table-7) is a parameter about the increase in transaction of books in the library after modernization.
Table 8: Automation of the library Details about
automation N=103 Percentage χ2 sig
Fully 57 55.33
107.63 P:<0.05
Partially 44 42.72
nil 2 1.95
than the 3.84 at 0.05 level of significance,rthat means there exists significant difference in the association of Details about automation. The data can be seen from Table-8
Table 9: Period of Automation took place Year of Modernization of the
library N=103 Percentage
1990-1995 2 1.94
1996-2000 12 11.65
2001-2005 16 15.54
After 2006 71 68.93
Nil 2 1.94
When we asked questions about the year of introduction of automation in libraries the librarians stated that only 2 (1.94%) libraries were automated between 1990 and 1995. Between 1996 and 2000 the number of automated P.G libraries is 12(11.65%), between 2001 and 2005 is 16(15.54% ), and after 2006 the number is 71(68.93). 2(1.94%) did not automated yet. This shows that after 2006 a revolution of automation in libraries taken place in the PG colleges. This has been depicted in Table-9.
Table 10: Usage of barcode in library operations
Provision of Barcode facility N=103 Percentage
yes 58 56.31
No 45 43.69
Table 10 shows that 58 (56.31%) computerized libraries are using barcode facility for their circulation process. 45 (43.69%) among them do not use barcode facility. From this we get the idea that most of the libraries do not using barcode facility even though they have computerized.
Table 11: Usage of RFID in library operation Provision of RFID
facility N=103 Percentage
yes 2 1.94
No 101 98.06
Table 11 shows RFID is the latest device used in the security of library collections. But it is applied by only 2 (1.94%) libraries under university of Kerala. The remaining 101 (98.06%) do not have this facility. RFID is yet to be popularized in PG college libraries.
Table 12: Types of software using in libraries
Software used in the library N=103 Percentage
Nil 7 6.80
Libsoft 57 55.34
Soul 4 3.88
Granthana 7 6.79
Other software 28 27.19
From Table 12, it is found that a wide variety of software’s are used in college libraries. Libsoft is used by 57 (55.34%) colleges’ libraries. Soul is using in 4 ( 3.88% ) library, Grandha software is using in 7 ( 6.79% ) P.G libraries, local software are using in 11 ( 13.75% ) libraries and the rest 28 ( 27.19% ) do not have software. This reveals that Libsoft is popular in PG college libraries.
Table 13: Internet connectivity
Internet connectivity N=103 Percentage
yes 81 78.65
No 7 6.79
Planned in the near future 15 14.56
Table 13 shows that 81(78.65%) college libraries having internet facility. 7 (6.79%) of them have plan to introduce the facility in the near future. are planning to introduce internet facility in the near future. The rest 15 (14.56%) libraries have no plan to introduce it in their library. The table reveals that internet is popular in PG colleges.
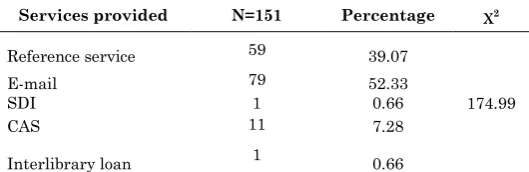
Table 14: Services provided through internet in the library Services provided N=151 Percentage χ2
Reference service 59 39.07
174.99
E-mail 79 52.33
SDI 1 0.66
CAS 11 7.28
Interlibrary loan 1 0.66
When the researchers asked questions on the use of internet in the library a number of samples had pointed out various library services that the library provides viz., reference service. 59( 39.07% ) , E –mail 79 ( 52.33% ), SDI 1 ( 0.66% ), CAS 11 ( 7.28% ), and interlibrary loan 1 (.66% ). This shows internet is widely used for various services in the college libraries (Table-14).
The obtained χ2 value is 174.99 which is less than the table value 9.48 at 0.05 level of significance. That mean there exists no significant difference in the. Services provided through internet in the library.
Table 15: E-journal subscription in libraries
Subscription of e-journals N=103 Percentage
yes 37 35.92
No 66 64.08
journals. 66 (64.08%) do not have e-journal subscription. Table 6.49 shows that many PG college libraries have subscription of e-journals (Table-15).
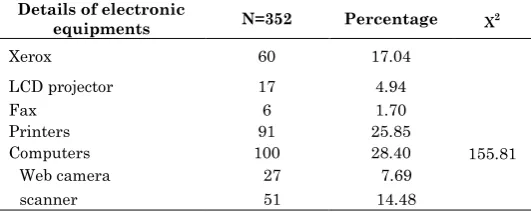
Table 16: Electronic equipments in the library Details of electronic
equipments N=352 Percentage χ2
Xerox 60 17.04
155.81
LCD projector 17 4.94
Fax 6 1.70
Printers 91 25.85
Computers 100 28.40
Web camera 27 7.69
scanner 51 14.48
When the researchers asked that whether the library possess electronic equipments,60 (17.04%) samples stated that they have Xerox facility in their library.17 (4.94%) libraries have LCD projector, 6 (1.70%) have fax facility, 91 (25.85%) have printers, 100 (28.40% ) have computers in their library, and 27 (7.69%) have web camera facility, 51 (14.48%) libraries have scanner. Table 16 shows that electronic equipments are widely used in PG College libraries under University of Kerala. The obtained χ2 value is 155.81 which is less than the table value 14.06 at 0.05 level of significance. That mean there exists no significant difference in the .electronic equipments in the library.
Table 17: Usage of retrieval of electronic information Electronic information
usage N=194 Percentage χ2
Preparing study materials 64 32.98
21.51
Doing project work 34 17.52
For updating knowledge 30 15.46
For preparing seminar papers 37 19.07
Reference service 29 14.97
When the researcher raised the question that why the users are retrieving information from electronic sources 64 (32.98%) samples stated that it is for preparing study materials, 34 (17.52%) samples stated that it is for doing project work. 30 (15.46%) of opinion is that it is for updating knowledge, 37 (19.07%) stated that they are retrieving electronic information for preparing seminar papers and 29 (14.97%) is using for reference purpose. Table 17 shows that most of the students are retrieving information from electronic resources for preparing study materials. The obtained χ2 value is 21.51 which is less than the table value 11.07 at 0.05 level of significance. That mean there exists no significant difference in the Usage of retrieval of electronic information.
Table 18: Showing the existence of Library website
Response N=103 Percentage
Yes 37 35.92
No 66 64.08
Table 18 shows that 37(35.92%) libraries have their own website and 66(64.08%) have no website.
Table 19: Showing the problems of librarians after automation
Nature of Problems N=189 Percentage χ2
Non Co-operation from higher
authorities 42 22.22
77.42 Non cooperation from the part of
the staff 24 12.68
Technical problems 81 42.88
Lack of computer awareness to
users 33 17.46
Lack of user freiendly and problem
free software 9 4.76
While using computers in the library routine work the librarians face many problems. 42 (22.22%) pointed out the non co-operation from the higher authorities.24 (12.68%) pointed out the non co-operation from the part of the staff. Lack of system speed and other technical problems are the problem to 81 (42.28%) librarians. Lack of computer awareness of users is also a problem to 33 (17.46%) librarians. Lack of the availability of cheap and user friendly and problem free software is the problem to 9 (4.76%) respondents. The table points out that there are obstacles in the way of working of automated libraries.The obtained χ2 value is 77.41 which is less than the table value 9.48 at 0.05 level of significance. That mean there exists no significant difference in the Problems of librarians after automation [5].
Conclusion
books, e-theses, e-dissertations in the PG College
libraries of Kerala, India especially, in the environment of change.
References
1. Rapple BA (1997) The electronic library, new roles
for librarians. Cause/Effect, 20(1):45-51.
2. Chase’s RL (1998) Knowledge navigators.
www.sla.org/pubs/serial /io/1998 /chase.html
3. Zumalt JR, Smith RA (2000) “Internet reference
services: general sources and trends”, Journal of Library Administration, 30(3/4):335-50.
4. Croud, J (2002) From lackey to leader: the evolution
of the librarian in the age of the internet. Retrieved from
www.library.uq.edu.au/papers/from_lackey_to_lead er.pdf.
5. Melchionda MG (2007) Librarians in the age of the