ELECTROCHEMICAL MEASUREMENT OF NITRIC OXIDE FROM BIOLOGICAL SYSTEMS
Rebecca Anne Hunter
A dissertation submitted to the faculty at the University of North Carolina at Chapel Hill in partial fulfillment of the requirements for the degree of Doctor of Philosophy in the
Department of Chemistry (Analytical Chemistry).
Chapel Hill 2014
Approved by:
Mark H. Schoenfisch Royce W. Murray James W. Jorgenson
© 2014
Rebecca Anne Hunter ALL RIGHTS RESERVED
ABSTRACT
REBECCA ANNE HUNTER: Electrochemical Detection of Nitric Oxide from Biological Systems
(Under the direction of Mark H. Schoenfisch)
Nitric oxide (NO) is known to be involved in a number of physiological processes,
including the immune response. As such, its role in severe infection and sepsis has been investigated, but previous measurement techniques have relied on complicated
instrumentation or the quantification of NO byproducts (e.g., nitrate and nitrite). Herein, the fabrication of a microfluidic amperometric sensor for the direct detection of NO in whole blood is described. These sensors were used to evaluate the potential of NO and nitrosothiols
(a stable transporter) as prognostic and/or diagnostic biomarkers for infection and sepsis. The microfluidic devices facilitated the selective electrochemical measurement of NO
in small volumes of blood at the point-of-care, with adequate sensitivity and limits of detection achieved in buffer, wound fluid, and whole blood. A green (530 nm) light-emitting diode was coupled to the device to enable photolysis of S-nitrosothiol species with subsequent NO detection. While inefficient photolysis prevented the measurement of nitrosothiols in whole blood, detection in serum was achieved.
accumulation of nitrosothiols was observed hours prior to the onset of other symptoms, despite a dramatic drop in the circulating white blood cells that produce NO.
A murine model of sepsis was utilized to understand the effects of bacterial virulence
and immune suppression on NO during an infection. A non-lethal pneumonia with Pseudomonas aeruginosa resulted in elevated NO levels at 72 h that returned to baseline concentrations after 1 wk. A more virulent bacterium, Klebsiella pneumoniae, resulted in much greater increases in NO, reflecting its pathogenicity. Conversely, in a murine model of post-burn immune suppression and infection, blood NO concentrations remained unchanged
relative to uninfected animals despite increased infection severity.
Nitric oxide-selective microelectrodes were also used to study NO release at the
single cell level, from both immune cells and neurons. Upregulation of carbon monoxide production by the macrophages was demonstrated to inhibit their ability to release NO following immune stimulation. Additionally, the concentration and kinetics of NO release
This work is dedicated to my parents,
ACKNOWLEDGEMENTS
The work presented within this dissertation would not have been possible without the assistance of numerous colleagues, collaborators, family members, and friends. My research advisor, Mark Schoenfisch, has been both a critic and a supporter throughout my graduate
school career. With his encouragement, I’ve not only made it though the long winding road of graduate school, but have also grown immensely as a scientist and been able to achieve
more than I ever imagined possible. Additionally, Professor Domenic Tiani has been an amazing mentor and allowed me to develop my teaching abilities to the greatest extent possible. His support allowed me to achieve my post-graduate school career goals. Finally,
my numerous mentors from Hood College have been with me in spirit since the beginning of my graduate school career, and have never hesitated to offer me advice or encouragement.
Current and former members of the Schoenfisch lab deserve special thanks, as they have not only been colleagues, but have also been some of the best of friends. In particular, Danielle Slomberg, Ahyeon Koh, Scott Nichols, and Roobert Soto helped make the
“fun-geon” as thrilling as it could possibly be, especially on Friday afternoons. Those who have helped with overnight pig studies over the years (Benjamin Privett, Scott Nichols, and Micah
work with two talented undergraduate students, Simon Menaker and Karli Gast, who have continuously inspired me to be come a better teacher and mentor.
Due in part to the interdisciplinary nature of my research, I’ve worked with numerous
collaborators during my graduate school career. The study of nitric oxide release from snail neurons would not have been possible without our collaborators from the lab of Professor
Vincent Rehder at Georgia State University, especially Liana Artinian who always provided us with a place to stay during our visits and even drove a tank full of snails up to our lab for further experiments. The microfluidic devices used to measure nitric oxide in blood were
designed with the help of W. Hampton Henley in the lab of Professor J. Michael Ramsey at UNC. All of the porcine sepsis studies in swine were made possible by the lab of Dr. James
Manning in the Department of Emergency Medicine at UNC, especially Shane McCurdy and Ben Ellington who endured the long and sometimes frustrating days and nights with me and two pigs. Work in the murine model of sepsis began with the lab of Dr. Craig Coopersmith at
Emory University, thanks to the help of Dr. Jonathan McDunn. Studies in this model were able to continue at UNC in collaboration with the lab of Drs. Bruce Cairns and Robert Maile
of the North Carolina Jaycee Burn Center and Department of Microbiology and Immunology. I owe special thanks to a fellow graduate student, Julie Malik, for her direct involvement with all of these experiments in the burn model of sepsis. Michelle Palacio, of
Professor Virginia Miller’s lab at UNC, also assisted with some of these experiments. I am also particularly thankful to the medical doctors we collaborated with, Bruce Cairns and
supporting me—even from afar—and always being my closest confidant, and my parents, who have always been encouraging and forced me to keep going even when I was ready to quit. Most of all, thanks to all of you for putting up with my incredible grumpiness during
those evening phone calls when you asked me how my day was…
1
TABLE OF CONTENTS
LIST OF TABLES ... xiv
LIST OF FIGURES ... xv
LIST OF ABBREVIATIONS AND SYMBOLS ... xviii
CHAPTER 1. PHYSIOLOGICAL SIGNIFICANCE OF NITRIC OXIDE AND ITS MEASUREMENT WITHIN BIOLOGICAL SYSTEMS ... 1
1.1 The ubiquitous roles of nitric oxide ... 1
1.1.1 Nitric oxide in the immune system ... 2
1.1.2 Nitric oxide in the nervous and cardiovascular systems ... 3
1.2 Nitrosothiols as physiological transporters of nitric oxide ... 4
1.3 Detection of nitric oxide and nitrosothiols ... 9
1.3.1 Spectroscopic detection of nitric oxide ... 9
1.3.2 Real-time amperometric detection of nitric oxide ... 10
1.3.3 Detection of nitrosothiols ... 16
1.4 Nitric oxide and nitrosothiols in sepsis ... 21
1.4.1 Sepsis disease progression ... 23
1.4.2 Clinical manifestations of sepsis ... 26
1.4.3 Nitric oxide and nitrosothiols as prognostic/diagnostic biomarkers ... 27
1.4.4 Animal models of sepsis ... 28
1.5 Summary of dissertation research ... 33
CHAPTER 2: CHALLENGES OF NITRIC OXIDE MEASUREMENT
FROM BIOLOGICAL SYSTEMS ... 56
2.1 Introduction ... 56
2.2 Materials and Methods ... 58
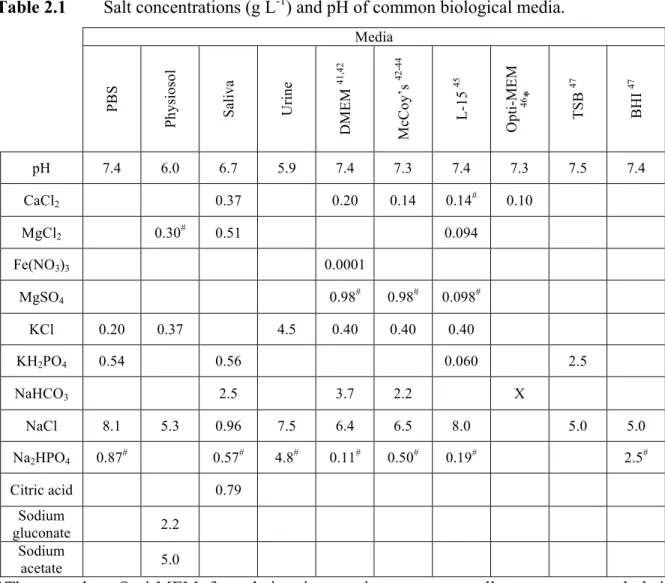
2.2.1 Preparation of physiological media ... 59
2.2.2 Synthesis of PROLI/NO ... 60
2.2.3 Griess assay ... 60
2.2.4 Chemiluminescence detection ... 61
2.2.5 Electrochemical detection ... 61
2.3 Results and Discussion ... 62
2.3.1 Nitric oxide determination via Griess ... 63
2.3.2 Chemiluminescence nitric oxide analyzer ... 75
2.3.3 Amperometric nitric oxide sensor ... 78
2.4 Conclusions ... 84
2.5 References ... 85
CHAPTER 3: MICROFLUIDIC DEVICE FOR AMPEROMETRIC NITRIC OXIDE DETECTION IN BIOLOGICAL MEDIA ... 92
3.1 Introduction ... 92
3.2 Materials and Methods ... 95
3.2.1 Preparation of working electrodes ... 96
3.2.2 Membrane synthesis and deposition ... 96
3.2.3 Microfluidic device fabrication ... 97
3.2.4 Microfluidic device characterization ... 98
3.2.5 Animals ... 99
3.3.1 Microfluidic nitric oxide sensor response in physiological fluids ... 107
3.3.2 Nitric oxide levels in sepsis ... 108
3.4 Conclusions ... 112
3.5 References ... 113
CHAPTER 4: IMPROVED DETECTION OF S-NITROSOTHIOLS VIA VISIBLE PHOTOLYSIS AND AMPEROMETRIC DETECTION IN A MICROFLUIDIC DEVICE ... 121
4.1 Introduction ... 121
4.2 Materials and Methods ... 123
4.2.1 Microfluidic device fabrication ... 123
4.2.2 Preparation of S-nitrosothiols ... 124
4.2.3 Electrochemical analysis of S-nitrosothiols ... 125
4.2.4 Determination of basal S-nitrosothiols levels in blood ... 126
4.3 Results and Discussion ... 126
4.3.1 Optimization of LED configuration ... 126
4.3.2 Detection of common low molecular weight and macromolecular nitrosothiols ... 127
4.3.3 Detection in plasma ... 131
4.4 Conclusions ... 134
4.5 References ... 136
CHAPTER 5: TEMPORAL MONITORING OF NITRIC OXIDE AND NITROSOTHIOLS IN A PORCINE MODEL OF SEPSIS ... 142
5.1 Introduction ... 142
5.2 Materials and Methods ... 144
5.2.1 Microfluidic device fabrication and characterization ... 144
5.3 Results and Discussion ... 147
5.3.1 Physiological changes in a porcine model of sepsis and their effect on circulating nitric oxide concentrations ... 148
5.3.2 Nitrosothiols versus nitric oxide in a porcine model of sepsis ... 163
5.4 Conclusions ... 168
5.5 References ... 170
CHAPTER 6: NITRIC OXIDE MONITORING IN A MURINE MODEL OF SEPSIS—EFFECTS OF BURN INJURY AND BACTERIAL VIRULENCE ... 176
6.1 Introduction ... 176
6.2 Materials and Methods ... 178
6.2.1 Microfluidic device fabrication and characterization ... 178
6.2.2 Murine model of infection with Klebsiella pneumonia and Pseudomonas aeruginosa ... 180
6.2.3 Murine model for sepsis and burn injury ... 180
6.2.4 Statistical analysis ... 181
6.3 Results and Discussion ... 181
6.3.1 Nitric oxide levels during systemic infection and the effect of virulence ... 181
6.3.2 Nitric oxide during the compensatory anti-inflammatory response syndrome following burn injury ... 188
6.4 Conclusions ... 192
6.5 References ... 193
CHAPTER 7: SUMMARY AND FUTURE DIRECTIONS ... 200
7.1 Summary of work ... 200
7.2 Future studies ... 205
APPENDIX: CELLULAR NITRIC OXIDE AND CARBON MONOXIDE—
UNDERSTANDING RELEASE FROM PHAGOCYTES AND NEURONS ... 215
A.1 Introduction ... 215
A.2 Materials and Methods ... 219
A.2.1 Sensor fabrication and characterization ... 219
A.2.2 Macrophage cell culture ... 220
A.2.3 Preparation of ganglia and neurons ... 221
A.3 Results and Discussion ... 221
A.3.1 Nitric oxide and carbon monoxide from macrophages ... 221
A.3.2 Nitric oxide release from buccal ganglia ... 226
A.4 Summary ... 228
LIST OF TABLES
Table 1.1 Common biological interferents and their basal concentrations
in vivo ... 13
Table 1.2 Summary of predominant analytical methods for detecting S-nitrosothiols in biological samples ... 18
Table 1.3 Definition of systemic inflammatory response syndrome, sepsis, severe sepsis, and septic shock ... 22
Table 1.4 Summary of reported changes in NO and its metabolites during sepsis ... 29
Table 1.5 Advantages and caveats of various animal models of sepsis ... 31
Table 2.1 Salt concentrations and pH of common biological media ... 65
Table 2.2 Amino acid concentrations of common biological media ... 66
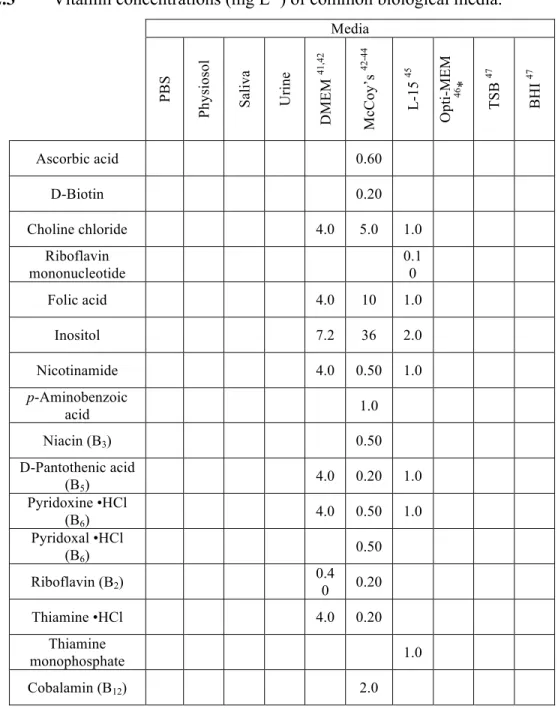
Table 2.3 Vitamin concentrations of common biological media ... 67
Table 2.4 Concentrations of other additives in common biological media ... 68
Table 2.5 Total NO release from AHAP xerogel films in various media at 1 and 2 weeks as determined using nitrite concentrations via the Griess assay ... 74
Table 2.6 Kinetic parameters of NO release from PROLI/NO in PBS, physiosol, L-15, and artificial saliva ... 77
Table 3.1 Selectivity coefficients of common interferents for both bare and xerogel-coated platinum working electrodes ... 106
Table 4.1 Effect of light intensity and irradiation area on S-nitrosoglutathione sensitivity in oxygenated phosphate buffered saline ... 130
Table 4.2 Sensitivity and limit of detection of a range of S-nitrosothiol species in oxygenated phosphate buffered saline and plasma ... 132
Table 5.1 Levels of nitric oxide, lactate, base excess, white blood cells, and hemoglobin at baseline, 4, and 15 h ... 160
LIST OF FIGURES
Figure 1.1 Routes of nitrosothiol formation in vivo requiring nitric oxide,
oxygen, and glutathione ... 7
Figure 1.2 Routes of decomposition of nitrosothiols ... 8
Figure 1.3 Changes in immune response during the progression of sepsis
in human patients ... 25
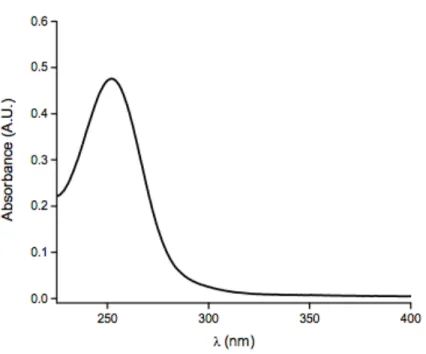
Figure 2.1 UV-visible spectra of 14.9 µg mL-1 PROLI/NO in 1.0 M
sodium hydroxide ... 64
Figure 2.2 Total NO released from PROLI/NO in several types of
biological media determined via Griess assay and chemiluminescence ... 72
Figure 2.3 Concentration dependence trends of PROLI/NO in different
types of media for Griess assay, chemiluminescence, and amperometry ... 73
Figure 2.4 Nitric oxide totals measured using PROLI/NO as the NO
source in several types of biological media as determined via amperometry
in oxygenated and deoxygenated solutions ... 82
Figure 2.5 Distance-dependent NO release from xerogel membranes in PBS
detected via constant potential amperometry ... 83
Figure 3.1 Cutaway illustration of electrode locations and channel construction;
and, fully assembled device with inlet and outlet reservoirs. ... 103
Figure 3.2 Illustration of device cross-section. ... 104
Figure 3.3 Typical sensor response of bare and xerogel-coated electrodes
in microfluidic geometry to NO in PBS ... 105
Figure 3.4 Typical microfluidic sensor response to 1 µM increases in NO
concentration and full dynamic range in porcine whole blood ... 110
Figure 3.5 Temporal changes in blood NO concentrations during the progression
of sepsis in a pneumonia murine model of sepsis ... 111
Figure 4.1 Representative amperometric responses for CysNO detection
with varied light intensity ... 129
Figure 4.2 Representative amperometric responses for CysNO added directly
to phosphate buffered saline, plasma, and whole blood ... 133
Figure 5.2 Changes in heart rate of septic versus control swine ... 150
Figure 5.3 Changes in mean arterial pressure of septic versus control swine ... 151
Figure 5.4 Percent change from baseline NO concentrations in septic
versus control swine ... 153
Figure 5.5 Percent change from baseline white blood cell counts in
septic versus control swine ... 155
Figure 5.6 Percent change from baseline hemoglobin concentrations
in septic versus control swine ... 156
Figure 5.7 Percent change from baseline lactate concentrations in
septic versus control swine ... 158
Figure 5.8 Percent change from baseline base excess in septic versus
control swine ... 159
Figure 5.9 Correlation between changes in nitric oxide and fraction of
oxyhemoglobin in blood for severely septic swine ... 162
Figure 5.10 Box-and-whisker plots depicting percent change in NO for
control and septic animals in mixed-breed and Yucatan mini pigs ... 164
Figure 5.11 Percent change from baseline lactate concentrations in septic
versus control Yucatan swine ... 165
Figure 5.12 Percent change from baseline NO concentrations in septic
versus control Yucatan swine ... 166
Figure 5.13 Percent change from baseline nitrosothiol concentrations
in septic versus control Yucatan swine ... 167
Figure 6.1 Change in blood NO concentrations for uninfected and
Pseudomonas aeruginosa infected mice ... 183
Figure 6.2 Change in blood NO concentrations for uninfected and
Klebsiella pneumoniae infected mice ... 184
Figure 6.3 Change in blood NO concentrations over time during Pseudomonas aeruginosa and Klebsiella pneumoniae infections
in a murine model ... 185
Figure 6.4 Percent change in murine blood NO concentrations relative to uninfected animals during infections with Pseudomonas aeruginosa
Figure 6.5 Percent change in murine blood NO concentrations relative to basal levels during infections with Pseudomonas aeruginosa and
Klebsiella pneumoniae ... 187
Figure 6.6 Nitric oxide levels 48 h following P. aeruginosa infection
in a murine model of sepsis, both with and without prior burn injury ... 189
Figure 6.7 Percent change in NO relative to uninfected mice during Pseudomonas aeruginosa with and without 14 d prior burn injury
and after rapamycin treatment ... 191
Figure A.1 Release profiles of NO and CO following stimulation with
LPS/ IFN-γ and hemin/NADPH, respectively ... 222
Figure A.2 Nitric oxide release from unstimulated macrophage cells and
those stimulated with LPS and IFN-γ ... 224
Figure A.3 Carbon monoxide release from macrophage cells pre-incubated
with 20, 50 and 100 µM hemin and LPS/IFN-γ for ~18 h ... 225
Figure A.4 Nitric oxide release from a H. trivolvis buccal ganglia following
LIST OF ABBREVIATIONS AND SYMBOLS
~ approximately
° degree(s)
°C degree(s) Celsius
% percentage(s)
± statistical margin of error $ dollar(s)
× g times the force of gravity [NO]m maximum NO concentration
7-NI 7-nitroindazole
17FTMS (heptadecafluoro-1,1,2,2-tetrahydrodecyl)trimethoxysilane
µA microampere(s)
µg microgram(s)
µL microliter(s)
µm micrometer(s)
µmol micromole(s)
µM micromolar
Ag silver
Ag/AgCl silver/silver chloride
ATCC American Type Culture Collection
Au gold
CARS compensatory anti-inflammatory response syndrome
CFU colony forming unit(s) CO carbon monoxide
CO2 carbon dioxide CRP C-reactive protein
Cu copper
CV cyclic voltammetry CVC central venous catheter(s)
cGMP cyclic guanosine monophosphate Cys L-cysteine
CysNO nitrosocysteine
d day(s)
DI deionized
DNA deoxyribonucleic acid
DPV differential pulsed voltammetry DTPA diethylene triamine pentaacetic acid
e- electron
EDTA ethylenediaminetetraacetic acid
e.g. for example
eNOS endothelial nitric oxide synthase
et al. and others etc. and so forth EtOH ethanol
FBS fetal bovine serum
FDA Food and Drug Administration
Fe iron
GSH L-gluathione GSNO nitrosoglutathione
g gram(s)
h hour(s)
H2O water
HCl hydrochloric acid H2S hydrogen sulfide
i.e. that is I.V. intravenous
IFN interferon IL interleukin
iNOS inducible nitric oxide synthase
IVC intravascular catheter KCl potassium chloride
KOH potassium hydroxide kg kilogram(s)
LOD limit of detection LPS lipopolysaccharide
M molar
MeOH methanol mg milligram(s)
min minute(s) mL milliliter(s) mm millimeter(s)
mM millimolar mmol millimole(s)
mV millivolt(s) mol mole(s)
MTMOS methyltrimethoxysilane
MΩ megaohm N2 nitrogen gas
nA nanoampere(s) NaCl sodium chloride
NADPH nicotinamide adenine dinucleotide phosphate
NH4OH ammonium hydroxide
nM nanomolar
nNOS neuronal nitric oxide synthase NO nitric oxide
NO2- nitrite NO3- nitrate
NOX nitrogen oxdie species
NOS nitric oxide synthase o-PD o-phenylenediamine O2 oxygen gas
OONO- peroxynitrite P partial pressure
pA picoamperes
PBS phosphate buffered saline, pH 7.4
pH –log of proton concentration PDMS polydimethylsiloxane pM picomolar
ppb parts per billion ppm parts per million
PROLI/NO N-diazeniumdiolated L-proline Pt platinum
PtB platinum black
PTFE polytetrafluoroethylene PVP poly(vinyl pyrollidone)
rpm revolutions per minute RSNO S-nitrosothiol
s second(s)
S1813 S1813 photoresist
SECM scanning electrochemical microscopy
SIRS systemic inflammatory response syndrome
Sn tin
t time
[NO]tot total concentration of NO t1/2 NO release half life
Ti titanium
TNF tumor necrosis factor
TSB tryptic soy broth U.S. United States UV ultraviolet
v:v volume to volume ratio
V volt(s)
wt weight
× times
Zn zinc
CHAPTER 1. PHYSIOLOGICAL SIGNIFICANCE OF NITRIC OXIDE AND ITS MEASUREMENT WITHIN BIOLOGICAL SYSTEMS
1.1 The ubiquitous roles of nitric oxide
Investigation into the physiological roles of nitric oxide (NO) has expanded immensely since the realization that the endothelial derived relaxation factor was, in fact,
likely to be NO.1 Since that time, the pivotal role of this gaseous free radical species has been recognized in numerous biological processes including the immune response to infection,2-4
vasodilation,5 would healing,6,7 and cancer biology.8 Nitric oxide is known to impart physiological activity through binding to the heme center of soluble guanylyl cyclase (sGC), an enzyme involved in the formation of the second messenger cyclic guanosine
monophosphate (cGMP). A multitude of physiological processes are linked to cGMP, including vascular smooth muscle relaxation, platelet activation, and protein kinase signaling
cascades.9 As such, the physiological roles of NO are far-reaching.
Despite the breadth of knowledge that has been gained since its discovery, much remains unknown about NO, especially with regard to absolute concentrations, its role in
specific disease states, and how its dysfunction can be corrected for. As such, new detection methodologies are sought after to further the understanding of this small but immensely
1.1.1 Nitric oxide in the immune system
Within the immune system, NO is produced by specific cells (i.e., monocytes/macrophages, neutrophils, eosinophils) by the inducible isoform of nitric oxide
synthase (iNOS), an enzyme whose expression is regulated by complex cascades of cytokines from different immune cells.4,10 All isoforms of NOS (i.e., inducible, endothelial,
neuronal) produce NO from L-arginine, which is oxidized to produce N-hydroxy-L-arginine. Further oxidation of this intermediate yields both L-citrulline and NO. Stimulation of iNOS by cytokines or components of the bacterial cell wall allows for continuous release of NO for
up to 5 d, as long as the stimuli remains present and the intracellular L-arginine supply is not depleted.4 When released by these cells, NO acts as a signaling molecule and may have
antimicrobial/anti-tumor (pro-inflammatory) activity or immunosuppressive (anti-inflammatory) effects, depending on the concentration released. For example, the presence of bacteria within the body will signal an upregulation in iNOS production and subsequent
release of NO from immune cells will cause killing of nearby microbial organisms.3,4,11-13 The bactericidal properties of NO are attributed to both nitrosative and oxidative stress.14 For
example, the reaction of NO with oxygen produces toxic byproducts such as dinitrogen trioxide, which initiates nitrosation of protein thiols and DNA deamination. Nitric oxide may also react with superoxide (a radical product of normal cell respiration) to yield peroxynitrite.
Buildup of peroxynitrite results in lipid peroxidation and membrane damage.15-17 While eukaryotic cells have evolved mechanisms for preventing buildup of such toxic byproducts
infection and/or injury.18,19 While NO may be elevated to dangerous levels in the presence of high concentrations of bacteria, low NO concentration may indicate immune suppression and/or an insufficient response to infection.
Nitric oxide may also serve an opposing role in the immune system as an anti-inflammatory molecule or immune suppressant, providing a mechanism to defend the host
from itself. For example, NO suppresses T helper cell proliferation and cytokine production, thus limiting the chronic immune response.20 Neutrophils, which are involved in the body’s non-specific response to infection, while stimulated by low NO concentrations, may
experience inhibited adhesion to endothelial cells when exposed to high concentrations of NO, thus hindering their ability to traverse the vascular wall and migrate to local sites of
infection.21 Further, NO has been observed to inhibit mast cell degranulation.22 While these negative feedback mechanisms help to prevent potentially dangerous chronic inflammatory states, immune dysfunction is still prevalent in severe diseases such as sepsis.
1.1.2 Nitric oxide in the nervous and cardiovascular systems
Unlike the immune system, NO in the nervous and cardiovascular systems is
generally not produced by an inducible NOS isoform. Instead, it is generated by NOS isoforms that are triggered by increases in intracellular calcium: endothelial (eNOS) and neuronal (nNOS) nitric oxide synthase for the cardiovascular and nervous systems,
respectively.23-25 Small, transient increases in intracellular calcium concentrations will thus cause short-lived production of NO (nM amounts within 10 min),26 in contrast to the
sustained production resulting from iNOS stimulation.
adhesion.5,23,27,28 Due to its function as a blood pressure regulator, reduced bioavailability of NO may be of importance in a number of cardiovascular diseases.29 Naseem reported that reduced NO release from the endothelium may lead to more rapid progression of diseases
such as atherosclerosis, where adhesion of platelets and leukocytes contribute to buildup and blockage along the vascular wall.29 Additionally, hindered NO production could lead to
decreased angiogenesis. Conversely, overproduction of NO would cause dangerous systemic vasodilation.
Within the central nervous system, NO is involved with general neurotransmission,
thermal regulation, hormone release, and sleep cycles.30-33 Nitric oxide is also known to play a key role in long-term potentiation (memory formation).34 Studies by Rehder et al. have
indicated the importance of NO in neuronal development, as it regulates the extension of neuronal growth cone filopodia.35,36 Nitric oxide produced by nNOS within the peripheral nervous system is also involved with smooth muscle relaxation.25 Similar to the
cardiovascular and immune systems, dysfunctional NO production within the nervous system can contribute to disease. Inflammation and the resulting NO production contributes to
numerous neurodegenerative diseases, including Alzheimer’s, Parkinson’s, amyotrophic lateral sclerosis, and multiple sclerosis.37
1.2 Nitrosothiols as physiological transporters of nitric oxide
Nitric oxide is a free radical gaseous species with a half-life ranging from milliseconds to seconds depending upon its concentration and the medium in which it
of NO and transducers of NO bioactivity. Nitrosothiols have been shown to exhibit effects similar to NO in vivo, including smooth muscle relaxation40 and reduced platelet adhesion.41 Unlike free NO radicals, nitrosothiols do not react directly with metalloproteins (e.g.,
hemoglobin) or other radical species (e.g., superoxide), thus increasing their lifetime and preventing the buildup of toxic species such as peroxynitrite.
S-nitrosothiols are synthesized on the bench top via a reaction between thiols and species such as nitrous acid, dinitrogen trioxide, dinitrogen tetraoxide, or nitrosyl chloride.42 In vivo, nitrosothiols may be formed via multiple reactions involving NO and/or its
byproducts with the thiols of proteins (e.g., albumin and hemoglobin), amino acids (e.g., L -cysteine), and other small molecules (e.g., glutathione).43 Blood plasma alone contains ~600
µM thiol “groups”, including ~500 µM albumin and 20–45 µM low molecular weight thiols (i.e., L-cysteine and glutathione).44 Despite it’s greater size and abundance, albumin contains only one free cysteine residue at which nitrosothiols form. Though once considered a major
scavenger of NO, Stamler et al. demonstrated the ability of hemoglobin to accommodate nitrosation of its β-93-cysteine group, thus conserving the biological reactivity of NO by
forming S-nitrosohemoglobin.45 Nitric oxide stored in this manner may later be released by multiple mechanisms, most notably under hypoxic conditions.46-48
As shown in Figure 1.1, a common route of nitrosothiol formation requires a mixture
of NO, oxygen (O2), and a thiol.49 One of many nitrosothiol formation pathways relies on the oxidation of NO by O2, where a peroxynitrite radical is generated and then further reacts with
NO to produce nitrogen dioxide (•NO2). At normal physiological concentrations of NO (i.e.,
<100 nM), this reaction is unlikely as it may take hours to proceed.50 In the event that this
subsequently combine with NO to form nitrosothiol. Alternatively, •NO2 may react with
another molecule of NO to form dinitrogen trioxide (N2O3), which directly nitrosates a thiol species. In the event that NO autooxidation does not take place, NO reacts directly with a thiol, forming an aminoxyl radical that can be oxidized to form nitrosothiol. Evidence
suggests that copper and iron ions can also generate S-nitrosothiols. The proposed mechanisms involve either a one-electron oxidation of a thiol (with subsequent reaction of the thiyl radical with NO) or the formation of a complex between NO and the metal.51,52 This
mechanism is complicated by the fact that these same metals also initiate nitrosothiol decomposition. Within cellular compartments, transnitrosation is important in the formation
and function of S-nitrosothiols.53 In this reaction, a thiolate anion attacks a nitroso nitrogen, allowing for transfer of the S-nitroso functional group as shown below:
RS- + Rʹ′SNO ⇌ RSNO + Rʹ′S-
Of note, transnitrosation rates are not equal between all thiols, and may vary between 0.1 and 500 M-1s-1.50
While S-nitrosothiols species are considered stable relative to the lifetime of free NO in vivo, numerous mechanisms exist by which nitrosothiols decompose to release NO. As shown in Figure 1.2, thermal and photolytic cleavage are two decomposition mechanisms
that result in hemolytic cleavage of the S–N bond, generating a thiyl radical and gaseous NO.54 While trace metals such as copper have been implicated in the formation of
Figure 1.1 Routes of nitrosothiol formation in vivo requiring nitric oxide, oxygen, and glutathione.
NO GSNO
NO2- + GS
GS
-GSSG
-GSSG O2
O2
-NO
ONOO
-NO3
-OH GSH
NO2
GS
-NO 1/2 O2
GSH
GSNOH GSNO
O2 O2
-NO
N2O3
2NO2
-H2O
H+
GSH
GSNO + NO2
-GSH
GSSG NO
GSNO
NO2- + GS
GS
-GSSG
-GSSG O2
O2
-NO
ONOO
-NO3
-OH GSH
NO2
GS
-NO 1/2 O2
GSH
GSNOH GSNO
O2 O2
-NO
N2O3
2NO2
-H2O
H+
GSH
GSNO + NO2
-GSH
Figure 1.2 Routes of decomposition of nitrosothiols.
R S
N O
Cu(I) Cu(II) + RS
-NO RS
R'SH
R'SNO + RSH light
heat
transnitrosation between a nitrosothiol and free thiols is an alternative and biologically relevant route of decomposition.
As the formation and decomposition of nitrosothiols in vivo are so closely linked with
NO-dependent pathways, a major goal has been to study their concentrations within cells and tissues. Within mouse macrophage cells (RAW 264.7), S-nitrosothiol levels are reported to be ~5 pmol mg-1 protein.55 Reported basal concentrations of nitrosothiols in blood plasma range widely, from 1 nM in rats56 to µM levels in humans, depending on the measurement technique utilized.57 Certain disease states lead to even greater levels of nitrosothiol
formation and accumulation. In one example, nitrosothiol levels were observed to increase from 300 nM in healthy subjects to 4 µM in pneumonia patients.58
While the roles of both NO and nitrosothiols in the body are apparent, much remains unknown regarding specific pathways and mechanisms of action. As such, techniques to accurately monitor small concentration changes and pinpoint specific protein targets are
critical for future studies.
1.3 Detection of nitric oxide and nitrosothiols 1.3.1 Spectroscopic detection of nitric oxide
To date, NO can be measured in a number of ways, each with distinct advantages. Spectroscopic methods (i.e., absorbance, fluorescence, chemiluminescence, and electron paramagnetic resonance) rely on the indirect detection of NO via byproducts of reactions with other chemicals or adducts formed between NO and other compounds.59 First described
the reaction of NO with oxygen in aqueous media, and upon reaction with sulfanilamide and N-(1-napthyl)ethylenediamine an azo dye is formed. Absorbance spectroscopy is then used to relate the concentration of dye to the concentration of nitrite (and thus NO that was in
solution). Although inexpensive and easily obtained commercially, the Griess assay only provides a limit of detection of ~0.5 µM in buffer solution and is mainly useful for
determination of NO totals.59,61,62 The lack of real-time information and poor limit of detection of this assay preclude its use for analysis of biological solutions.
In contrast, chemiluminescence detection, a more costly method due to
instrumentation requirements, measures NO directly via reaction with ozone.63 This reaction produces an excited state nitrogen dioxide, which emits a photon upon relaxation to the
ground state. Nitric oxide-release kinetics may be determined directly from materials in solution, as the NO is immediately transported from solution to the detector by an inert carrier gas. As an alternative, nitrate and nitrite in solution can be measured following their reduction to NO. These spectroscopic techniques generally require complex instrumentation
and thus are not amenable to in vivo applications. Additionally, their use with biological media (e.g., cell culture solutions and blood/serum) is limited due the need to purge solutions of oxygen.
1.3.2 Real-time amperometric detection of nitric oxide
Due to NO’s redox activity, electrochemistry is also commonly used to quantify NO in a variety of formats (e.g., direct oxidation via amperometry) and even at the single cell level due to the ability to miniaturize sensors.62 Currently, electrochemical methods for
measurement of NO provides some distinct advantages, including superior spatial and temporal resolution, the potential for low limits of detection, and the ability to tune selectivity and sensitivity by changing the potential applied or modifying the electrode with a catalyst and/or permselective membrane.59,64
Electrode platforms of varied shapes and sizes can be fabricated for the amperometric detection of NO, providing excellent spatial resolution when required.
Despite the simplicity of this measurement technique, a number of important considerations must be made to carry out accurate physiological measurements. The
sensitivity, limit of detection (LOD), and linear response range of the sensor are especially important given the varied, but generally small concentrations of NO (i.e., picomolar to
micromolar) that exist physiologically. For an amperometric measurement, selectivity is equally important given the number of potential electroactive interferents that may be present in vivo (e.g., nitrite, nitrate, hydrogen sulfide, ascorbic acid, dopamine). Due to its reactive
nature, not all the NO released from a system may reach the electrode surface to be detected. As such, the size and shape of the electrode must be carefully considered for each
application. For example, measurement of NO from a single cell adhered to a surface would best be achieved by placing a small electrode (similar in size to the cell) directly above the cell, thus limiting the distance traveled and the amount of NO that is allowed to diffuse
and/or react without being detected. Despite such operational challenges, a number of sensor systems have been developed and demonstrated to accurately measure physiological levels of
NO.
oxidized/reduced at a similar potential). The most common electrodes are platinum,2 carbon fiber,65 glassy carbon,66 and gold.67 Platinum is perhaps most widely utilized as it can be coated with small platinum black particles to increase microscopic surface area, thus
significantly improving sensitivity and detection limits.68-70
Amperometric measurements in biological systems are made even more challenging
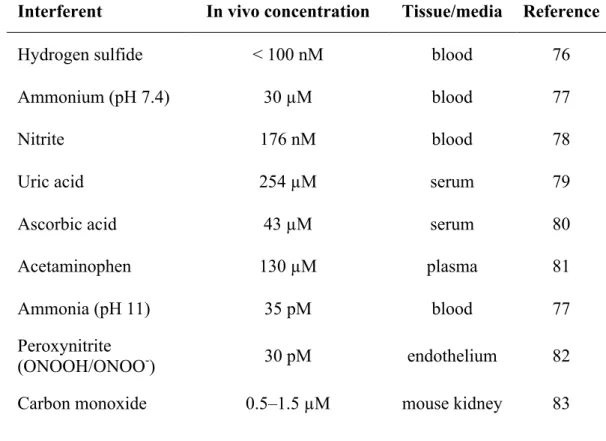
by a number of interferents that may be present in whole blood, plasma/serum, or cell/bacteria culture medium. Such species are electroactive at working potentials similar to or lower than NO (i.e., +0.7–1.0 V for oxidation). Common biological interferents and their
concentrations are given in Table 1.1. The membranes utilized for enhancing selectivity toward NO vary significantly depending on other sensor characteristics. Most selective
membranes rely on exclusion of interferents based on size and/or charge. For example, Nafion® is a widely used hydrophobic, cation exchange fluoropolymer that is applied via a dip-coating process and excludes interferents based on charge.71 While applied in a manner
similar to Nafion®, xerogel-based permselective membranes allow for greater control of hydrophobicity and porosity. Shin et al. first described the use of xerogels derived from
fluorinated alkylalkoxysilane precursors to maximize selectivity of electrodes toward
NO.72,73 Additionally, xerogels may be applied to any sensor geometry (i.e., disk type,
conical, planar) via dip coating, casting, or spray coating application of the sol.74 To exclude
interferents based on size, Ferreira et al. electropolymerized o-phenylenediamine (o-PD) onto carbon film electrodes that had previously been dip coated with Nafion®.75 This treatment
Table 1.1 Common biological interferents and their basal concentrations in vivo.
Interferent In vivo concentration Tissue/media Reference
Hydrogen sulfide < 100 nM blood 76
Ammonium (pH 7.4) 30 µM blood 77
Nitrite 176 nM blood 78
Uric acid 254 µM serum 79
Ascorbic acid 43 µM serum 80
Acetaminophen 130 µM plasma 81
Ammonia (pH 11) 35 pM blood 77
Peroxynitrite
(ONOOH/ONOO-) 30 pM endothelium 82
films of oligo(dimethyl-siloxane) copolymer as permselective coatings, allowing for a 25:1 selectivity for NO over nitrite while maintaining sensitivities to NO that were similar to bare electrodes.84 An alternative means of enhancing selectivity without coatings is the use of
nanopore electrodes. Shim et al. developed a nanopore-platinized platinum electrode for NO detection by electrochemically etching a platinum nanodisk and subsequently depositing
layers of porous platinum black onto the disk.85 The inside of the pore was then silanized to increase hydrophobicity and further enhance sensitivity and selectivity.
While all electrochemical NO sensors utilize a specific working electrode material
and selective membrane, varied sensor styles can also be considered depending on the application. The Shibuki-style sensor, based on the original oxygen electrode developed by
Clark et al.,86 is comprised of a micropipette which contains both the working (platinum) and reference (silver) electrodes. This micropipette is then sealed with a gas-permeable membrane and filled with electrolyte solution.87 As the construction of the Shibuki sensor
limits its amenability to miniaturization, new sensors were designed to avoid the requirement of an internal filling solution. Solid permselective electrodes allow for direct modification of
the electroactive area with a hydrophobic membrane, typically via a simple dip coating or casting process. This advancement accommodates the use of electrodes of varied shapes and size. Designed in a manner similar to the solid permselective electrodes, solid catalytic
sensors were created to improve the efficiency of the oxidation or reduction of NO at the electrode surface and/or allow for a reduction in the working potential. Such electrodes
Each of the aforementioned sensor designs is capable of detecting NO via its oxidation or reduction. While electrooxidation is primarily used, some reports of NO measurement via electroreduction exist.89-91 This reaction proceeds via the following two
electron process at potentials ranging from -0.5 to -1.4 V vs. Ag/AgCl:88 2NO + 2e- ! N2O2-
Of note, oxygen is a major interferent in this process as it is also reduced at -0.6 V vs. Ag/AgCl via the process given below:
O2 + 4H+ + 4e- !2H2O
While most other interfering species are avoided when utilizing electroreduction, reduced sensitivity is a caveat. Furthermore, electroreductive NO sensors do not operate efficiently at
physiological pH and are characterized by poor detection limits (i.e., µM range).92 Improved sensitivity is possible by coating electrodes with complexes that catalyze the reduction of NO (e.g., chromium complexes,93 hemoglobin94). Despite these few reports of NO detection via
electroreduction, oxidation of NO remains the most common means of detecting NO electrochemically.
Nitric oxide is readily oxidized at potentials ranging from +700–900 mV vs. Ag/AgCl reference via the three-electron process below:95,96
NO ! NO+ + e-
NO+ + OH-! HNO2 HNO2 + H2O ! NO3- + 2e- +3H+
Catalytic oxidation of NO allows for enhancement of both selectivity and sensitivity by reducing the potential at which NO is oxidized, thus limiting the effect of interfering species. Recently reported electrode modifications include metalloporphyrins,
metallophthalocyanines, self-assembled monolayers (SAMs), and protein catalysts. For example, Hrbáč et al. utilized the electropolymerization of nickel porphyin onto carbon fiber
microelectrodes to achieve a 6-fold increase in sensitivity while also enhancing selectivity.97 Unfortunately, metalloporphyrins degrade rapidly, so metallophthalocyanines have been adopted as a more stable alternative electrocatalytic layer.98 Self-assembled monolayers form
highly stable chemical bonds with glassy carbon electrodes, making them useful as electrocatalysts for compounds with relatively high oxidation potentials (e.g., NO).
Sivanesan et al. utilized SAMs of 1,8,15,22-tetraaminophthalocyanatocobalt(II) to decrease NO’s oxidation potential by 310 mV while simultaneously increasing the oxidation current produced.99
Electrochemical detection continues to be one of the most promising methods for NO measurement, especially from biological systems. Further enhancements in sensitivity and
selectivity, as well as new sensor configurations (e.g., microfluidic devices) will allow for greater understanding of the many essential roles of NO in vivo.
1.3.3 Detection of nitrosothiols
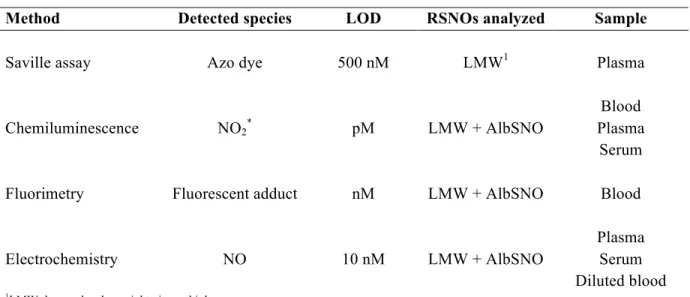
and chemical reduction) as shown in Figure 1.2. The figures of merit for the most commonly utilized methods for nitrosothiol detection are outlined in Table 1.2.
The Saville assay is a colorimetric assay modeled after the Griess assay.101 Mercuric
ions (Hg2+) are used to cleave the S–NO bond. The NO+ generated from this cleavage then reacts with O2 to form nitrite (NO2-). The reaction then proceeds in the same manner as the
Griess assay, where nitrite is reacted with acidic sulfanilamide and N-(1-naphthyl)ethylenediamine to form an azo dye which is detected spectrophotometrically.60 Despite the simplicity of this assay, in vivo nitrite concentrations are usually much greater
than that of nitrosothiols, making accurate quantification of nitrosothiols challenging. Indeed, the limit of detection for the Saville assay is ~500 nM in buffer solution. Analogous to the
Saville assay, nitrite generated from nitrosothiols can be reacted with 2,3-diaminonaphthalene to form the fluorescent 2,3-naphthotriazole (λexcitation = 365 nm, λemission = 405 nm) for in situ detection.102 As a more selective alternative, 4,5-diaminofluorescein can
be used to react directly with NO released from nitrosothiols.103 However, while the UV photolysis utilized to decompose nitrosothiols is efficient, it also causes NO generation from
nitrate, leading to artificially elevated NO totals.78 Chemiluminescence NO detection has also been combined with reductive or photolytic cleavage of nitrosothiols.104 Detection limits have been reported in the nM range with various reducing agents employed depending on the
application (e.g., Cu+/cysteine, iodine/triiodide).105,106 Although less common due to cost, high performance liquid chromatography (HPLC) has been used to separate and detect
Table 1.2 Summary of predominant analytical methods for detecting S-nitrosothiols in biological samples.
Method Detected species LOD RSNOs analyzed Sample
Saville assay Azo dye 500 nM LMW1 Plasma
Chemiluminescence NO2* pM LMW + AlbSNO
Blood Plasma
Serum
Fluorimetry Fluorescent adduct nM LMW + AlbSNO Blood
Electrochemistry NO 10 nM LMW + AlbSNO
Plasma Serum Diluted blood
theoretically allow for a means of direct nitrosothiol detection via electrochemistry, this method would suffer from O2 interference and not accommodate selective detection of different types of nitrosothiols due to the similar reduction potentials required. As such,
indirect electrochemical detection of nitrosothiols is achieved in a manner similar to other nitrosothiol assays, where NO detection (via electrochemical oxidation) follows nitrosothiol
decomposition.
Compared to other techniques, detection of nitrosothiols via electrochemistry provides superior spatial and temporal resolution without the requirement of complex or
costly instrumentation. S-nitrosothiol decomposition to NO may be achieved in a manner identical to other techniques, including chemical reduction and photolysis. Copper catalyzed
reduction is one such method and whereby the addition of copper chloride salt or the addition of copper(II) in the presence of an additional reducing agent (e.g., glutathione, L-cysteine, ascorbate) breaks down the nitrosothiols to NO. Despite the facile nature of this method, NO
generation (and thus nitrosothiol amount detected) varies significantly based on the amount of Cu+ or the ratio of Cu2+ to reducing agent.108-110 Furthermore, the addition of catalyst
solutions to small biological samples is inconvenient and has the potential to dilute already small quantities of nitrosothiols to undetectable levels. To deal with these shortcomings, Meyerhoff et al. developed immobilized catalysts for the decomposition of NO and
incorporated them into electrochemical NO sensors. A number of catalysts (e.g., copper, organoselenium, organotelluride) were immobilized into sensor membranes that coated the
Nevertheless, these devices were utilized to estimate levels of both low and high molecular weight nitrosothiols in biological samples. Meyerhoff et al. also developed nitrosothiols sensors that entrapped glutathione peroxidase behind a NO-selective PTFE membrane.
Exploiting a similar idea, Bedioui et al. designed a ring-disk ultramicroelectrode where the center disk oxidized electrodeposited Cu(0) to Cu(I).116 The Cu(I) released facilitated
nitrosothiol decomposition and the outer ring was used to detect the resulting NO. The same group also demonstrated the utility of this method using both dual disk-disk and band-band electrode configurations.116
Alternatively, nitrosothiol decomposition may be triggered by light, specifically in the wavelength ranges of 290–270 nm and 505–625 nm.117 Decomposition via photolysis occurs
by direct homolytic cleavage of the S–NO bond without involvement of side reactions.117 Coupling this decomposition pathway with electrochemical detection of NO is particularly appealing as the light intensity (and thus NO generation) is highly tunable. Light sources can
easily be adapted to a variety of electrochemical configurations, including small microfluidic devices. Additionally, this method does not require the addition of chemicals to samples,
which is especially important if the sample volume is small and/or when measurements must be made rapidly. Riccio et al. described the combination of visible photolysis and amperometric detection of S-nitrosothiols.118 Visible light (532 nm) was chosen to avoid electrochemical interference, as ultraviolet (UV) light generates NO from nitrite in solution, and would thus overestimate nitrosothiol concentrations.78 Despite slightly decreased
blood plasma. Despite these advantages, the measurement required deoxygenation of the sample to overcome NO scavenging by oxygen. Additionally, relatively large sample volumes (~20 mL) were required for analysis. While these shortcomings limit the current
clinical utility of this measurement technique, a light source could easily be coupled with numerous sensor configurations. For example, incorporation into a microfluidic device would
allow for improved sample irradiation with enhanced sensitivities and detection limits. Additionally, a microfluidic device is more amenable to the small sample volumes required for future clinical analysis applications.
1.4 Nitric oxide and nitrosothiols in sepsis
The general understanding of sepsis within the medical community has varied greatly throughout the years. During the sixteenth century, what we now understand to be sepsis was referred to as “hectic fever.”119 Even then, Machiavelli understood that this mysterious
malady was easy to treat but difficult to detect at its inception, while later becoming simple to recognize but challenging to cure.119 More recently, sepsis was simply considered to be a
systemic host response to infection.120 A more detailed, concrete definition of sepsis was not outlined until 1992, when the American College of Chest Physicians and the Society of Critical Care Medicine convened and came to a consensus on the differences between the
spectrum of syndromes related to the body’s response to infection.121 As outlined in Table 1.3, this spectrum includes systemic inflammatory response syndrome, sepsis, severe sepsis,
Table 1.3 Definition of systemic inflammatory response syndrome, sepsis, severe sepsis, and septic shock in humans.
Syndrome Definition
Systemic inflammatory response syndrome (SIRS)
2 or more of the following:
- Body temperature >38°C or<36°C - Heart rate >90 beats per minute - Respiration >20 breaths per minute or
PaCO2 <32 mmHg
- White blood cell count >12,000 mm-3 or <4,000 mm-3
Sepsis SIRS caused by suspected or confirmed
infection
Severe sepsis Sepsis with acute organ dysfunction, hypotension, or hypoperfusion
Septic shock Sepsis with hypotension/hypoperfusion
The current framework for classifying patients with sepsis is extremely important given its severity, the challenge of diagnosis, and associated treatment strategies. A recent epidemiological study examined trends in sepsis from 1979 through 2000, revealing that
>750,000 cases of sepsis occur annually in the United States, accounting for 1.3% of all hospitalizations.123 While mortality has decreased over the years and currently ranges from
18–30%, sepsis remains the leading cause of death in critically-ill patients. Recent statistics indicate sepsis-related incidences are increasing by 8.7% annually. In the United States alone, healthcare costs for treating sepsis exceed $16 billion.124 Clearly the need for
improved understanding, diagnosis, and treatment of the disease and its underlying causes is highly warranted.
1.4.1 Sepsis disease progression
The immune response to pathogens broadly is a normal physiological response and is usually tightly regulated. During a typical infection by a limited number of bacteria, the
innate immune response is initiated upon detection of the invading organisms and the polarization of local macrophages to the M1 (pro-inflammatory) phenotype.125 Detection of
foreign pathogens can occur through a number of mechanisms, although the best understood are pathogen-recognition receptors (e.g., Toll-like receptors) that identify bacterial cell wall components (e.g., lipopolysaccharide). The resulting “activated” macrophages (along with
other immune cells) phagocytose the invading organisms and produce pro-inflammatory cytokines (e.g., tumor necrosis factor, IL-6, and IL-8) in order to recruit other circulating
combination of reduced pH, proteases, and other antimicrobial agents (including NO) cause rapid killing and clearance of the invading species.
Sepsis, being a systemic inflammatory response, occurs when this normal response to
infection becomes so severe or dysfunctional that it causes harm to the host. Such action may be caused when the bacterial load present is too large for the body to handle, when the
infection is due to a particularly virulent strain, or when the immune system is not functioning properly. This dysfunction will cause a number of physiological changes, both at the cellular and systemic levels, leading to severe and dangerous symptoms. During the later
stages of sepsis, the body enters an immunosuppressive phase, termed the compensatory anti-inflammatory response syndrome (CARS).126 This phase of the disease is particularly
dangerous, as it increases patient susceptibility to secondary infections and death. Figure 1.3 illustrates this changing immune response over time during the progression of sepsis.
During the first phase of sepsis, a dramatic increase in production of
pro-inflammatory cytokines is observed. This phenomenon, know as the “cytokine storm,” allows the innate immune system (i.e., macrophages and neutrophils) to communicate with the
body’s adaptive immune system.127,128 This overstimulation also causes a significant upregulation of the expression of iNOS129-131 and certain cell surface markers (e.g., CD80 and CD86), which permit juxtacrine signaling between phagocytes and T cells.132,133
Cell death is another major hallmark of sepsis, including both necrosis and apoptosis. Necrosis, which usually occurs following an ischemic injury and results in slow death due to
Figure 1.3 Changes in immune response during the progression of sepsis in human patients. Adapted from Hotchkiss et al.136
Time%(days)%
Immune% Suppression%%
(CARS)% Immune%
Ac7va7on% (SIRS)%
Pro:inflammatory% response%
An7:inflammatory% response%
is a normal part of cellular proliferation, but occurs to an extreme and detrimental extent during sepsis. Of note, apoptosis is more pronounced in lymphocytes and gastrointestinal epithelial cells during sepsis.137,138 Lymphocyte death is linked to the CARS that is observed
in later stages of sepsis.139,140 Under normal circumstances, the intestine has an unusually high cell turnover rate, making it particularly sensitive to changes in apoptosis.141 In contrast
to this increased cell death, neutrophils often undergo delayed apoptosis during sepsis, leading to further damage to tissue by the release of toxic antimicrobial products.142
1.4.2 Clinical manifestations of sepsis
These phenotypic and chemical changes at the cellular level manifest a number of systemic physiological changes that may be monitored in the hospital setting. As provided in
Table 1.3, physicians consider a set of symptoms that define sepsis within a spectrum of disorders. In addition to these basic physiological metrics, a number of potential biomarkers for sepsis have been proposed for diagnostic and/or prognostic use. Due to the shear number
of physiological processes involved in sepsis and its systemic nature, the quantity of biomarkers that have been evaluated to date is immense, with at least 178 independent
biomarkers since 2010 alone.143 Most biomarkers have been tested for their prognostic ability, but of greater importance may be the ability to improve the diagnosis of sepsis, as early and appropriate treatment is known to improve patient outcomes.144-147 The most
commonly studied categories of biomarkers include cytokines/chemokines and acute phase proteins. A number of cells (most notably immune cells) release cytokines and chemokines in
examined to monitor the immunosuppressive phase of sepsis.170 While clinical and experimental studies have revealed that these biomarkers are elevated in sepsis and may predict survival,171 they are neither sensitive nor specific enough to be clinically useful.
Acute phase proteins such as C-reactive protein may aid in predicting a patient’s response to therapy, but serve no diagnostic value.172-174 Other categories of molecules that have been
studied for their diagnostic and/or prognostic value include cell surface markers, coagulation biomarkers, vasodilation biomarkers, organ dysfunction biomarkers, vascular endothelial damage biomarkers, and receptor biomarkers.143 However, no one biomarker to date has
proven both sensitive and specific enough to become routinely implemented in sepsis monitoring. Future approaches must include the evaluation of new potential biomarkers as
well as multi-biomarker panels for more accurate diagnosis.170
1.4.3 Nitric oxide and nitrosothiols as prognostic/diagnostic biomarkers
Due to the well-established roles of NO in the immune system and inflammation, as
well as its role in blood pressure maintenance, many have hypothesized that endogenous NO levels may become erratic during the development and progression of sepsis. For example,
multiple studies have indicated increases in iNOS during progression of sepsis.129,131,175,176 Regulation of iNOS has been examined to determine whether its up- or down-regulation may be beneficial for the treatment of sepsis, but the results have been mixed. For example, some
findings have indicated that inhibition of iNOS provides a protective effect and thus improves outcomes.177-179 In contrast, others have reported that NO scavenging or iNOS
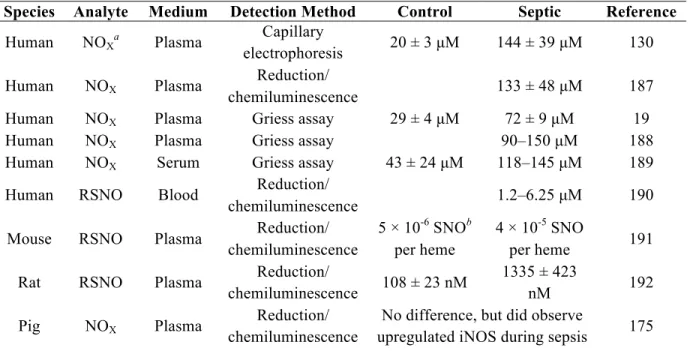
number of studies have examined changes in metabolites of NO (i.e., nitrate, nitrite, and nitrosothiols) more directly during sepsis in humans and other animal species, most frequently utilizing chemiluminescence and colorimetric detection methods. The results of
select studies have been summarized in Table 1.4. While the reported concentrations vary widely, an increase in endogenous NO relative to controls was observed in almost all cases.
One notable exception was reported by Jacob et al., who observed a decrease in plasma nitrate/nitrite levels in patients with trauma and infection relative to control (no trauma or infection) patients.182 Despite this trend, an increase was observed relative to patients with
trauma but without infection. The ability to measure NO and nitrosothiols directly in whole blood and/or plasma would provide a clearer understanding of the mechanisms involved in
this immune dysfunction. 1.4.4 Animal models of sepsis
Outcomes for sepsis may only be further improved through advancements in
understanding mechanisms of disease pathophysiology and the development of new therapeutics. Well-controlled and reproducible studies to achieve such an outcome are only
possible through the use of animal models.183 Preclinical (i.e., animal) studies are especially necessary for testing of potential therapeutic agents prior to human clinical trials. The main concern in planning such studies is that the model accurately replicates the complex
physiological state of human sepsis, in which the inflammatory response develops over days and leads to multi-organ failure when not treated promptly.
Table 1.4 Summary of reported changes in NO and its metabolites during sepsis.
Species Analyte Medium Detection Method Control Septic Reference
Human NOXa Plasma electrophoresis Capillary 20 ± 3 µM 144 ± 39 µM 130
Human NOX Plasma Reduction/
chemiluminescence 133 ± 48 µM 187
Human NOX Plasma Griess assay 29 ± 4 µM 72 ± 9 µM 19
Human NOX Plasma Griess assay 90–150 µM 188
Human NOX Serum Griess assay 43 ± 24 µM 118–145 µM 189
Human RSNO Blood Reduction/
chemiluminescence 1.2–6.25 µM 190
Mouse RSNO Plasma Reduction/
chemiluminescence
5 × 10⁻⁶ SNOb per heme
4 × 10⁻⁵ SNO
per heme 191
Rat RSNO Plasma Reduction/
chemiluminescence 108 ± 23 nM
1335 ± 423
nM 192
Pig NOX Plasma Reduction/
chemiluminescence
No difference, but did observe
upregulated iNOS during sepsis 175
a NO
X refers to byproducts of NO oxidation, nitrate and nitrite.
with humans. These species also allow for clinical monitoring (e.g., heart rate, cardiac output, blood gasses) that is similar to an intensive care unit setting. Despite these advantages, the use of large animals are often cost prohibitive. As such, their use in studying
sepsis is less prevalent than rodent models (i.e., mice and rats). Unlike other models for sepsis, rodent models afford the ability to study disease mechanisms in greater detail,
especially with the use of genetically engineered knockouts. Due to low total blood volumes (~2 mL in mice) however, serial sampling in a mouse is not possible without the induction of hypovolemic shock.185 Of note, each of these species has a varied timeframe for sepsis
development and mortality, as well as differing sensitivities to bacteria and endotoxin.185 Another important consideration in terms of relevance of this model is animal age. While
most human patients who develop sepsis are >65 years of age,193 animals used for modeling sepsis and other diseases are generally juvenile, leading to significantly decreased mortality.194,195
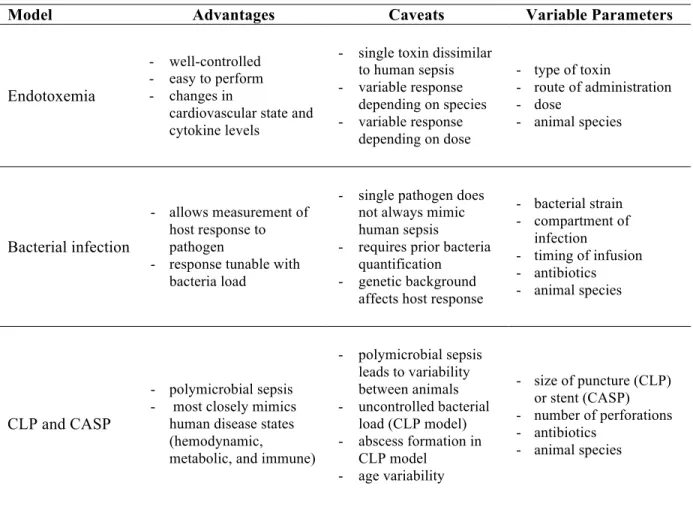
Once the appropriate species has been chosen, one must consider the means of inducing sepsis. Three main categories of sepsis models exist: administration of a toxin (e.g.,
lipopolysaccharide), administration of a viable pathogen (e.g., bacteria), and surgical alteration of a protective barrier (e.g., bowel perforation). Each method has its own distinct advantages and caveats, as outlined in Table 1.5. Direct administration of live bacteria is
another means of inducing sepsis in animal models that can be useful for studying specific mechanisms of host response to infection by particular bacteria. The two main routes of
Table 1.5 Advantages and caveats of various animal models of sepsis. Adapted from Buras et al.196 and Zanotti-Cavazzoni et al.185
Model Advantages Caveats Variable Parameters
Endotoxemia
- well-controlled - easy to perform - changes in
cardiovascular state and cytokine levels
- single toxin dissimilar to human sepsis - variable response
depending on species - variable response
depending on dose
- type of toxin
- route of administration - dose
- animal species
Bacterial infection
- allows measurement of host response to pathogen
- response tunable with bacteria load
- single pathogen does not always mimic human sepsis
- requires prior bacteria quantification - genetic background
affects host response
- bacterial strain - compartment of
infection
- timing of infusion - antibiotics - animal species
CLP and CASP
- polymicrobial sepsis - most closely mimics
human disease states (hemodynamic,
metabolic, and immune)
- polymicrobial sepsis leads to variability between animals - uncontrolled bacterial
load (CLP model) - abscess formation in
CLP model - age variability
- size of puncture (CLP) or stent (CASP) - number of perforations - antibiotics
- animal species