Advance Access publication 2017 January 13
The remarkable outburst of the highly evolved post-period-minimum
dwarf nova SSS J122221.7
−
311525
V. V. Neustroev,
1,2†
T. R. Marsh,
3S. V. Zharikov,
4C. Knigge,
5E. Kuulkers,
6J. P. Osborne,
7K. L. Page,
7D. Steeghs,
3V. F. Suleimanov,
8G. Tovmassian,
4E. Breedt,
3A. Frebel,
9Ma. T. Garc´ıa-D´ıaz,
4F.-J. Hambsch,
10,11H. Jacobson,
9S. G. Parsons,
12T. Ryu,
13,14L. Sabin,
4G. Sjoberg,
11,15A. S. Miroshnichenko,
16D. E. Reichart,
17J. B. Haislip,
17K. M. Ivarsen,
17A. P. LaCluyze
17and J. P. Moore
171Finnish Centre for Astronomy with ESO (FINCA), University of Turku, V¨ais¨al¨antie 20, FI-21500 Piikki¨o, Finland
2Astronomy research unit, PO Box 3000, FI-90014 University of Oulu, Finland
3Department of Physics, University of Warwick, Gibbet Hill Road, Coventry CV4 7AL, UK
4Instituto de Astronomia, Universidad Nacional Autonoma de Mexico, Apdo. Postal 877, Ensenada, Baja California, 22800 Mexico
5School of Physics and Astronomy, University of Southampton, Southampton SO17 1BJ, UK
6European Space Astronomy Centre (ESA/ESAC), Science Operations Department, 28691 Villanueva de la Ca˜nada, Madrid, Spain
7Department of Physics & Astronomy, University of Leicester, University Rd, Leicester LE1 7RH, UK 8Institut f¨ur Astronomie und Astrophysik, Universit¨at T¨ubingen, Sand 1, D-72076 T¨ubingen, Germany
9Department of Physics and Kavli Institute for Astrophysics and Space Research, Massachusetts Institute of Technology, Cambridge, MA 02139, USA
10Vereniging voor Sterrenkunde, Oude Bleken 12, B-2400 Mol, Belgium
11American Association of Variable Star Observers, 49 Bay State Road, Cambridge, MA 02138, USA
12Departmento de F´ısica y Astronom´ıa, Universidad de Valpara´ıso, Avenida Gran Bretana 1111, Valpara´ıso, 2360102, Chile
13SOKENDAI, The Graduate University for Advanced Studies, 2-21-1 Osawa, Mitaka, Tokyo 181-8588, Japan
14National Astronomical Observatory of Japan, 2-21-1 Osawa, Mitaka, Tokyo 181-8588, Japan
15The George-Elma Observatory, New Mexico Skies, 9 Contentment Crest, #182, Mayhill, NM 88339, USA
16University of North Carolina at Greensboro, Greensboro, NC 27402, USA
17Department of Physics and Astronomy, University of North Carolina, Chapel Hill, NC 27599, USA
Accepted 2017 January 11. Received 2016 December 23; in original form 2016 May 29
A B S T R A C T
We report extensive 3-yr multiwavelength observations of the WZ Sge-type dwarf nova SSS J122221.7−311525 during its unusual double superoutburst, the following decline and in quiescence. The second segment of the superoutburst had a long duration of 33 d and a very gentle decline with a rate of 0.02 mag d−1, and it displayed an extended post-outburst decline lasting at least 500 d. Simultaneously with the start of the rapid fading from the superoutburst plateau, the system showed the appearance of a strong near-infrared excess resulting in very red colours, which reached extreme values (B−I1.4) about 20 d later. The colours then became bluer again, but it took at least 250 d to acquire a stable level. Superhumps were clearly visible in the light curve from our very first time-resolved observations until at least 420 d after the rapid fading from the superoutburst. The spectroscopic and photometric data revealed an orbital period of 109.80 min and a fractional superhump period excess0.8 per cent, indicating a very low mass ratioq 0.045. With such a small mass ratio the donor mass should be below the hydrogen-burning minimum mass limit. The observed infrared flux in quiescence is indeed much lower than is expected from a cataclysmic variable with a near-main-sequence donor star. This strongly suggests a brown-dwarf-like nature for the donor and that SSS J122221.7−311525 has already evolved away from the period minimum towards longer periods, with the donor now extremely dim.
Key words: binaries: close – stars: evolution – stars: individual: SSS J122221.7−311525 – novae, cataclysmic variables.
This paper includes data gathered with the 6.5 m Magellan Telescopes located at Las Campanas Observatory, Chile.
†E-mail:[email protected]
1 I N T R O D U C T I O N
In the accreting white dwarf (WD) systems known as cataclysmic variable stars (CVs – for a comprehensive review, see Warner1995), accretion is the dominant factor in their discovery through line emission and outbursts. The donor components in CVs are low-mass main-sequence stars or brown dwarfs which lose matter via the inner Lagrangian point. In the absence of a strong magnetic field, the material transferred from the donor star forms an accre-tion disc around the WD. Dwarf novae are an important subset of CVs with relatively low mass-transfer rates, the discs of which can suffer thermal instabilities, resulting in outbursts for which CVs are named (for review of the disc-instability model see e.g. Cannizzo 1993; Osaki1996; Lasota 2001). The recurrence time of the outbursts is usually weeks or a few months and their am-plitude is mostly less than 6 mag. However, the outbursts in dif-ferent dwarf novae have difdif-ferent amplitudes, light-curve shapes, durations and recurrence times. Based on the variety of these pa-rameters, a few sub-types have been assigned to the dwarf nova class.
SU UMa-type dwarf novae have short orbital periods, usually be-low the 2–3 h CV period gap, and show two types of outbursts: short (normal) outbursts lasting a few days, and less frequent superout-bursts which have a slightly larger amplitude and a longer duration of about two weeks. At the short period end of the CV orbital period distribution, accretion rates are low, and some systems only outburst once every several years or even decades. Such systems compose an extreme subgroup of the SU UMa-type dwarf novae, called WZ Sge-type stars (for a modern and comprehensive review of the WZ Sge-type objects, see Kato2015). Their other peculiar properties are very large superoutburst amplitudes exceeding 6 mag and the lack or great rarity of normal outbursts.
A unique property of superoutbursts is the appearance of super-humps, low-amplitude modulations with a period of a few per cent longer than the orbital one. The superhump phenomenon is well explained by the tidal instability of the accretion disc (Vogt1982; Whitehurst1988; Osaki1989). This instability grows when a disc expands beyond the 3:1 resonance radius that causes the disc to become quasi-elliptical and precess, initiating superhumps. The pe-riod of superhumpsPshis known to depend on the orbital period Porband the mass ratioq=M2/Mwd, whereM2andMwd are the
masses of the donor and WD, respectively. An empirical Psh–q
relation (see e.g. Patterson et al.2005) is an important tool to es-timateqwithout the recourse to spectroscopy. In particular, it was shown that the distribution of the mass ratios of the donor and WD in WZ Sge-type stars shows a sharp peak between 0.07 and 0.08 (Kato2015).
The CVs with such small mass ratios are of a special interest be-cause a significant number of ‘period bouncers’ should be present among them. According to standard evolutionary theory, CVs evolve from longer to shorter orbital periods until a minimum period is reached (≈80 min), when the donor star becomes of a substellar mass and partially degenerate, resulting in a kind of a brown-dwarf-like object. Systems that have passed beyondPminare evolving back
towards longer periods (see Kolb1993; Howell, Rappaport & Poli-tano1997; G¨ansicke et al.2009; Knigge, Baraffe & Patterson2011, and references therein). This has long been predicted to be the ‘graveyard’ and current state of 70 per cent of all CVs (Kolb1993), however only about a dozen more or less robust candidates for such period bouncer systems have been identified until now, out of about 1000 of known CVs (for a fairly recent compilation see Patterson2011).
One such system, called SSS J122221.7−3115251(hereafter SSS
J122222), was discovered on 2013 January 1 atV=12.3 by the Catalina Real Time Survey (CRTS; Drake et al.2013), and was subsequently found to have been in outburst by 2012 December 16 (with unfiltered CCD magnitude 11.8; Levato et al.2013). The large outburst amplitude (the average quiescent magnitude of the counterpart was found to be≈19; Drake et al.2013), the appearance of its optical spectrum (Marsh et al.2013) and the detection of an ‘S-wave’ sinusoidal component in the emission lines with a period of about 80 to 95 min allowed Kuulkers et al. (2013) to propose the WZ Sge-type dwarf nova classification for SSS J122222. Kato et al. (2013) discussed some of the outburst properties of SSS J122222, studied the superhump period changes in the system and found that SSS J122222 has a very small mass ratio,q < 0.05. They also concluded that the relatively long orbital periodPorb (which was
not known, but should be close to the average superhump period of∼111 min) and lowqmake this object a perfect candidate for a period bouncer. The confirmation of the period bouncer status would be of great importance due to the long orbital period of SSS J122222, which would make this binary the most evolved CV (Knigge et al.2011).
For more than three years we have been performing extensive X-ray–ultraviolet (UV)–optical–near-infrared (NIR) photometric and spectroscopic observations of SSS J122222. The observations were taken from 2013 January 5 (four days after the discovery) until 2016 April 17, during the superoutburst, the following decline and in quiescence. These data provide crucial insights into the proper-ties of SSS J122222. We found that a number of observed features are quite unusual when compared with other WZ Sge-type systems. Although most of these features are not completely unique, their union in one object makes SSS J122222 a remarkable case of the WZ-Sge-type system. Our unprecedentedly detailed, multiwave-lengths observations allow us to shed more light on mechanisms underlying the system’s extraordinary properties. In this paper, we concentrate on the long-term evolution of the binary as revealed by the UV–optical–NIR data.
2 O B S E RVAT I O N S
During our observing campaign we used many ground- and space-based telescopes equipped with different instruments. All details on the observations and data reduction can be found in Appendix A. Here we describe shortly the data used in our analysis.
Our optical time-resolved photometric observations started on 2013 January 8,∼7 d after the discovery announcement by CRTS (Drake et al.2013). From then on, the observations were conducted almost every clear night until 2013 April 21. After a short interrup-tion, the observations were resumed on 2013 May 4 and continued until 2013 June 18, the end of visibility of the source. Thus, about 100 nights of time-resolved photometric data were taken during this interval. We restarted the observations on 2014 January 13, when the star became visible again, and finished on 2014 June 28. A total of 35 nights of data were obtained during 2014. In the beginning of 2015 we obtained seven additional sets of time-resolved data. In January–April of 2016 we took several single-shot observations. The final observation was taken on 2016 April 17. The observations were taken with a 0.40-m f/6.8 Optimized Dall Kirkham (ODK) telescope of the Remote Observatory Atacama Desert (ROAD) in
1Also known as SSS130101:122222−311525, 1RXS J122221.5−311545
Table 1. The averaged magnitudes of SSS J122222 on 2013 February 5 (the plateau stage of the superoutburst) and on 2016 April 7–17 (quiescence). The superoutburstUmagnitude is given in the Bessel filter, whereas for the quiescent state we show theSwift umagnitude.
State uvw2 uvm2 uvw1 u/U B V Rc Ic J H Ks
Superoutburst 11.08(5) 11.91(5) 12.65(4) 12.69(3) 12.68(3) 12.77(4)
Quiescence 17.65(8) 17.53(9) 17.57(7) 17.97(7) 19.05(5) 19.00(5) 18.72(5) 18.76(5) 18.47(5) 18.31(7) 17.77(23)
Chile, a 0.35-m Celestron C14 robotic telescope at New Mexico Skies in Mayhill, New Mexico, two 0.4-m robotic PROMPT tele-scopes located in Chile (Reichart et al.2005), and with the 0.84-m telescope at the Observatorio Astron´omico Nacional at San Pedro M´artir (OAN SPM) in Mexico. A significant part of our photomet-ric data was taken with Johnson–CousinsBV(RI)Cfilters, and other
observations were performed with theVorRfilters, or unfiltered. TableA2provides the journal of these observations.
On 2016 April 7 we conducted a near-infrared observation using the Infrared Survey Facility (IRSF) at Sutherland, South Africa. The IRSF consists of a 1.4 m telescope and Simultaneous Infrared Im-ager for Unbiased Survey (SIRIUS: Nagayama et al.2003), which can obtainJ,HandKs-band images simultaneously.
The optical spectroscopic observations of SSS J122222 were performed on 16 nights between 2013 January 5 and 2013 May 5. Additional observations were taken on 2015 May 5, and on 2016 February 9 and 10. The spectra were obtained with the 4.2-m William Herschel Telescope on La Palma, the 2.1-m telescope at the OAN SPM, the 6.5-m Magellan Clay Telescope at Las Campanas Observatory near La Serena in Chile, and with the VLT-UT1 and VLT-UT2 telescopes at Paranal Observatory, Chile. Spectra were obtained in both single-shot and time-resolved manner with differ-ent instrumdiffer-ental setups and exposure times. TableA4provides the journal of the optical spectroscopic observations.
TheSwiftX-ray satellite (Gehrels et al.2004) started observing SSS J122222 on 2013 January 6, 5.8 d after the discovery an-nouncement (Kuulkers et al.2013). For each observation, data were collected using both the X-ray Telescope (XRT; Burrows et al.2005) and the UV/Optical Telescope (UVOT; Roming et al.2005) with the uvm2 filter in position. In this paper we present only the UV/Optical part of the observations. The observations were obtained approxi-mately every 1–3 d until 2013 July 1. Two additional observations were performed on 2014 June 26 and 2015 January 16. A final data set was collected on 2016 April 17. This UVOT observation was carried out in all six available filters.
In Section 3.1 we show that SSS J122222 had returned to qui-escence in the beginning of 2015. In Table1we summarize the averaged magnitudes of SSS J122222 in all the available filters, obtained on 2016 April 7–17 (quiescence) and on 2013 February 5 (the superoutburst).
3 O P T I C A L A N D U V P H OT O M E T RY
3.1 Long-term light curve and the colour evolution
Throughout the paper, we will denote time in units of days since 2013 January 8, when we began our time-resolved photometric observations. Thus,T=0 corresponds to HJD 245 6300.0.
Fig.1shows the light curves of SSS J122222 containing all our observations in the optical and UV filters taken over about three years. In the inset of this figure we also show the overall light curve which includes the pre-outburst 1-d averaged data from the
Catalina Real-time Transient Survey (CRTS) observations2(Drake
et al. 2009) begun 10 years ago from 2005 August 5. The pre-outburst data reveal a half-magnitude variability between ∼18.5 and∼19 mag on few years’ time-scale, but show no indication of previous outbursts.
The most notable feature of the superoutburst is its unusual dou-ble structure and long duration (Fig. 2). Unfortunately, the first segment of the superoutburst was scarcely observed. The most re-cent observations prior to the superoutburst were obtained on 2012 August 13 (T= −147), when the system was atV∼ 18.3. The earliest observations of SSS J122222 in outburst were obtained on T= −22 (∼11.8 mag; Levato et al.2013). Subsequent photometry showed that the object had still been near maximum light until at leastT= −5.8 (V=12.3; Drake et al.2013), after that SSS J122222 had faded to magnitude∼15.5 onT= −2.4 and∼16 onT= −1.5. Thus, the duration of the superoutburst’s first segment was at least 16 d.
When fading, the transient did not reach its quiescent level, and rebrightened again onT=3, entering the second segment of the su-peroutburst (Neustroev & Sjoberg2013). We began our photometric observations onT=0, near the minimum light of this temporary fading stage (V=16.8). During the rise the optical flux increased at a rate of ∼2.8 mag d−1. The outburst’s second segment had
reached the maximum ofV=12.2 onT=7. After a short ‘dip’ by
∼0.4 mag exhibited duringT=9–10, SSS J122222 reached another local maximum ofV=12.3 onT=13 and then monotonically faded very slowly. OnT=37 we observed a rapid fading with a rate of 1.31±0.01 mag d−1, followed by a slow decline. Thus, the duration
of the second segment of the superoutburst was about 33 d. We note that though the peculiar pattern of the light curve of SSS J122222 is not unprecedented and similar double superoutbursts have been seen in a few other CVs (e.g. OT J184228.1+483742, see fig. 1 in Kato et al.2013) and transient low-mass X-ray binaries (e.g. XTE J1118+480, Kuulkers2001), yet the superoutburst of SSS J122222 was the longest of any other known dwarf novae. During 33 d of the second segment of the superoutburst SSS J122222 faded by only∼0.7 mag. The average fading rate duringT =13–20 was just 0.006±0.001 mag d−1, after that it increased to 0.032±0.001
mag d−1(T=20–35). Such a slow, gradual decline is atypical for
SU UMa stars, whose plateau slope is usually about 0.11±0.01 mag d−1(Warner1995). See Section 6.1 for further discussion of
atypical properties of the light curve.
The shoulder in the beginning of the second segment of the super-outburst resembles a so-called precursor super-outburst, a normal super-outburst which is often observed shortly before the superoutburst (Marino & Walker1979), and which is thought to trigger it (Osaki1989; Osaki & Kato 2013). We note, however, that in contrast to SSS J122222, the maximum light of precursors is usually lower by 0.5– 1 mag than that of the following superoutbursts (see e.g. the very detailed high-fidelityKeplerlight curves of several superoutbursts of two SU UMa stars; Cannizzo et al. 2012), thus the origin of
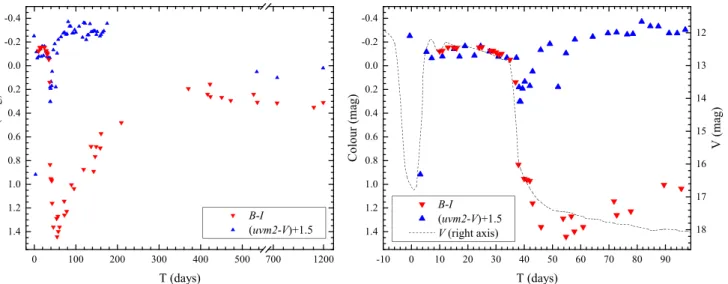
Figure 1. The light curve of the superoutburst of SSS J122222 in all the available optical and UV filters. Each point is the 1-d average of observations in the corresponding filter. Short vertical lines mark epochs of optical spectra. In the inset the overall light curve is shown which includes the pre-outburst 1-d averaged data from the CRTS observations (the open squares).Tis the number of days elapsed since HJD 245 6300.0.
Figure 2. A superoutburst segment of the light curve in theVanduvm2 filters. Black points are the individual observations in theVfilter. The triangles represent the optical data taken from the literature and other sources. Blue/yellow symbols are the observations in theuvm2 filter, shifted by 1.8 mag for clarity. Short vertical lines mark epochs of optical spectra. The different stages of the superoutburst are indicated. The red vertical ribbon marks the days of the reddest optical spectra. In the inset the rise and the shoulder in the beginning of the second segment of the outburst are shown.
Figure 4. TheVandIphotometry during the decline stage of the superout-burst, plotted with a logarithmic time-scale. The days are counted from the beginning of the rapid fading phase atT=36.4.
the shoulder in SSS J122222 might be different from that of the precursors discussed above.
The shapes of the optical and UV light curves are qualitatively similar. In particular, the data do not show any apparent signs of a UV-delay in the early rising phase of the second segment of the superoutburst.3 Note, however, that at the very beginning
of the optical rise the UV flux showed a drop by∼0.25 mag (see the inset in Fig.2). We do not have simultaneous optical photom-etry which would enable us to verify such a behaviour, although the detailedKeplerobservations of many CV superoutbursts (e.g. Cannizzo et al.2012) do not seem to show such drops at opti-cal wavelengths. On the other hand, the drops of the UV flux in the beginning of outbursts were reported for several DNe (Wu & Panek1983; Verbunt 1987). They, however, were different in the sense that they occurred after an initial rise, and after the drop the rise resumed. In SSS J122222 this UV drop occurred before the rise.
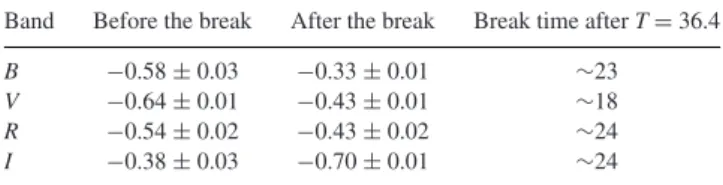
Fig.1displays an apparent difference in the post-outburst be-haviour of the transient in different wavelengths. The magnitude of the decline during the rapid fading phase decreases greatly towards longer wavelengths, resulting in strong colour evolution (Fig.3). Fig.4shows the optical photometry during and after the rapid fad-ing phase, plotted with a logarithmic time-scale. For clarity, we show only theVandIlight curves, but theBandRlook similar. We found that all the light curves are well described by a broken power law as a function of time, with the time origin being atT=36.4 and a slope-break some 20 d later. The power-law indices of the decline are given in Table2. It is unclear how common is such a (broken) power-law decline among CVs and LMXBs, because we found no papers, either observational or theoretical, reporting on it.
3A UV-delay, a lag as long as one day between the rise to outburst in
the optical flux and the rise in UV, is observed in some dwarf novae (see Verbunt1987and Warner1995, and references therein), the cause of which is still not fully understood. We note, however, that the observed rise in SSS J122222 had occurred after the temporary fading stage, from the level of about 2 mag brighter than that in quiescence. Thus, it is not clear if the discussion of the existence or non-existence of the UV-delay in such conditions is relevant.
Table 2. The law indices (columns 2 and 3) of the broken power-law decline of SSS J122222 in theB,V,RandIbands (in flux units), and the number of days (column 4) elapsed between the beginning of the rapid fading phase atT=36.4 and the slope-break.
Band Before the break After the break Break time afterT=36.4 B −0.58±0.03 −0.33±0.01 ∼23
V −0.64±0.01 −0.43±0.01 ∼18 R −0.54±0.02 −0.43±0.02 ∼24 I −0.38±0.03 −0.70±0.01 ∼24
From Fig.4it is also clearly seen that SSS J122222 has not fully recovered from the outburst even 500 d after the rapid fading phase because it was still fading with the same rate. Only our observations obtained on and afterT=736 revealed that the data do not follow the decline trend anymore, confirming that the transient had finally returned to quiescence. The following observations showed nearly constant magnitudes. Thus, the total amplitude of the outburst was
∼7 mag and its post-outburst decline lasted no less than 500 d. During the superoutburst the colour indices4demonstrated
dra-matic changes with time, and the colour curve has an extraordinary shape (Fig.3), never observed before in such detail. At the super-outburst plateau the optical colour indices varied slowly around 0, their average values were quite usual for a dwarf nova in outburst (Warner1995):B–V= −0.04±0.01,V–R=0.00±0.01,R–I=
−0.09±0.01. With the start of the decline, the object had begun reddening. The colour indices reached the extreme values some 20 d later, around the time of the slope-break of the broken power-law decline, atT54–58:B–V=0.32±0.05,V–R=0.48±0.03, R–I=0.55±0.03. These colours are redder than in most dwarf novae in quiescence (Echevarria1984; Echevarria & Jones1984; Kato, Maehara & Uemura 2012). The colours then turned back to becoming bluer. This trend continued for several hundred days. Only the data obtained afterT∼472 revealed nearly stable, rela-tively blue colours:B–V=0.06±0.05,V–R=0.30±0.03,R–I=
−0.07±0.10. Although they are not so atypical for WZ Sge-type dwarf novae (Kato et al.2012), the colours are significantly bluer than in many of them in quiescence (compare e.g.B–I=0.43 in SSS J122222 andB–I=0.75 in V455 And; Neustroev et al.2013). The reddening of optical light after the superoutburst has been previously detected in several WZ Sge-type stars (Kato2015). For example, a similarly strong cool continuum source was reported for EG Cnc by Patterson et al. (1998), which also showed the red colours (B–I1.4). However, multicolour observations after the active stage of superoutbursts are rare and sporadic, and no detailed study of the above phenomenon has ever been presented.
In contrast to the optical wavelengths, the UV data showed redder colours at the superoutburst plateau, and bluer during the post-outburst stage (Fig.3). However, the data obtained after the long gap in our observations (afterT∼535) show that in quiescence the uvm2-Vindex dropped again to the level even lower than during the plateau, reaching a nearly stable value of−1.44±0.10 mag. We also note three red jumps in theuvm2-Vcurve (see the right-hand panel of Fig.3). Besides the one in the beginning of the rise, mentioned above, another reddening episode had begun immediately after the beginning of the rapid fading phase, almost simultaneously with the optical colours (but possibly after a short delay). However,uvm2-V reached the maximum value in less than a day and returned to the
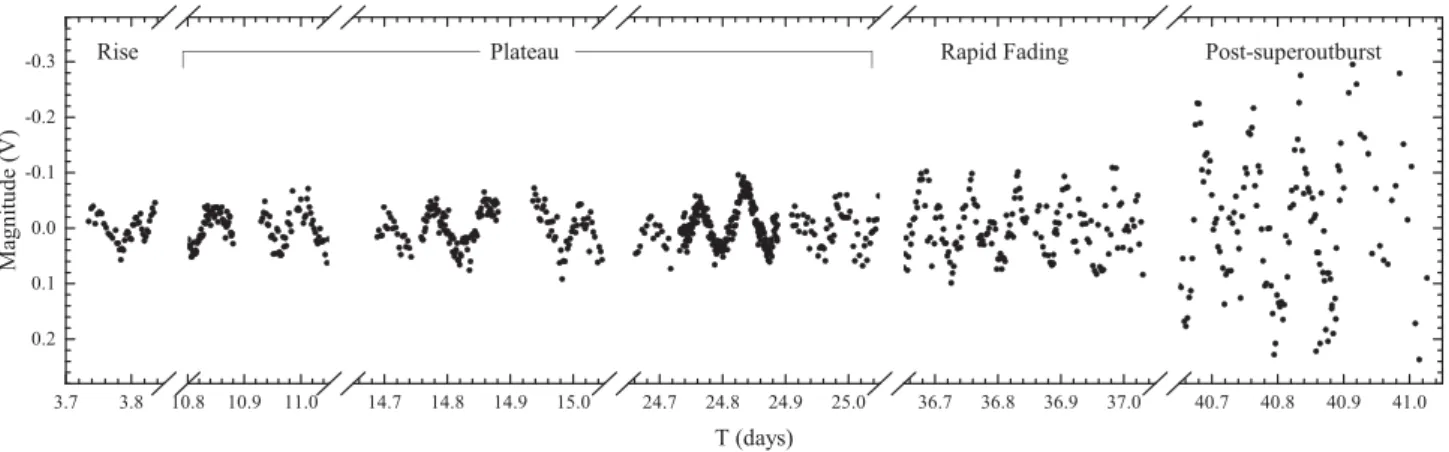
Figure 5. Six light-curve samples from different stages of the superoutburst of SSS J122222 (with the means and linear trends subtracted for each night).
superoutburst level in a week. OnT52–55, the days of the reddest optical spectrum, the UV flux dropped again, producing another red jump in theuvm2-Vcurve.
3.2 Development of superhumps
3.2.1 Superoutburst superhumps
Photometric modulations, known as superhumps, are clearly visible in the light curve of SSS J122222 from our very first time-resolved observations. Fig.5shows six light-curve samples which illustrate the development of superhumps during the superoutburst stage. It is known that the period of superhumpsPsh in SU UMa stars is
not stable, but changes during a superoutburst in a complex way. An extensive study of SU UMa superhumps showed that the evo-lution of their periods is often composed of three distinct stages (see Kato et al.2009, and their later papers). These complex period changes can be explained by variation of the accretion disc radius during a superoutburst (Hirose & Osaki1990), which is possibly accompanied by variable gas pressure effects in the disc (Osaki & Kato2013). The evolution of the superhump period in SSS J122222 has been investigated by Kato et al. (2013). Here we extend their analysis. In order to examine the evolution of superhumps, we de-termined the times of superhump minima and their amplitudes by fitting a sine wave to nightly light curves. The resultant O–C dia-gram and the superhump amplitudes are shown in the middle and top panels of Fig.6, respectively.
Although the superhump period in SSS J122222 evolved rather differently to other SU UMa dwarf novae (see Kato et al.2013for a discussion of possible causes), nevertheless our analysis confirmed that the superhumps experienced three stages of their evolution as seen from the O–C diagram. The latter shows three distinct seg-ments, which we identified and marked in Fig.6as stages A, B and post-superoutburst, following Kato et al. (2013). Fig.7shows the Lomb–Scargle periodograms calculated for different time inter-vals. The linear rise of the stage A segment of the O–C diagram (untilT∼20) indicates an approximately constant period. The su-perhump amplitudes grew from∼0.04 mag at the beginning of the stage to∼0.07 mag at its end. Using the data forT =4–14 and 15–21, we determined the periods of superhumps for these dates to be 111.26(4) and 110.64(6) min, respectively. The periods and their errors were computed using a linear fit to the corresponding segment of the O–C diagram. During the following∼18 d (21T
38) of stage B the superhumps also had a nearly stable, but shorter period of 110.10(2) min determined using the data forT=23–34.
Figure 6. Top: the amplitudes of superhumps in SSS J122222. Middle: the O–C diagram of superhumps. A period of 110.09 min was used for the calculations. Bottom: theVlight curve. The red vertical ribbon marks the days of the reddest optical spectra. The stages of the superhump evolution are marked following Kato et al. (2013).
Figure 7. Lomb–Scargle periodograms of theVdata combined amongT=4–14, 15–21, 23–34 and 39–51. The inset shows the enlarged region around the frequency 13.08 cycle d−1– the averaged frequency of superhumps during the superoutburst stage B, marked by the vertical dashed line.
Figure 8. Variation of superhump profiles during the superoutburst of SSS J122222.
the superoutburst is shown in Fig.8. Most of the time the modu-lations had a nearly symmetric, sinusoidal profile, although there were several occasions when the superhump profiles transformed from single-humped to double-humped and back.
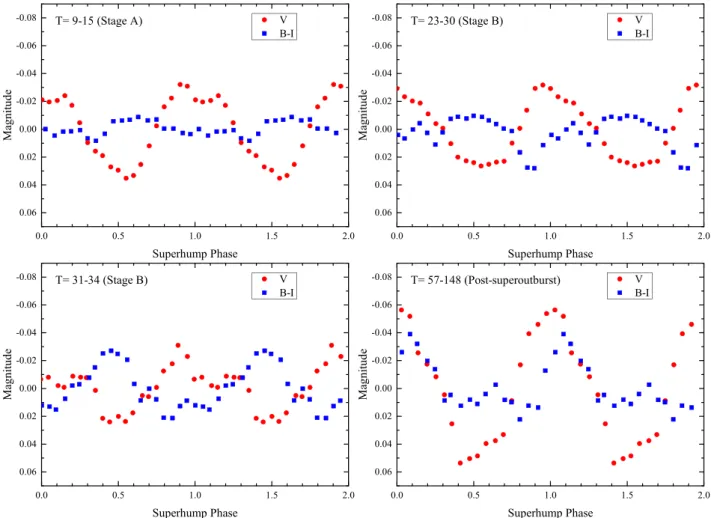
Our multicolour photometry shows that the superhumps were redder at their light maximum (Fig.9). Such a behaviour is in gen-eral agreement with previous reports (Schoembs & Vogt1980; Has-sall1985; Isogai et al.2015). This can be explained by assuming that the superhump light source (SLS) is an expanded low-temperature area in outer regions of the accretion disc (see e.g. Warner1995;
Figure 9. Phase-averagedVlight curves andB–Icolour variations of superhumps at different stages of the superoutburst of SSS J122222.
3.2.2 Post-superoutburst modulations
A visual inspection of the data revealed the presence of persistent modulations in the light curve long after the superoutburst. We show below that a period of these modulations is longer than that of the stage B superhumps, thus also implying their superhump nature. We traced them until the end of our time series observations in 2015. In order to explore these modulations, we first studied the observations obtained in 2013 after the rapid fading phase. We divided this light curve into short pieces of a 3–6 d duration and analysed them separately. We found that since at least T = 53 the modulation had a very stable period. The Lomb–Scargle periodogram of theVdata combined betweenT=53 and 148 shows a very narrow and strong peak at 13.0261 cycle d−1(Fig.10,
left-hand panel). Folding short subsets at the period 110.547 min results in modulations of similar amplitude which are all in phase with each other (Fig.10, right-hand panel). The shape of the average profile very much resembles a typical superhump profile (see e.g. fig. 1 in Kato et al.2009). The colour variability of these post-superoutburst superhumps had changed significantly when comparing with the superhumps observed during the outburst stage (Fig.9). The period of these post-superoutburst superhumps is about 0.4 per cent longer than that of the stage B superhumps.
The modulations were still strong in 2014 (T =399–455), al-though during this season they were superposed on a longer-term variability with a time-scale of 8–12 h, which resembles so-called ‘brightenings’ observed in a few other WZ Sge-type systems, i.e. in
V406 Vir (Zharikov et al.2006; Aviles et al.2010). This longer-term variability produces in the power spectrum an excess of power at low frequencies of 2–3 cycle d−1(Fig.11, left-hand panel, the red
spectrum), making it difficult to study the superhump modulations. For this reason, we first detrended each night’s light curve by a second-order polynomial. The Lomb–Scargle periodogram of this detrended data set is dominated by two sharp peaks with frequencies of 12.78 cycle d−1(112.6 min) and its first harmonic, and of 18.72
cycle d−1(76.9 min, Fig.11, left-hand panel, the blue spectrum).
The period of the 112.6 min modulation is∼1.8 per cent longer than the period of the post-superoutburst superhumps observed in 2013. The modulations seemed very stable. Folding short subsets of the 2014 light curve at the 112.6 min period results in profiles of similar amplitude which are all in phase with each other (Fig.11, right-hand panel). The origin of the 18.72 cycle d−1peak in the
power spectrum is unclear.
The most recent time-resolved observations, obtained in 2015 (T=740–763), basically confirmed the photometric behaviour ob-served in 2014. However, the time series analysis may suggest that superhumps were finally replaced by orbital variability. There is a peak in the power spectrum (see the inset in Fig.11, left-hand panel) coinciding with the orbital frequency of 13.112 cycle d−1,
Figure 10. Left: Lomb–Scargle periodogram of theVdata combined betweenT=53 and 148. The inset shows the enlarged region around the frequency 13.026 cycle d−1– the frequency of post-superoutburst modulations observed in 2013. The vertical dashed lines mark the orbital (blue) and stage B superhump
(red) frequencies of 13.11 and 13.08 cycle d−1, respectively. Right: the entire set (large stars) and short subsets (small symbols) of theVdata betweenT=53
and 148, folded according to ephemerisHJDmax=245 6300.0610(3)+0.076 768 87(5)E.
Figure 11. Left: Lomb–Scargle power spectra for optical data of SSS J122222 obtained in 2014 (T=399–455, two upper spectra) and 2015 (T=740–763, a bottom spectrum). The red line represents the spectrum for the original 2014 photometry, whereas the blue and black lines are for the detrended data. The inset shows the enlarged region around the orbital frequency marked by the vertical dashed line. Right: the entire set (large stars) and short subsets (small symbols) of the detrended data, obtained in 2014 and folded with the period of 112.6 min.
Thus, our observations showed that long after the superoutburst SSS J122222 was still exhibiting very stable superhumps, with a pe-riod longer than that of the stage B superhumps. Post-superoutburst superhumps, also called ‘late superhumps’ (Vogt1983), were ob-served in several other WZ Sge-type objects (see Kato, Maehara & Monard2008; Kato2015, and references therein). In SSS J122222, however, they were detectable for significantly longer time than in any other system. In Section 6.2 we discuss these late superhumps in more detail.
3.3 An∼180-min variability
The periodograms of most segments of the light curve of SSS J122222 show an excess of power around frequencies∼6–9 cy-cle d−1with the strongest peak at∼8.0 cycle d−1(180 min, Figs7
and10). This signal was most evident during the outburst stage A. It
then weakened, but was still detectable long after the superoutburst. We note that the global power spectrum in this frequency range is complex, suggesting a lower degree of coherence, though between T=4 and 21 the signal was rather stable. Fig.12shows theVlight curves from the time intervalsT=4–14 and 15–21 folded with the period of 180.48 min and averaged in 20 phase bins.
A period of 180 min is not directly related to superhump or orbital periods of SSS J122222 (Porb=109.80 min; see Section 4.2), which
Figure 12. TheVlight curves from the time intervalsT=4–14 and 15– 21 folded with the period of 180.48 min and averaged in 20 phase bins. The small and large symbols represent the individual observations and the data averaged in 20 phase bins, respectively. All data are plotted twice for continuity.
Tovmassian, Zharikov & Neustroev2007). However, in other ob-jects long-period modulations show a significantly lower degree of coherence (Araujo-Betancor et al.2005; Vican et al.2011), simi-larly to SSS J122222. There is currently no physical explanation for the latter phenomena.
4 O P T I C A L S P E C T R O S C O P Y
4.1 Spectral evolution throughout the superoutburst
Fig.13displays the spectral evolution of SSS J122222 through all the outburst stages and the following decay (the epochs of optical spectra are shown in Fig. 1). Note that during the superoutburst plateau the spectra changed very little, hence we show only the averaged outburst spectrum (T=20–34).
At the temporary fading stage (T = −1 and−2), the spectra exhibit strong, very broad and double-peaked Balmer emission lines and weak emission lines of neutral helium (4471, 5876, 6678 Å). There is also a hint of a broad feature around 4700 Å that can be associated with the Bowen blend, HeIIλ4686 and HeIλ4713.
During the plateau stage (T=20–34) most of the emission lines were replaced by the broad absorption troughs with weak emis-sion cores. Among the Balmer series lines, only Hα was still in emission, even though the broad absorption wings also showed up around the line. The full width at zero intensity (FWZI) of the absorption troughs corresponds to a velocity of ∼6800 km s−1,
which is very close to the fairly extreme width of the emission lines (FWZI∼7000 km s−1) observed during the temporary fading. It
can be explained by the broadening effect of rapid rotation of the innermost parts of the optically thick accretion disc. An interesting feature is that those absorption components are clearly redshifted relative to the emission core, which are seemingly always centred close to the rest wavelength (Fig.14, left-hand panel). By fitting a Gaussian to the absorption component of Hβand Hγin nightly averaged outburst spectra, we found a consistent and steady offset of∼180–200 km s−1from the rest wavelength. At the superoutburst
plateau the CIII/NIII–HeIIcomplex and HeIλ5876 andλ6678 lines
were still in emission. Also, an emission bump centred at∼5830 Å appeared. This bump is probably a blend of C III λ5827 and
the CIVlines atλ5801 and 5812 Å, and possibly of other highly
excited species on the shortward side of HeIλ5876. In addition,
the spectra show the appearance of the sodium D doublet (Na D λ5890/5896) in absorption. These lines are very uncommon for CV spectra. Although the sodium doublet is one of the strongest in-terstellar lines, it is not expected to be seen in the spectra of CVs because of their relatively close proximity. Nonetheless, Na D in absorption was noticed in spectra of several WZ Sge-type systems at different stages of their superoutbursts (Patterson et al.1998; Nogami & Iijima2004; Nogami et al.2009), but it was not seen in other dwarf novae showing large amplitude outbursts (e.g. BZ UMa; Neustroev, Zharikov & Michel2006).
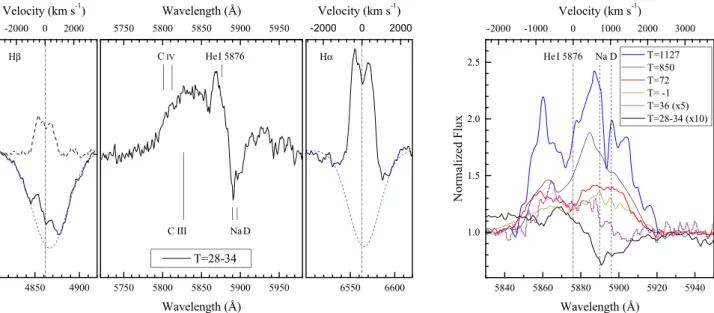
After the rapid fading the emission bump at ∼5830 Å disap-peared, but all the absorption lines transitioned from absorption to emission. Na D also appeared in emission, distorting the red wing of the double-peaked HeIλ5876 line in all post-outburst spectra, even
three years after the superoutburst (see Fig.14, right-hand panel). We point out that Na D was also observed in emission in GW Lib some 40 d after the rapid fading phase (van Spaandonk et al.2010). We also note the presence of a narrow, unidentified line at∼5903 Å. This feature seems to be real and not noise or an artefact of the data reduction because it is present in different spectra and also exhibits a transition from absorption to emission, similarly to Na D.
As the system flux continued to decline, the emission lines got progressively stronger. In the spectrum taken during the decay phase onT=72, the Hαhas a moderate strength (EW=129Å) and the Balmer decrement is relatively flat: Hα:Hβ:Hγ=2.01:1.00:0.56. However, the final spectra taken in quiescence on T = 848 and 1127 show the extremely strong Hαline which peaks at eight and 11 times the continuum and has EW=277 and 384 Å, respectively. To the best of our knowledge, this is the strongest emission line ever observed in a CV. The Balmer decrement is also very steep in these spectra: Hα:Hβ:Hγ=3.20:1.00:0.44 (T=848) and 3.42:1.00:0.56 (T =1127). This change in the Balmer decrement from shallow to very steep indicates a transition from optically thick to optically thin conditions in the accretion disc. We also note that the spectra obtained onT=72 and later show very wide symmetric absorp-tions at the wings of the Balmer lines (FWZI of the Hβabsorption is∼19500 km s−1). These absorption features are too broad to be
produced in the Keplerian accretion disc and can only be formed in the high-density photosphere of the WD, indicating a very low ac-cretion luminosity and mass-acac-cretion rate. Under such conditions one could expect to see the donor star lines in red part of the spec-trum; however there is no evidence at all for atomic lines (e.g. NaI
λ8200) or molecular bands from the donor. We also note that the spectra from all available time-resolved data sets show no obvious radial velocity variability in the accretion disc emission lines. In Table3we present the equivalent width (EW) measurements of the most prominent lines measured from the averaged spectra.
4.2 Orbital period determination
Figure 13. Spectral evolution of SSS J122222 through all the outburst stages and the following decay. All the spectra are normalized to the continuum flux and shifted with respect to each other in accordance to the magnitude of the system during the given spectral observation. Thus, the outburst spectra (V≈12.7) are at the bottom and the quiescent spectra (V≈18–19) are at the top of the figure. TheT=1127 spectrum is relatively noisy at the continuum level, therefore we only show the emission lines (a dashed blue line). Two lower outburst spectra are scaled up by a factor of 10 in relative intensity to magnify the spectral features and allow for a better comparison.
Figure 14. Left: Hαand Hβline profiles and the region around the CIII/CIV/HeIλ5876/Na D complex (black solid line) during the plateau stage of the
superoutburst (arbitrary scaling). The dashed blue line shows a Gaussian fit to the absorption components of Hαand Hβ. The dashed black line shows the profile of Hβafter being corrected for absorption. Right: HeIλ5876 and Na D line profiles from different data sets, shown in actual scale (for a better comparison,
Table 3. EWs of the most prominent lines measured from the averaged spectra. Negative values are used forabsorptionlines.
Epoch Hα Hβ Hγ Hδ HeIλ5876 HeIλ4471 Magnitude
T +Na D (V)
–2 58.0± 0.9 32.5± 0.9 27.2±0.6 18.4±0.4 11.4± 0.9 5.6± 0.6 16.0
–1 81.8± 0.3 47.4± 0.4 34.6±0.2 27.7±0.2 16.5± 0.3 7.3± 0.3 16.4
28 – 34 2.0± 0.1 −3.4± 0.1 −5.3±0.1 −6.0±0.1 0.3± 0.1 −0.3± 0.1 12.7
35 . . . −2.1± 0.2 . . . 13.5
36 12.3± 0.2 . . . 1.7± 0.4 . . . 14.6
72 126.0± 0.3 62.6± 0.3 35.3±0.3 26.2±1.3 22.8± 0.9 8.2± 0.3 17.8
117 . . . 83.9± 1.6 40.7±2.4 25.7±4.2 38.7± 1.9 9.7± 1.4 18.2
850 277.3± 0.9 86.5± 0.2 38.5±0.4 23.9±0.4 31.6± 0.7 5.2± 1.0 19.0
1127 384.1± 8.5 112.2± 3.3 63.0±5.0 . . . 51.3± 3.0 9.9± 2.3 19.0
Note. The Magnitude column indicates the approximate magnitude of SSS J122222 during the observation. They are taken from simultaneous or interpolated from recent photometric observations.
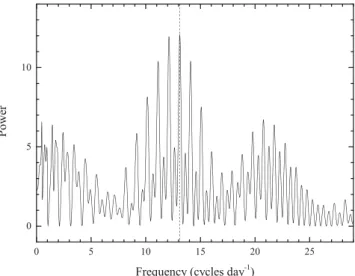
Figure 15. Lomb–Scargle periodogram for spectral data of SSS J122222 obtained during theT=28–30 time interval. The vertical dashed line marks the orbital frequency of 13.112 cycle d−1.
of Hβ, the profile of which showed the strongest variations, using cross-correlation with a single Gaussian (Schneider & Young1980). This has one free parameter, the width of the Gaussian. We tried widths (FWHM) varying from 1500 to 3000 km s−1. For each set of
radial velocities, we computed 2000 Lomb–Scargle periodograms using bootstrap resampling, in each case retaining the period of the highest peak to build up statistics upon the reliability of the period identification. An example of the periodogram calculated for the FWHM of 2500 km s−1is shown in Fig.15. The results clustered
around two peaks split by one cycle d−1at frequencies of 12.127
and 13.112 cycle d−1. Although the radial velocities alone do not
quite secure the alias, we are sure that in fact the higher frequency peak of the pair corresponds to the orbital modulation. Indeed, the period of this modulation is only slightly longer than the period of the superhump signal, as expected for the traditional, ‘positive’ superhumps which are standard for this class of star. Otherwise, it will lead to the ‘negative’ superhumps with an unrealistically large difference between orbital and superhump periods.5Naturally, a
5‘Negative’ superhumps, which are modulations with a period a few per
cent shorter than the binary’s orbital period, are sometimes observed in CVs (see e.g. an analysis of theKeplerdata of V344 Lyr by Wood et al.2011). In most cases they appear in quiescence and sometimes can survive a normal outburst (Wood et al.2011; Osaki & Kato2013). However, in rare cases
more complete radial velocity data set is desirable to confirm this reasoning.
We thus determined the orbital period Porb to be 109.80(7)
min. This period is in the vicinity of a possible orbital period of 109.266 min identified by Kato et al. (2013). However, we could not confirm this value from our own analysis of both the CRTS data and our observations, whereas our late photometric data show a peak in the power spectrum coinciding with the adopted orbital frequency of 13.112 cycle d−1(Fig.11, left-hand panel).
4.3 Radial velocity study
Although our spectra do not show appreciable radial velocity vari-ability, we made an attempt to measure or put the upper limits on the radial velocity semi-amplitudes of emission lines using the double-Gaussian method (Schneider & Young1980). In order to test for consistency in the derived velocities and the zero phase, we separately used the emission lines Hαand Hβfrom theT =72 data set. Additionally, to improve the confidence and reliability of the obtained results, we also created the phase-binned spectra by averaging the individual spectra in 12 phase bins.
All the measurements were made using various Gaussian FWHMs of 50–300 kms−1 and different values of the Gaussian
separationranging from 1000 km s−1to 5000 km s−1in steps
of 100 km s−1, following the technique of ‘diagnostic diagrams’
(Shafter, Szkody & Thorstensen1986). For each value ofwe made a non-linear least-squares fit of the derived velocities to sinu-soids of the form
V(ϕ, )=γ()−K1() sin [2π(ϕ−ϕ0())] (1)
whereγ is the systemic velocity,K1is the semi-amplitude,ϕ0is
the phase of inferior conjunction of the secondary star andϕis the orbital phase calculated relative to epochT0=HJD 245 6372.65160.
The resulting diagnostic diagrams are shown in Fig.16. We found the maximum useful separation to bemax2800−3000 km s−1
for both lines until the noise in the line wings begins to dominate. K1,γ andϕ0are quite stable over a reasonable range of Gaussian
separations aroundmax, thereby helping us with their choice. Both
the tested lines show very consistent results, and we adopted the following values of the orbital parameters:K1=16±5 km s−1,
Figure 16. The diagnostic diagram for the Hαand Hβemission lines from theT=72 observations, showing the response of the fitted orbital elements to the choice of the double-Gaussian separation.
γ=44±6 km s−1andϕ
0=0.00±0.06. The formal errors are the
standard deviations of the least-squares fits. They most likely under-estimate the true errors, as they may not include a priori unknown systematic effects. Moreover, it is well known that the parameters obtained with the double-Gaussian method are often affected by systematic errors. Thus, the derived value ofK1should be used
with great caution.
5 T H E S P E C T R A L E N E R G Y D I S T R I B U T I O N
5.1 The SED evolution
Using our multicolour observations, we have reconstructed the spec-tral energy distribution (SED) of SSS J122222 in the UV–optical– NIR wavelengths at several key moments of the superoutburst, the following decay and quiescence (Fig.17). We note that although the SED in quiescence was created from the most recent obser-vations obtained in 2016 April (T=1186–1196), its UV–optical segment coincides precisely with the two previous multiband ob-servations (T= 536 and 737). In addition, we show the archival pre-outburst observations taken by the Wide-field Infrared Sur-vey Explorer (WISE) observatory in the IR band on T= −920. We also examined NEOWISE-R6 Single Exposure Source Table
and found at least six sources which are a very good positional match to SSS J122222. All these observations were made between T=368 and 906, i.e. when SSS J122222 was already close to or in quiescence. Although the signal-to-noise ratio of this photometry is low (∼3), all the measurements in the W1 filter (3.4µm) are con-sistent with the pre-outburstWISEobservations, giving the same average magnitude of 16.55. This allowed us to include the
pre-6TheWISEwas placed into hibernation in 2011 February. The survey
con-tinued as NEOWISE (Mainzer et al.2011), when the spacecraft was brought out of hibernation. NEOWISE observations in the 3.4 and 4.6µm bands were resumed in 2013 December.
Figure 17. The SED of SSS J122222 at several key moments of the su-peroutburst, the following decay and quiescence. The SED in quiescence is created from the most recent observations taken in 2016 April (T= 1186–1196).
outburst W1 and W2 (4.6µm) measurements in the current SED in quiescence.
The SED shows a complex transformation through the super-outburst and the following decay. Its UV–optical part during and after the active stage was evolving in a similar manner to previous observations of outbursts (see e.g. Verbunt1987; Warner1995), in-dicating the evolution of the accretion disc and boundary layer, and the possible cooling of the accretion-heated WD. OnT=28, the flux from theVtoIbands had a slopeα=3.29±0.07 (fλ∝λ−α) that is close, but still less than the Rayleigh–Jeans tail of an accre-tion disc spectrum. After the rapid fading phase, a strong red-NIR excess emerged, peaking at 8000–10 000 Å, which disappeared about 100 d later. In quiescence, the flux in the red-NIR part of the spectrum (fromRtoKsbands) is linearly decreasing (in log– log space), having a slopeα=2.66±0.06, and the SED shows no sign of any excess in the red-NIR wavelength range.7We note
that the appearance and disappearance of the excess cannot be con-nected with the donor star, for example with one of its side heated during the outburst, because strong orbital variability of the light and its colours is expected in this case, which we were unable to detect in our multicolour data. To the best of our knowledge, such a phenomenon has never been reported before. We discuss it in Section 6.3.
5.2 The SED in quiescence
Well into quiescence the spectra of SSS J122222 show no sign of the donor star. However, at orbital periods of ∼2 h normal CVs have relatively bright donor stars. Although in most CVs there is still a substantial contamination of the NIR luminosity by the accretion process, which makes the detection of their donor stars difficult (Hoard et al.2002), sometimes the donor can directly be recognized by observing the red-NIR hump in the SED (Harrison et al.2013), or after subtracting the disc contribution in the NIR
7TheWISEdata may indicate the presence of an additional source of
Figure 18. Theoretical SEDs of pre- and post-bounce CVs, based on the models of Knigge et al. (2011), shown together with the photometric and spectroscopic data of SSS J122222 and RZ Leo in quiescence (see text for details).
from the observed data (Ciardi et al. 1998). In CVs in which a contamination of the NIR luminosity by the accretion disc is less significant due to a low mass-transfer rate, the NIR hump should be more pronounced (see e.g. the SED of the WZ Sge-type dwarf nova RZ Leo in Mennickent et al.1999, and also Fig.18and the discussion below) and the donor star can also be visible through its absorption lines (see e.g. Ishioka, Sekiguchi & Maehara2007; Hamilton et al.2011; Harrison2016). On the other hand, the donor in a period bouncer should be so dim that even the accretion-heated WD alone is expected to outshine the donor at optical and the NIR (Knigge2006).
SSS J122222 is one such system, in which the contribution of the accretion disc to the continuum is very low, as evident from extremely strong emission lines and clearly seen absorption lines of the WD. On the other hand, its orbital period is relatively long, meaning that a near-main-sequence donor star should be relatively bright. According to the semi-empirical donor star sequence pre-sented by Knigge et al. (2011), a normal donor in SSS J122222 should have the absolute magnitudes J ≈ 9.3, H≈ 8.7 and Ks
≈ 8.4. In order to compare these with the apparent magnitudes, one needs to scale the former to the distance of SSS J122222. The distance to a SU UMa CV can be estimated by utilizing the em-pirical relationships between absolute magnitude and orbital period of dwarf novae at the superoutburst plateau and at maximum light derived by Patterson (2011). For SSS J122222, these relationships give∼275 pc for an average binary inclinationiof 57◦, which can be adopted as a reasonable value. Indeed, the broad double-peaked emission line profiles in spectra of SSS J122222 suggest a relatively high inclination. On the other hand, the extensive photometry and spectroscopy of SSS J122222 rule out any significant eclipse, which constrains the inclinationito be less than about 70◦to avoid an obvi-ous partial eclipse of the disc. Moreover, the inclination is expected
to be even less because the peak-to-peak separation of the emission lines in SSS J122222 is significantly smaller than in highly inclined CVs (compare 940 km s−1in SSS J122222 and, e.g. 1150 km s−1
in the eclipsing CV HT Cas of similarPorb=106 min – Neustroev,
Zharikov & Borisov2016– whose inclination is 81◦). Therefore, we adopted the source distance to be 275 pc with a realistic error on the distance of about±75 pc (for a discussion on uncertainties, see Patterson2011). However, bearing in mind the unusual properties of SSS J122222, we caution the reader that this distance estimate may be less accurate. Thus, the apparentJHKsmagnitudes of a normal donor star in SSS J122222 should be∼16.4, 15.8 and 15.5
±0.6 mag, respectively. This is about two magnitudes brighter than the observed magnitudes of SSS J122222 (Table1), evenwithout taking into account of any contribution from the accretion disc and WD, implying thus that the donor star in SSS J122222 is of very low luminosity.
We find it instructive to compare the observed SED of SSS J122222 in quiescence with the expected SEDs of a CV at dif-ferent evolutionary stages. For this, we used the models of Knigge et al. (2011) which utilize a semi-empirical CV evolution track based on the observed mass–radius relationship of their donor stars. Tables (tables 5– 6 and 7– 8) from their work provide the predicted absolute magnitudes of the donor star and the WD along the CV evolution sequence for a CV before and after the binary has reached the period minimum. For the pre-bounce case, we combined the fluxes of the donor and WD in a CV withPorb=109.8 min. For the
post-bounce case we summed the component fluxes of a CV with Porb=90 min, the longest calculated post-bounce period.8In these
8Note that the donor flux and accordingly its contribution to the total flux
calculations, no contribution from an accretion disc was taken into account, thus the calculated SEDs should be considered as a lower limit to the actual SEDs. For a comparison, we also calculated a model atmosphere spectrum of a WD with a mass of 0.9 Mand a surface temperature of 14 000 K, which reproduces the observed broad wings of Balmer line profiles and the calculated flux of which is in good agreement with the adopted distance.9
All the calculated SEDs were then scaled to the distance of SSS J122222, 275 pc. They are shown in Fig.18together with the photo-metric and spectroscopic data of SSS J122222 in quiescence. For a comparison, we also show the photometric data of RZ Leo, another WZ Sge-type CV, which has a similar orbital period (109.5 min) and which shares many properties with SSS J122222 (Mennick-ent et al.1999; Mennickent & Diaz 2002). In particular, the disc contribution to the spectrum of RZ Leo is also insignificant and probably even smaller than in SSS J122222, as indicated by deep WD absorption lines clearly visible in the SDSS spectrum. We point out that in contrast to SSS J122222, the donor star of M5 spectral type is easily seen in the spectrum of RZ Leo, confirming the pre-bounce status of the system (Mennickent & Diaz2002; Hamilton et al.2011). Thus, RZ Leo represents a good test case for comparing the observed and calculated SEDs. For this analysis, we used the available photometric measurements of RZ Leo from the SDSS, 2MASS andWISEdata bases. Although the distance to RZ Leo is estimated to be 260±60 pc (Patterson2011), also very close to SSS J122222, we rescaled the fluxes to 275 pc.
The observed SEDs of SSS J122222 and RZ Leo show a close resemblance in the optical wavelengths, but a significant difference in the NIR. RZ Leo follows the predicted pre-bounce SED sur-prisingly well, whereas the observed NIR flux of SSS J122222 is much lower (7–10 times in theJHKsbands) than expected from a CV with a normal donor star; therefore, a main-sequence donor is excluded. However, the observed NIR flux is about two to three times higher than the sum of the predicted fluxes from the WD and a post-period-minimum donor. This excess can possibly be explained by a contribution from the accretion disc. Although the optical con-tinuum flux from the disc in SSS J122222 is low, nonetheless it can be more significant at NIR wavelengths (Hoard et al.2002).
6 D I S C U S S I O N
The analysis of observations of SSS J122222 presented above shows a number of features, many of which are rare or quite unusual when compared with most of WZ Sge-type systems and even any other dwarf novae. Here we merely highlight and discuss a few most interesting points.
6.1 Mass ratioq
The light curve of SSS J122222 is remarkable for its double super-outburst with a deep and prolonged dip between its two segments, a long duration of the second superoutburst’s segment, the longest of any other known dwarf novae, and its very gentle decline. Kimura et al. (2016) suggested that such double superoutbursts which were previously observed in only a few other WZ Sge-stars may indicate a very lowq. Kato et al. (2014) presented a survey of the fading rates of about 320 superoutbursts of∼185 ordinary SU UMa-type
9Selected values of temperature and loggare not unique, slightly different
solutions are plausible. Hence, the adopted parameters should be considered as a first approximation.
and 45 WZ Sge-type dwarf novae (for several objects more than one superoutburst were studied.). The fading rate during the superout-burst plateau in SSS J122222 was the slowest among all the studied superoutbursts. It was shown (Osaki1989; Cannizzo et al.2010) that the theoretical fading rate depends mostly on the accretion disc viscosity in the hot state, thus for slower fading rates one needs to consider a smaller viscosity. Kato et al. (2014) suggested that the viscosity should be smaller in CVs with a low mass ratio, therefore the unusually slow fading rates may also indicate a very lowq(see section 5.5 in their paper for a more detailed discussion).
Kato et al. (2013) attempted to estimatequsing the periods of su-perhumps during the rising stage and post-superoutburst stage and found that SSS J122222 has a mass ratio less than 0.05. Another approach to findingqis to employ the empirical relation between the fractional superhump period excess=(Psh−Porb)/Porband
the mass ratio (Patterson et al.2005). Because the period of super-humps is variable, it is not clear which value ofPshshould be used.
In the literature, the mean superhump period or the period of stage B superhumps is often used. For SSS J122222 the latter period is 110.10 min and =0.27(7) per cent. Vican et al. (2011) noted, however, that Patterson et al. (2005) calibrated their–qrelation with superhumps observed during an early bright phase of the out-burst. For SSS J122222 this corresponds to the second half of stage A (Psh =110.64 min), which gives =0.76(8) per cent. Thus,
the period excess in SSS J122222 is one of the smallest known of all CVs showing superhumps. For=0.27 and 0.76 per cent the –qrelation of Patterson et al. (2005) gives the mass ratio 0.015 and 0.045, respectively. In order to be on the conservative side and bearing in mind that the–qrelation is poorly calibrated for low q, we adopt the larger value as an estimate ofq. This is consistent with the value reported by Kato et al. (2013), and also in good agreement with the measuredK1. Indeed, by using the WD mass Mwd=0.9 Mand the inclinationi=57◦, adopted in Section 5.2,
the mass function givesq=0.04.
6.2 Late superhumps
6.3 A massive cool gas region beyond the 3:1 resonance radius
Simultaneously with the start of the rapid fading phase, SSS J122222 showed the appearance of the strong red-NIR excess, which disappeared 100 days later. It is interesting to note that the passage through the reddest colours had been accompanied by alteration of the decline slope (Fig.4), by a significant decrease of superhump amplitudes (Fig.6), and perhaps by an emergence of the late super-humps (Section 3.2.2). This red-NIR excess and also the appearance of the Na D line in absorption during the plateau stage indicate a fairly cool region in the outer disc. Tovmassian & Zharikov (2013, and references therein) show that outer parts of extended accretion discs of period bouncers should indeed contain cool (∼2000 K) material unlike ordinary dwarf novae in which 5000 K is consid-ered as the disc edge temperature. We suggest that this cool gas is accumulated in the outermost part of the disc, beyond the 3:1 resonance radius. In the binaries with low mass ratios such as the WZ Sge-type stars, the 3:1 resonance radius is located well inside the Roche lobe of the primary while the tidal truncation radius is almost as large as the Roche lobe. During energetic superoutbursts after the long period of quiescence, the disc expands in order to transfer the large amount of angular momentum released by the accreting matter. That can bring substantial mass beyond the 3:1 resonance radius. It is thought that during a superoutburst a sig-nificant fraction (70–80 per cent) of the disc is accreted (Cannizzo et al.2012). However, the matter accumulated in the outer parts of the disc avoids the 3:1 resonance, suffers a lower tidal dissipation of angular momentum and may be left from being accreted during the main superoutburst (Hellier2001).
Such a model was originally proposed to explain the repeated rebrightenings observed in EG Cnc and some other WZ Sge-type dwarf novae (Kato2015), but later has also been invoked to in-terpret late superhumps and other peculiar properties of WZ Sge-type systems (Kato et al.2008). It was shown that ‘a cool matter reservoir’ beyond the 3:1 resonance can supply the matter to the inner disc, resulting in rebrightenings, whereas the late superhumps should arise near the tidal truncation radius, from the matter in the reservoir.
In order to develop the model further it is essential to establish the time-scale of the reservoir filling and depleting. Our observations show that the Na D line has appeared in absorption no later than on T=28, after that the line parameters were very stable until the end of the plateau stage. It suggests that the cool outer disc was already formed about three weeks after the beginning of the second segment of the superoutburst. However, the spectra obtained during the tem-porary fading stage between the superoutburst segments show the Na D line in emission. It implies that there was already a significant amount of matter in the reservoir at that time. Perhaps, the matter accumulated there during the first segment of the superoutburst. The following observations indicate that the reservoir depletion has been happening very slowly, because even 250 d after the superout-burst the system colours were redder than in quiescence, and also the late superhumps were observed at least 420 d after the super-outburst. Moreover, the sodium doublet was observed in emission until the most recent observations, obtained three years after the su-peroutburst. It has been steadily increasing the intensity in parallel with HeIλ5876, suggesting a similar excitation mechanism of both
lines.
Considering the very low mass ratio and also the long duration of the superoutburst, one can expect that a system similar to SSS J122222 can accumulate a significant amount of matter in the outer disc. It then seems to take years to drain this reservoir.
6.4 SSS J122222 as a period bouncer
The orbital period of SSS J122222, 109.80 min, is one of the longest among the WZ Sge-type stars (Kato 2015). In Section 5.2 we showed that at orbital periods of∼2 h a contribution of the nor-mal donor star to the NIR segment of the spectrum should dominate in quiescence, but is seemingly entirely absent. It suggests that the donor star has a low temperature and very low luminosity, that is consistent with the lowK1and with very smallq0.045 estimated
from the period of superhumps. With such a small mass ratio even if the WD was close to the Chandrasekhar limit the donor mass must be below the hydrogen-burning minimum mass limit of 0.075 M. This suggests that SSS J122222 might already be evolving away from the period minimum towards longer periods, having passed through it, with the donor now extremely dim. Using a reasonable range of system parameters adopted above (q=0.015–0.045,Mwd
=0.8–1.0 M,d=275 pc) and assuming that the NIR spectrum is dominated by the WD only and that the contribution from the accretion disc is completely negligible, the residual NIR light sets a conservative upper limit on the temperature of the donor star of
∼2000 K. Moreover, the donor temperature is possibly significantly lower, because the disc probably contributes at NIR wavelengths (Hoard et al.2002).
The properties of SSS J122222 are very similar to those of GD 522, another very strong period-bounce candidate with relatively longPorb of 103 min (Unda-Sanzana et al.2008). However, the
longer period of SSS J122222, together with its small period excess, suggests that it is by far the most evolved CV known to date. As-suming that the only angular momentum loss mechanism in period-bounce CVs is that due to gravitational radiation, the age of SSS J122222 should be older than∼6 Gyr (Howell et al.1997).
We should note, however, that there is a separate evolutionary channel leading to brown-dwarf donors in CVs directly from de-tached WD/brown-dwarf binaries. Politano (2004) found, through population synthesis, that 18 per cent of the total zero-age CVs pop-ulation are born with brown-dwarf donors, and 20 per cent of which have orbital periods in the range 78 to 150 min. The probability of finding that sort of system is not very high, though. According to the standard model of CV secular evolution, it is at least four times more likely that the donors in period-bounce candidates became substel-lar as a result of mass loss during secusubstel-lar evolution rather than that they were born substellar (Politano2004). Moreover, the predicted distribution of orbital periods in CVs with the donors which were born substellar (fig. 2 in Politano2004) shows a rapidly dwindling number of such CVs at longerPorb (as in SSS J122222 and GD
522). Still, this alternative evolutionary scenario is possible. Which evolutionary channel produced SSS J122222 and other period-bounce candidates can potentially be distinguished by the properties of the donor star. Since the donors in period bouncers were born as normal stars and became substellar during secular evolution, it is not obvious that these objects behave like ordinary brown dwarfs. In particular, the former objects should have compar-atively higher helium abundance in comparison with normal brown dwarfs. Also, brown dwarfs (at least of a lower mass) do not burn lithium, whereas normal stars do, thus the lithium test (see e.g. Mar-tin, Rebolo & Magazzu1994) can be applied to distinguish brown dwarfs from substellar objects in period bouncers. Unfortunately, an accurate derivation of the helium abundance has proved difficult to perform even for normal stars, whereas even the strongest LiI
λ6708 line is very weak and superposed on the broad and relatively strong HeI λ6678 line. Therefore, we have to agree with