NANOSCALE COORDINATION POLYMERS FOR ANTICANCER DRUG DELIVERY
Rachel Huxford Phillips
A dissertation submitted to the faculty of the University of North Carolina at Chapel Hill in partial fulfillment of the requirements for the degree of Doctor of Philosophy in the Department of Chemistry.
Chapel Hill 2013
Approved by: Dr. Wenbin Lin Dr. Cynthia Schauer Dr. Joseph Templeton Dr. Wei You
ii ©2013
iii ABSTRACT
RACHEL HUXFORD PHILLIPS: Nanoscale Coordination Polymers for Anticancer Drug Delivery
(Under the direction of Wenbin Lin)
This dissertation reports the synthesis and characterization of nanoscale coordination polymers (NCPs) for anticancer drug delivery. Nanoparticles have been explored in order to address the limitations of small molecule chemotherapeutics. NCPs have been investigated as drug delivery vehicles as they can exhibit the same beneficial properties as the bulk metal-organic frameworks as well as interesting characteristics that are unique to nanomaterials.
Gd-MTX (MTX = methotrexate) NCPs with a MTX loading of 71.6 wt% were synthesized and stabilized by encapsulation within a lipid bilayer containing anisamide (AA), a small molecule that targets sigma receptors which are overexpressed in many cancer tissues. Functionalization with AA allows for targeted delivery and controlled release to cancer cells, as shown by enhanced efficacy against leukemia cells. The NCPs were doped with Ru(bpy)32+ (bpy = 2,2’-bipyridine), and this formulation was utilized as an optical imaging agent by confocal microscopy.
iv
showed in vitro efficacy against non-small cell lung cancer (NSCLC) cell lines. Enhanced efficacy was observed for formulations containing AA.
Additionally, NCP formulations containing the cisplatin prodrug disuccinatocisplatin were prepared; one of these formulations could be stabilized by encapsulation within a lipid layer. Coating with a lipid layer doped with AA rendered this formulation an active targeting agent. The resulting formulation proved more potent than free cisplatin in NSCLC cell lines. Improved NCP uptake was demonstrated by confocal microscopy and competitive binding assays.
v
ACKNOWLEDGEMENTS
First and foremost, I would like to thank my doctorate advisor, Dr. Wenbin Lin for supporting my research and providing me with invaluable insight and direction for my projects. Additionally, I thank the members of my dissertation committee, Dr. Cynthia Schauer, Dr. Joseph Templeton, Dr. Wei You, and Dr. Sohrab Habibi for their guidance and for considering my dissertation.
vi
Additionally, I thank those whom have helped in obtaining and interpreting data on instrumentation. This includes Amar Kumbhar, Carrie Donley, and Wallace Ambrose of the Chapel Hill Analytical and Nanofabrication Laboratory, Sohrab Habibi of the Department of Chemistry Mass Spectrometry Facility, and Robert Bagnell of the UNC Microscopy Service Laboratory.
vii
TABLE OF CONTENTS
LIST OF TABLES. ...xii
LIST OF FIGURES. ...xiii
LIST OF ABBREVIATIONS AND SYMBOLS. ...xxiii
CHAPTER 1. An Overview of Anticancer Chemotherapy with Nanoscale Coordination Polymers. ...1
1.1. Introduction... 1
1.2. Proof of Concept: Drug Delivery from MOFs. ...5
1.3. Drug Delivery with Nano-MOFs. ...9
1.4. Conclusion. ...14
1.5. References. ...16
2. Lipid-Coated Nanoscale Coordination Polymers for Targeted Delivery of Methotrexate. ...19
2.1. Introduction. ...19
2.1.1. Conventional Cancer Chemotherapy - Methotrexate. ...19
2.1.2. Previous Methotrexate-Based Nanoscale Coordination Polymers. ...21
2.1.3. Liposomes. ...24
2.2. Results and Discussion. ...25
2.2.1. Lipid Coating of Zr-MTX NCP. ...25
viii
2.2.3. Synthesis and Characterization of Gd-MTX NCP. ...30
2.2.4. Lipid Coating of Gd-MTX NCP. ...31
2.2.5. Synthesis and Characterization of Gd-Folate NCP. ...35
2.2.6. In Vitro Cytotoxicity and Viability Assays. ...36
2.2.7. Synthesis and Characterization of Ru(bpy)32+- Doped Gd-MTX NCP. ...40
2.2.8. Confocal Microscopy. ...43
2.2.9. MR Relaxivities of Gd-MTX NCPs. ...46
2.2.10. PEGylation of Gd-MTX NCP. ...48
2.3. Conclusion. ...54
2.4. Experimental Details. ...54
2.4.1. Materials and Methods. ...54
2.4.2. Synthesis of Reagents. ...56
2.4.3. Synthesis of MTX and Folate-Containing NCPs. ...58
2.4.4. Lipid-Coating Procedures. ...59
2.4.5. In Vitro Assay Methods. ...63
2.5. References. ...66
3. Nanoscale Coordination Polymers for Delivery of Pemetrexed. ...69
3.1. Introduction. ...69
3.1.1. Pemetrexed. ...69
3.2. Results and Discussion. ...70
3.2.1. UV-Visible Analysis – Pemetrexed. ...70
ix
3.2.3. Synthesis and Characterization of Zr-PMX NCP. ...74
3.2.4. Synthesis and Characterization of Gd-PMX NCP. ...75
3.2.5. Synthesis and Characterization of Hf-PMX NCP. ...81
3.2.6. Lipid Coating of Hf-PMX NCP. ...84
3.2.7. Synthesis and Characterization of Hf-Folate NCP. ...87
3.2.8. In Vitro Cytotoxicity Assays. ...89
3.3. Conclusion. ...92
3.4. Experimental Details. ...93
3.4.1. Materials and Methods. ...93
3.4.2. Synthesis of Reagents. ...94
3.4.3. Synthesis of PMX- and Folate-Containing NCPs. ...96
3.4.4. Lipid Coating Procedure. ...98
3.4.5. In Vitro Assay Methods. ...101
3.5References. ...103
4. Nanoscale Coordination Polymers for Targeted Delivery of Cisplatin. ...104
4.1. Introduction. ...104
4.1.1. Platinum Complexes for Cancer Chemotherapy - Cisplatin. ...104
4.2. Results and Discussion. ...106
4.2.1. Synthesis and Characterization of Mg-DSCP NCP. ...106
4.2.2. Synthesis and Characterization of Mn-DSCP NCP. ...107
4.2.3. Synthesis and Characterization of Zr-DSCP NCP. ...109
4.2.4. Stabilization Attempts of Zr-DSCP NCP. ...115
x
4.2.6. Lipid Coating of La-DSCP NCP. ...122
4.2.7. Synthesis and Characterization of La-Suc NCP. ...125
4.2.8. In Vitro Cytotoxicity and Viability Assays. ...126
4.2.9. Synthesis and Characterization of Ru(bpy)32+- Containing NCPs. ...131
4.2.10. Confocal Microscopy. ...133
4.2.11. Competitive Binding Assays. ...135
4.3. Conclusion. ...136
4.4. Experimental Details. ...137
4.4.1. Materials and Methods. ...137
4.4.2. Synthesis of Reagents. ...138
4.4.3. Synthesis of DSCP- and Suc-Containing NCPs. ...139
4.4.4. Surface Modifications of Zr-DSCP NCP. ...143
4.4.5. Lipid Coating Procedures. ...143
4.4.6. In Vitro Assay Methods. ...145
4.5. References. ...149
5. Nanoscale Coordination Polymers for Delivery of an Oxaliplatin Analog. ...151
5.1. Introduction. ...151
5.1.1. Platinum Complexes for Cancer Chemotherapy - Oxaliplatin. ...151
5.2. Results and Discussion. ...153
5.2.1. Synthesis and Characterization of La-DSOX NCP. ...153
xi
5.2.3. Synthesis and Characterization of Zr-DSOX NCP. ...155
5.3. Conclusion. ...156
5.4. Experimental Details. ...157
5.4.1. Materials and Methods. ...157
5.4.2. Synthesis of Pt(IV) Oxaliplatin Prodrugs and Related Complexes. ...158
5.4.3. Synthesis of Oxaliplatin-Based NCPs. ...162
xii
LIST OF TABLES
Table
xiii
LIST OF FIGURES
Figure
1.1. Illustration of the EPR effect in which nanoparticles are too large to penetrate the ordered vasculature of normal tissue but can permeate through the leaky vasculature of diseased tissue and are
retained there due to poor lymphatic drainage. ...2 1.2. Formation of MOFs by coordination-directed self-assembly
processes and the loading of drugs into MOFs via physical
encapsulation. ...3 1.3. Synthetic techniques for NCPs. (1) Reverse microemulsion,
(2) Surfactant-templated synthesis, (3) solvothermal synthesis, (4) rapid precipitation. ...4 1.4. The structure of MIL-101. The tetrahedra are assembled from
trivalent metal centers (Cr or Fe) and 1,4-benzenedicarboxylate. MIL-101 possesses larger pores than MIL-100, which facilitates
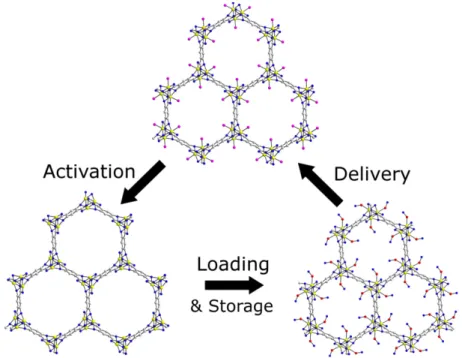
Ibuprofen loading. ...7 1.5. Absorption, storage, and release of nitric oxide (NO) in a Co
or Ni MOF. Activation occurs by dehydration of the MOF at 110 °C, followed by NO loading at room temperature. Finally, delivery (release) of NO is triggered when the MOF was
exposed to 11% relative humidity. ...9 1.6. A) Schematic showing the synthesis of Tb-DSCP NCP (NCP-1)
and its subsequent coating with a silica shell (NCP-1´) and conjugation with a cyclic peptide. (PVP = polyvinylpyrollidone, TEOS = tetraethylorthosilicate) B) TEM micrograph for as- synthesized NCP-1. C) TEM and D) SEM micrographs for NCP-1′. E) In vitro cytotoxicity assay curves for HT-29 cells obtained by plotting the % cell viability against the Pt
concentration of various samples and free cisplatin control. ...12 1.7. NanoMIL-101 can be loaded both with an optical imaging agent
xiv
2.2. Schematic showing the solvothermal synthesis of MTX- and folate-containing NCPs, encapsulation with a lipid bilayer
containing a targeting ligand, and cell uptake and release. ...21 2.3. SEM micrographs of (a) Zn-MTX and (b) Zr-MTX. TEM
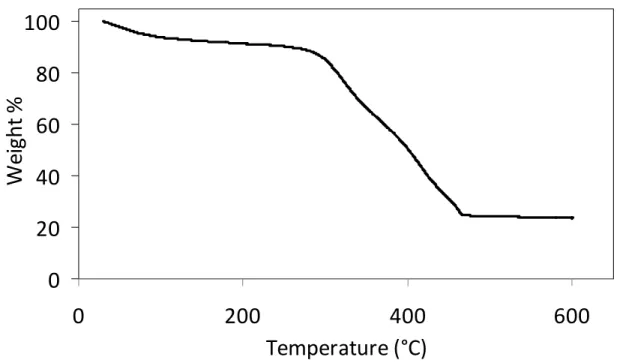
micrographs of (c) Zn-MTX and (d) Zr-MTX. ...22 2.4. TGA plot of Zn-MTX, showing organic weight loss between 250
and 500 °C attributed to MTX (79.1 wt%). ...23 2.5. TGA plot of Zr-MTX, showing organic weight loss between 250
and 500 °C attributed to MTX (78.2 wt%). ...23 2.6. Illustration showing self-assembled liposome formation via
hydration of a lipid film, followed by encapsulation of individual
particles within lipid bilayers. ...24 2.7. TEM micrograph of DOTAP liposomes using Pt(II) as a stain. ...25 2.8. DLS plots of ζ potential and Z average of Zr-MTX NCPs given
increasing amounts of 1:1 (by mol) DOTAP/cholesterol liposomes. As more liposomes are added to the formulation, ζ potential
stabilizes at a positive value and aggregation dissipates. ...26 2.9. TEM micrographs of (a) Zr-MTX and (b) Zr-MTX@Lipid treated
with uranyl acetate stain. Zr-MTX has a dark surface due to binding of uranyl acetate to surface carboxylates, a phenomenon not observed for Zr-MTX@Lipid due to shielding of the NCP
surface by the lipid bilayer. ...27 2.10. Release profile of Zr-MTX and Zr-MTX@Lipid in 8 mM PBS
at 37 °C showing no enhanced stabilization for the lipid-coated
formulation (t1/2 ~ 30 min). ...28 2.11. SEM micrograph of La-MTX NCPs. ...29 2.12. SEM micrograph of Pr-MTX NCPs. ...29 2.13. TGA of Pr-MTX, showing organic weight loss between 250 and
550 °C attributed to MTX. ...30 2.14. SEM (a) and TEM (b) micrographs of Gd-MTX NCPs. ...31 2.15. TGA of Gd-MTX showing organic weight loss between 250 and
xv
2.16. DLS plots of ζ potential and Z average of Gd-MTX NCPs with the addition of increasing amounts of 1:1 (by mol) DSTAP/DOPE
liposomes. This plot shows that with increasing liposome amounts, the ζ potential becomes positive and the Z average diameter
approaches that of free liposomes. ...32 2.17. TEM micrographs of (a) Gd-MTX and (b) Gd-MTX@Lipid in the
presence of uranyl acetate stain. Uranyl acetate forms dark rings on the surface of the lipid-coated formulation due to binding to the
phosphates of the DOPE lipid. ...33 2.18. Confocal microscopy images of Ru(bpy)3-doped Gd-MTX@Lipid
in which the lipid bilayer has been doped with 10 mol% DOPE-FITC. This experiment was conducted to show co-localization of NCP fluorescence with the fluorescence of the lipid bilayer. a) DIC image, b) red fluorescence due to NCPs, c) green fluorescence due to FITC-doped lipid bilayer, and d) overlay of NCP and lipid bilayer fluorescences showing co-localization. ...34 2.19. Release profile for Gd-MTX@Lipid in 8 mM PBS at 37°C and
using 10K mwco dialysis tubing. t1/2: free MTX = 1.5 h, Gd-MTX = 2 h, Gd-MTX@Lipid = 23 h. Complete MTX release from Gd-MTX@Lipid was observed at 143 h. ...34 2.20. An absorption spectrum for MTX (black), compared to an
absorption spectrum for a release profile aliquot from dialysis of Zn-MTX (red). The absorption profile does not change
significantly, indicating that MTX remains unchanged under the
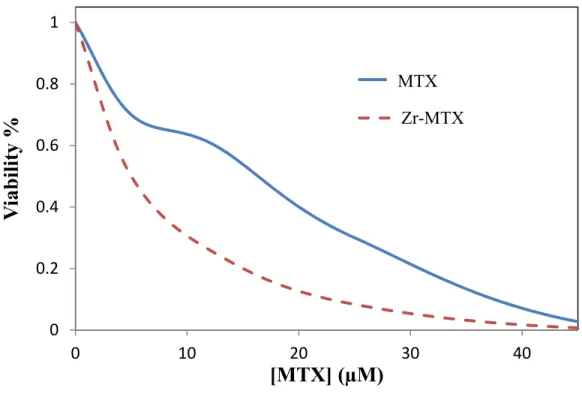
synthetic conditions used. ...35 2.21. SEM micrograph of Gd-Folate NCPs. ...36 2.22. In vitro viability curves of MTX and Zr-MTX against the CCRF-
CEM acute lymphoblastic leukemia cell line over 3 h. ...37 2.23. In vitro viability curves of MTX and Zr-MTX against the CCRF-
CEM acute lymphoblastic leukemia cell line for 48 h. ...37 2.24. In vitro cytotoxicity curves for MTX-containing NCPs against
Jurkat acute lymphoblastic leukemia cells. ...38 2.25. IC50 plot of MTX-containing NCPs for a 72 h in vitro cytotoxicity
xvi
2.26. In vitro viability assay testing free Gd(III) and Gd-folate NCPs, displaying that no cytotoxic effect was observed due to free Gd(III) or the control vehicles. This experiment confirms that the
cytotoxicity observed for MTX-containing NCPs is due solely to MTX and no other agent. ...40 2.27. SEM micrographs of Ru(bpy)32+-doped Gd-MTX with different
doping amounts: (a) 2.5 mol%, (b) 5 mol%, (c) 10 mol%. ...41 2.28. TGA plot of Gd-MTX doped with 5 mol% Ru(bpy)32+ showing
organic weight loss attributed to bpy ligands and MTX. ...42 2.29. Fluorescence spectrum of Ru(bpy)32+-doped Gd-MTX showing
emission from the presence of Ru(bpy)32+ (~620 nm). ...42 2.30. SEM micrograph of Ru(bpy)32+-doped Gd-folate NCPs. ...43 2.31. (a-c) Differential interference contrast (DIC) images and (d-i)
fluorescence images of Jurkat cells incubated with Gd-MTX (d,g), Gd-MTX@DSTAP/DOPE (e,h), and Gd-MTX@DSTAP/DOPE- AA (f,i). Red fluorescence (d-f) is from the Ru(bpy)32+-doped particles and green fluorescence (g-i) is from the Annexin V FITC
conjugate early apoptosis stain. Scale bars represent 25 µm. ...44 2.32. Confocal images of Jurkat cells incubated with Gd-folate (a-c),
Gd-folate@DSTAP/DOPE (d-f), and Gd-folate@DSTAP/DOPE- AA (g-i). Cells incubated with the AA-targeted formulation shows enhanced uptake, but no apoptosis is apparent. Channels are: a,d,g) DIC, b,e,h) red from particles, c,f,i) green from Annexin V FITC
apoptotic stain. Scale bars are 25 µm. ...45 2.33. MR relaxivity plots for Gd-MTX showing values for r1 and r2. ...46 2.34. MR relaxivity plots for Gd-MTX@Lipid showing values for r1 and r2. ...47 2.35. MR relaxivity plots for Gd-MTX@Lipid-AA showing values for r1 and r2. ....47 2.36. T2- (a) and T1- (b) weighted images for Gd-MTX, Gd-MTX@
DSTAP/DOPE, and Gd-MTX@DSTAP/DOPE-AA. ...48 2.37. ζ potential plot of PEGylated Gd-MTX@Lipid that shows the
decrease in ζ potential with increasing amounts of DOPE-PEG added to the formulation. ...49 2.38. SEM micrograph of Gd-MTX PEGylated with DOPE-PEG
xvii
2.39. DLS plot showing the increase of number average diameter with
increased additions of DOPE-PEG. ...50 2.40. SEM micrograph of Gd-MTX@Lipid PEGylated with 5 mol%
DOPE-PEG. ...52 2.41. DLS number average plots of Gd-MTX, Gd-MTX@Lipid, and
PEGylated (5 mol%) Gd-MTX@Lipid. ...52 2.42. TGA plots of Gd-MTX, Gd-MTX@Lipid, and PEGylated Gd-
MTX@Lipid with 5 mol% DOPE-PEG by pre-insertion. ...53 2.43. UV-Vis spectrum of DOPE-Peg2K in a solution of I2/KI, showing
a maximum absorbance at ~460 nm. 500 nm was used as the standard curve absorbance to reduce any interference from other species in solution. ...61 2.44. Standard curve at 500 nm for different concentrations of DOPE-
Peg2K in I2/KI, BaCl2 in 1 N HCl. ...62 3.1 Structure of the antifolate pemetrexed (PMX). ...70 3.2. UV-Vis plots of PMX in (a) 8 mM PBS and (b) 0.1 M H3PO4,
both media used for generating standard curves for PMX concentrations. ...71 3.3. SEM micrographs of crystalline, rod-like Mn-PMX NCPs. ...72 3.4. PXRD pattern of Mn-PMX nanorods. ...73 3.5. TGA of Mn-PMX showing PMX organic weight loss (69.9 wt%
PMX) between 275 and 400 °C. TGA of PMX is shown for comparison. ...73 3.6. SEM micrograph of Zr-PMX NCPs. ...74 3.7. TGA plot of Zr-PMX NCPs where the organic weight loss yields
high PMX loading of 60.0 wt% between 275 and 450 °C. ...75 3.8. SEM micrograph of Gd-MTX NCPs formed by solvothermal synthesis. ...76 3.9. TGA plot of Gd-PMX NCPs synthesized by solvothermal synthesis
showing weight loss corresponding to 65.0 wt% PMX drug loading between 300 and 450 °C. ...76 3.10. UV-Vis plot of digested Gd-PMX NCPs synthesized by a
xviii
3.11. SEM (a) and TEM (b) micrographs of Gd-PMX NCPs synthesized
by a surfactant-assisted heating technique. ...78
3.12. TGA plot of Gd-PMX synthesized by a surfactant-templated synthesis showing organic weight loss corresponding to 72.3 wt% PMX drug loading between 300 and 450 °C. ...78
3.13. UV-Vis plot of Gd-PMX NCPs synthesized by the surfactant- assisted heating method, compared to free PMX showing that the PMX incorporated in the NCP has not degraded. ...79
3.14. MR relaxivity plot for Gd-PMX (surfactant-templated) showing values for r1 and r2. ...80
3.15. DLS Z average and ζ potential plots of Gd-PMX coated with increasing amounts of 1:1 (by mol) DSTAP/DOPE liposomes showing decreased particle aggregation and cationic ζ potentials with increased liposome volumes. ...80
3.16. SEM micrograph of Hf-PMX NCPs synthesized by a solvothermal method. ...81
3.17. TGA plot of Hf-PMX synthesized by a solvothermal synthesis showing 40.0 wt% PMX drug loading. ...82
3.18. TEM micrograph of DOPA-capped Hf-PMX NCPs. ...82
3.19. TGA plot of DOPA-capped Hf-PMX NCPs, showing organic weight loss attributed to DOPA and PMX. ...83
3.20. TEM micrograph of lipid-coated Hf-PMX NCPs. ...85
3.21. Release profile of DOPA-capped Hf-PMX (t1/2 ~ 15 min) and Lipid-coated Hf-PMX (t1/2 ~ 3 h) in 8 mM PBS at 37 °C showing stabilization with a lipid bilayer. ...85
3.22. BSA assay testing the stability of lipid-coated Hf-PMX for 18 h. ...86
3.23. TEM micrograph of Hf-PMX@Lipid-AA NCPs. ...87
3.24. TEM micrograph of Hf-Folate control vehicles. ...87
3.25. TGA of Hf-Folate NCPs showing 34 wt% folic acid organic weight loss between 300 and 500 °C. ...88
xix
3.27. In vitro cytotoxicity curves of free PMX and Gd-PMX (by
surfactant-assisted synthesis) showing equal cytotoxicity over 48 h for both agents. ...90 3.28. IC50 curves of Hf-PMX formulations against the NCI-H460
NSCLC cell line, showing enhanced efficacy from the AA-
targeted formulation. ...91 3.29. IC50 curves of Hf-PMX formulations against the A549 NSCLC
cell line, showing the same efficacy for both lipid-coated formulations. ...92 4.1. Structure of cisplatin, one of the three FDA-approved platin-based
chemotherapeutics. ...104 4.2. Mechanism of cisplatin in apoptotic cell death. ...105 4.3. Schematic showing the synthesis of La-DSCP NCPs, stabilization
with a lipid bilayer, and uptake into lung cancer cells. ...106 4.4. SEM micrograph of Mg-DSCP NCPs. ...107 4.5. SEM micrograph of Mn-DSCP NCPs. ...108 4.6. TGA plot of Mn-DSCP showing organic weight loss corresponding
to 31.8 wt% DSCP drug loading. DSCP organic weight loss is
observed between 150 and 275 °C. ...108 4.7. SEM micrograph of Mn-DSCP synthesized by a surfactant-
assisted heating synthesis. ...109 4.8. SEM (a) and TEM (b) micrographs of larger Zr-DSCP. ...110 4.9. TGA plot of larger Zr-DSCP NCPs showing organic weight loss
corresponding to 41.1 wt% DSCP between 150 and 300 °C. ...111 4.10. SEM micrograph of Zr-DSCP NCPs synthesized by solvothermal
synthesis. ...111 4.11. SEM micrograph of Zr-DSCP NCPs by acetone-induced rapid
precipitation. ...112 4.12. TGA plot of Zr-DSCP where organic weight loss corresponds to
xx
4.14. SEM (a) and TEM (b) micrographs of DOPA-capped Zr-DSCP. ...114
4.15. TGA plot of DOPA-capped Zr-DSCP, showing more organic weight loss (due to the addition of DOPA) than Zr-DSCP. ...114 4.16. Release profile of Zr-DSCP@DOPA in 8 mM PBS at 37 °C. ...115 4.17. SEM (a) and TEM (b) micrographs of Zr-DSCP@PVP. ...116 4.18. TGA plot of Zr-DSCP@PVP, compared to Zr-DSCP, showing
increased organic weight loss due to the presence of DOPA. DSCP weight loss is observed between 175 and 350 °C. ...116 4.19. SEM (a) and TEM (b) micrographs of Zr-DSCP@PVP@SiO2. ...117 4.20. EDS plot of Zr-DSCP@PVP@SiO2 showing the presence of
Zr, Pt, and Si. ...118 4.21. TEM micrograph of lipid-coated Zr-DSCP@DOPA NCPs. ...119 4.22. SEM (a) and TEM (b) micrographs of La-DSCP NCP. ...120 4.23. TGA plot of La-DSCP showing a large amount of organic weight
loss attributed mostly to the presence of DOPA. ...121 4.24. Release profile of La-DSCP in 8 mM PBS at 37 °C. ...121 4.25. TEM micrograph of La-DSCP@Lipid. ...122 4.26. Release profile of La-DSCP@Lipid in 8 mM PBS at 37 °C,
showing enhanced stability over the as-synthesized NCPs. ...123 4.27. (a) DLS stability of La-DSCP@DOPA@Lipid in PBS overnight.
The Z average diameter slowly stabilizes to 130 nm, which may indicate a small population of larger particles settles out. Zavg = 139.2 ± 9.3 nm, PDI = 0.153 ± 0.013, and count rate = 330.4 ± 27.3 kcps. (b) DLS stability of La-DSCP@DOPA@Lipid in 5 mM PBS with 5 mg/mL BSA. Zavg = 146.5 ± 5.1 nm, PDI = 0.238 ± 0.010, and count rate = 325.1 ± 16.2 kcps. ...124 4.28. DLS stability of La-DSCP@DOPA@Lipid-AA in 5 mM PBS
xxi
4.30. In vitro cytotoxicity curves for cisplatin and large Zr-DSCP against NCI-H460 NSCLC cells over 72 h. ...127 4.31. In vitro cytotoxicity curves for cisplatin and La-DSCP formulations
against NCI-H460 cells for 48 h. ...127 4.32. In vitro cytotoxicity assay testing cisplatin and La-DSCP formulations
against A549 NSCLC cells for 48 h. ...128 4.33. In vitro viability assay testing La-Suc formulations against NCI-
H460 NSCLC cells for 48 h, showing no cytotoxic effects. ...129 4.34. In vitro viability assay testing La-Suc formulations against A549
NSCLC cells for 48 h, showing no cytotoxic effects. ...130 4.35. In vitro viability assay testing LaCl3 salt against NCI-H460 NSCLC
cells for 48 h, showing no cytotoxic effects. ...130 4.36. In vitro viability assay testing LaCl3 salt against A549 NSCLC
cells for 48 h, showing no cytotoxic effects. ...131 4.37. SEM (a) and TEM (b) micrographs of Ru(bpy)32+-doped La-Suc NCPs. ...132 4.38. TGA plot of Ru(bpy)32+-doped La-DSCP showing a large amount
of organic weight loss, presumably due to DOPA associated with the particles. ...132 4.39. Florescence spectra of La-DSCP and Ru(bpy)32+-doped La-
DSCP, showing emission of Ru(bpy)32+ at ~620 nm (excitation 450 nm). ...133 4.40. Laser scanning confocal microscopy images showing DIC (b, d, f, h)
and red fluorescence (a, c, e, g) attributed to particle fluorescence from Ru(bpy)32+: (a, b) control (no particles), (c, d) La-Suc, (e, f) La-Suc@Lipid, and (g, h) La-Suc@Lipid-AA. Scale bars = 20 μm. ...134 4.41. Competitive binding assay showing amount of Pt uptake in NCI-
H460 cells treated subsequently with amounts of NH2-PEG5K-AA and either La-DSCP@Lipid or La-DSCP@Lipid-AA. ...135 4.42. Competitive binding assay showing amount of La uptake in NCI-
xxii
5.1. Structure of oxaliplatin, one of the three FDA-approved platin- based chemotherapeutics. ...151 5.2. Structure of disuccinato oxaliplatin (DSOX), an oxaliplatin prodrug. ...152 5.3. SEM micrograph of La-DSOX NCP synthesized by a rapid
precipitation technique. ...153 5.4. SEM micrographs of La-DSOX synthesized by a reverse
microemulsion technique. ...154 5.5. SEM micrograph of Nd-DSOX NCPs. ...154 5.6. EDS plot of Nd-DSOX NCPs showing the presence of Nd and Pt. ...155 5.7. SEM (a) and TEM (b) micrographs of Zr-DSOX NCPs. ...156 5.8. TGA plot of Zr-DSOX showing organic weight loss corresponding
xxiii
LIST OF ABBREVIATIONS AND SYMBOLS
° degrees
@ denotes one component inside of another
αvβ3 an integrin that is overexpressed in some cancer tissues µ micro-
θ angle
ζ zeta
Å angstroms
A549 human non-small cell lung carcinoma cell line
AA anisamide
ALL acute lymphoblastic leukemia
aq. aqueous
As arsenic
Bodipy boron dipyrromethane
bpy 2,2’-bipyridine BSA bovine serum albumin
CCRF-CEM human acute lymphoblastic leukemia cell line CDCl3 deuterated chloroform
Co cobalt
Cr chromium
c(RGDfk) small cyclic peptide known to target the αvβ3 integrin DACH R,R-diaminocyclohexane
xxiv DMF N,N-dimethylformamide
DMSO dimethylsulfoxide DNA deoxyribonucleic acid
DOPA 1,2-dioleoyl-sn-glycero-3-phosphate DOPC 1,2-dioleoyl-sn-glycero-3-phosphocholine DOPE L-α-phosphatidylethanolamine, dioleoyl DOTAP 1,2-dioleoyl-3-trimethylammonium propane DSCP disuccinatocisplatin
DSOX disuccinato oxaliplatin
DSPE-Peg 1,2-distearoyl-sn-glycero-3-phosphoethanolamine-N-(polyethylene glycol) DSTAP 1,2-stearoyl-3-trimethylammonium propane
EDS energy dispersive X-ray spectroscopy EPR enhanced permeability and retention eq. equivalents
ESCP ethoxysuccinatocisplatin Et2O diethylether
EtOH ethanol
FBS fetal bovine serum
FDA Food and Drug Administration Fe iron
FITC fluorescein isothiocyanate g grams
Gd gadolinium
h hours
xxv Hf hafnium
HPLC high performance liquid chromatography HT-29 human colorectal adenocarcinoma cell line IC50 inhibitory concentration 50%
ICP-MS inductively-coupled plasma mass spectrometry IR infrared
Jurkat human acute lymphoblastic leukemia cell line Ksp solubility product
L liters La lanthanum m milli- M molar MeOH methanol
MIL Materials of Institut Lavoisier
min minutes
Mn manganese
MOF metal-organic framework
mol moles
MR magnetic resonance MRI magnetic resonance imaging MTX methotrexate
n nano-
NCI-H460 human non-small cell lung carcinoma cell line NCP nanoscale coordination polymer
xxvi Ni nickel
NMOF nanoscale metal-organic framework NMR nuclear magnetic resonance NSCLC non-small cell lung cancer
OEt ethoxy
PBS phosphate buffered saline PDI polydispersity index PEG poly(ethylene glycol) PMX pemetrexed
Pr praseodymium Pt platinum
PVP polyvinylpyrrolidone PXRD powder x-ray diffraction r1 longitudinal relaxivity r2 transverse relaxivity
Ru ruthenium
SBF simulated body fluid
SEM scanning electron microscopy Suc succinate
t1/2 half-life
T1 longitudinal relaxation time T2 transverse relaxation time
Tb terbium
TEA triethylamine
xxvii TEOS tetraethyl orthosilicate
TGA thermogravimetric anaylsis THF tetrahydrofuran
UV ultraviolet
vis visible
W water to surfactant molar ratio wt weight
Zn zinc
CHAPTER 1
An Overview of Anticancer Chemotherapy with Nanoscale Coordination Polymers
(Portions of this chapter were adapted with permission from Huxford, R.C.; Della Rocca, J.; Lin, W. Curr. Opin. Chem. Biol. 2010, 14, 262. Copyright 2010 Elsevier)
1.1. Introduction
2
considered a mode of passive targeting as nanoparticles are too large to enter the highly ordered vasculature of normal, healthy tissue. Thus, nanoparticles, if remaining in circulation long enough, eventually will accumulate in the tumor region.
Figure 1.1. Illustration of the EPR effect in which nanoparticles are too large to penetrate the ordered vasculature of normal tissue but can permeate through the leaky vasculature of diseased tissue and are retained there due to poor lymphatic drainage. Courtesy of Demin Liu.
3
Metal-organic frameworks (MOFs) are a new class of highly tunable hybrid materials crafted from metal-connecting points and organic polydentate ligands.10 They are typically synthesized under mild conditions via coordination-directed self-assembly processes (Figure 1.2), and are also called coordination polymers or coordination networks.11-15 Known for their large porosities with tunable pore sizes, shapes, and functionalities, MOFs are well studied among the scientific community for many applications such as nonlinear optics, gas storage, catalysis, chemical sensing, and separations.10,11,14-21 MOFs exhibit many desirable characteristics as drug carriers, including exceptionally high surface areas and large pore sizes for drug encapsulation, intrinsic biodegradability as a result of relatively labile metal-ligand bonds, and versatile functionality for post-synthetic grafting of drug molecules.
Figure 1.2. Formation of MOFs by coordination-directed self-assembly processes and the loading of drugs into MOFs via physical encapsulation. Only one unit of an infinite MOF framework is shown for clarity.
Recently, MOFs have been investigated for applications in loading and release of several drug molecules. When scaled down to the nano-regime to form nanoscale metal-organic frameworks (NMOFs), or nanoscale coordination polymers (NCPs), these materials exhibit the same beneficial properties as their bulk counterparts but also possess interesting characteristics that are unique to nanomaterials. NCPs can be formed from a number of self-assembly processes, each of which is illustrated in Figure 1.3.22-24 The most straightforward
MOF
4
of these methods is a solvothermal synthesis in which the metal and ligand molecules are heated in a solvent, which can lead to amorphous or crystalline products. NCPs can also be synthesized in reverse (water-in-oil) microemulsions in which the reactants are suspended in surfactant-stabilized aqueous droplets in an organic phase. These droplets behave as nanoreactors, facilitating the assembly of the NCP material. This strategy can also be utilized in a surfactant-templated heating method in which a reverse microemulsion is heated to facilitate the reaction. Finally, NCPs can be formed via rapid precipitation, in which a solution of reactants is precipitated with a solvent, usually resulting in the formation of amorphous particles.
Figure 1.3. Synthetic techniques for NCPs. (1) Reverse microemulsion, (2) Surfactant-templated synthesis, (3) solvothermal synthesis, (4) rapid precipitation.
5
presence of functional groups to interact with loaded moieties. Our group has recently reported NCPs as important delivery vehicles for contrast enhancement agents for magnetic resonance imaging, computed tomography, and optical imaging;25-31 however, this chapter will focus on applications of MOFs and NCPs as potential drug delivery vehicles. Although their drug delivery applications are still in their infancy, NCPs exhibit many desired characteristics as nanocarriers. Intrinsic tunability and biodegradability, as well as exceptionally high drug loading capacity, of this emerging class of hybrid nanomaterials should make these systems promising candidates for further development as nanotherapeutics.
1.2. Proof of Concept: Drug Release from MOFs
In developing MOFs for drug delivery, the goal is to design carriers that possess minimal toxicity in the body; biocompatibility of both the metal and bridging ligand must be considered. While chromium and other metals are highly toxic, some metals exist in appreciable amounts in the body. For example, iron is a component of hemoglobin and has a concentration of approximately 22 µM in blood plasma. Tissues also contain various metals, such as copper (68 µM), manganese (180 µM), nickel (2 µM), and zinc (180 µM).32 Since this is an emerging class of drug carriers, there are very limited data on the biological fate of NCP platforms. Iron oxide nanoparticles are clinically approved as MRI contrast agents, and in vitro assays have shown that these particles are not cytotoxic.33
6
MRI contrast agents.26 The MIL family of MOFs is crafted from trivalent metal centers and carboxylic acid bridging ligands and holds great promise in drug delivery for their attractive characteristics: large pores (25-34 Å), outstanding surface areas (3100-5900 m2/g), and the ability to incorporate functional groups into the framework.
7
Figure 1.4. The structure of MIL-101. The tetrahedra are assembled from trivalent metal centers (Cr or Fe) and 1,4-benzenedicarboxylate. 101 possesses larger pores than MIL-100, which facilitates Ibuprofen loading.
The Férey group has also reported controlled drug release for MIL-53, a more flexible MOF in the MIL family.37 Both MIL-53(Cr) and the less toxic MIL-53(Fe) achieved loadings of 0.220 g Ibuprofen/g MOF and 0.210 g Ibuprofen/g MOF, respectively. The delivery kinetics were investigated in SBF at 37 °C; complete drug delivery occurred in 3 weeks, a long release time attributed to the flexibility of the MIL-53 framework and strong drug-framework interactions. This prolonged drug release gives MIL-53 the potential of being used for sustained release and drug delivery. The drug loadings achievable with the MIL family are much higher than any material previously studied for drug encapsulation (through non-covalent interactions). Given the ability to construct highly porous MOFs with tunable hydrophobicity from practically any metal center, the possibilities are unlimited.
8
used to encapsulate drugs that contain opposing charges to the MOFs. Rosi and co-workers recently developed an anionic MOF composed of Zn(II) ions, adenine, and para-biphenyldicarboxylic acid that can be cationically-triggered to release its cargo.38 The MOF is anionic, so its use for storage and release of cationic drugs via exchange with cations in biological fluid was investigated. The MOF was loaded with 0.22g/g of hydrochloride salt of procainamide, an antiarrythmia drug. Procainamide therapy is currently limited by its rapid clearance from the body, requiring dosing every 3 to 4 h. The drug release behavior of the MOF was monitored by HPLC; complete release was observed at 72 h in phosphate buffered saline (PBS). In contrast, the drug-loaded MOF was also dialyzed against pure water, with only 20% of the drug released, suggesting that the majority of procainamide is released by the cations present in PBS. In addition, the authors demonstrated that the framework remained intact under these conditions.
9
Figure 1.5. Absorption, storage, and release of nitric oxide (NO) in a Co or Ni MOF. Activation occurs by dehydration of the MOF at 110 °C, followed by NO loading at room temperature. Finally, delivery (release) of NO is triggered when the MOF was exposed to 11% relative humidity. (Pink spheres indicate water molecules, red and blue spheres indicate nitric oxide.)
The effect of the NO-loaded MOFs on precontracted pig coronary arteries was investigated; the MOFs resulted in more vessel relaxation than the NO-free control. While Ni and Co are too toxic to be used for biological applications, the work discussed thus far shows the ability of MOF materials to absorb and release large amounts of therapeutic cargo. The ability to deliver significant doses of NO is also relevant to cancer therapy since NO has shown anticancer activity in high concentrations, but shows tumorigenic properties at lower concentrations. The concentration at which this switch occurs is unknown.44,45
1.3. Drug Delivery with Nano-MOFs
10
need to be scaled down to the nano-regime so that the resulting NCPs can circulate systemically while maintain the advantageous properties of bulk MOFs for drug delivery. NCPs can improve the pharmacokinetic properties of the encapsulated drugs.1,5,7
Not only can small molecule agents be encapsulated within a MOF framework, the drug can also be incorporated within the framework directly as the bridging ligand. The Lin group was able to fabricate an NCP (designated as NCP-1) from Tb(III) ions and c,c,t- [PtCl2(NH3)2(O2CCH2CH2CO2H)2] (disuccinatocisplatin, DSCP), a Pt(IV) cisplatin prodrug.46 The NCP-1 nanoparticles were 58.3 ± 11.3 nm in diameter by dynamic light scattering (DLS), and were encapsulated with silica to enhance stability (half-life, t1/2, of 9 h in HEPES buffer at 37°C, compared to 1 h for as-synthesized NCPs). Silica-coated NCP-1 particles were further functionalized with c(RGDfk), a cyclic peptide that targets the ανβ3
11
12
13
Figure 1.7. NanoMIL-101 can be loaded both with an optical imaging agent and a cisplatin prodrug. Simultaneous release of the fluorophore and cisplatin prodrug allows real-time monitoring of drug delivery by optical imaging.
The particles were coated with silica to enhance stability in vitro, giving a t1/2 of 14 h in PBS at 37 °C, compared to 1.2 h for the uncoated particles. Silica-coated particles were grafted with the cyclic peptide c(RGDfk) and studies with the functionalized particles against HT-29 cells showed that the particles had comparable cytotoxicity to that of free cisplatin (IC50 = 21 µM for the particles, IC50 = 20 µM for cisplatin, IC50 = 29 µM for silica-coated, untargeted particles). Grafting of both an optical imaging agent and a cisplatin prodrug into the nanoMIL-101 system suggests the potential of using such a platform for theranostic (both diagnosis and therapy with a single nanoparticle) applications that allow real-time monitoring of therapeutic responses of an anticancer drug.
14
complexes inside liposomes.48,49 As2O3 is a potent therapy for leukemia, limited by its severe side effects and poor pharmacokinetics. Salts of nickel, cobalt, copper, and zinc were incorporated into liposomes, followed by loading of As(OH)3 to form insoluble M(II) complexes of As2O3. Folate-targeted liposomes with Ni/As2O3 showed high cytotoxicity against HeLa cervical cancer cells with an IC50 of 1.8 ± 0.6 µM (IC50 = 4.3 ± 0.3 µM for free As2O3). Recently, O’Halloran and co-workers were able to co-encapsulate As2O3 and a cisplatin-like drug (acetate salt of diaqua-cisplatin) inside a liposome using the same strategy.50 This formulation exhibited comparable cytotoxicity to As2O3 and diaqua-cisplatin alone, with several different cancer cell lines. Adair and coworkers were able to successfully encapsulate organic fluorophores and hydrophobic chemotherapeutics within calcium phosphate nanoparticles.51,52 Calcium phosphate nanoparticles provide a pH-tunable way to deliver encapsulated molecules to targeted cells with minimal background release. Ceramide, an apoptosis inducer, was encapsulated into the nanoparticles during synthesis. Preliminary in vitro cell assays against breast cancer and melanoma cell lines revealed that the
nanoparticle conjugate showed highly effective induction of apoptosis, while the nanoparticle carrier displayed little toxicity. Additionally, the Ceramide-containing calcium phosphate conjugate showed activity in resistant cell lines. Although these systems are not NCPs, they share some of the same design principles as NCP-based nanotherapeutics.
1.4. Conclusion
15
16 1.5. References
(1) Davis, M. E.; Chen, Z.; Shin, D. M. Nat. Rev. Drug Discov. 2008, 7, 771. (2) Dyson, P. J.; Sava, G. Dalton Trans. 2006, 1929.
(3) Cho, K.; Wang, X.; Nie, S.; Chen, Z.; Shin, D. M. Clin. Cancer Res. 2008, 15, 1310. (4) Peer, D.; Karp, J. M.; Hong, S.; Farokzhad, O. C.; Margalit, R.; Langer, R. Nat.
Nanotechnol. 2007, 2, 751.
(5) Alexis, F.; Pridgen, E.; Molinar, L. K.; Farokzhad, O. C. Mol. Pharm. 2008, 5, 505. (6) Ferrari, M. Nat. Rev. Cancer 2005, 5, 161.
(7) Li, S. D.; Huang, L. Mol. Pharm. 2008, 5, 496.
(8) Sanhai, W. R.; Sakamoto, J. H.; Canady, R.; Ferrari, M. Nat. Nanotechnol. 2008, 3, 242.
(9) Parveen, S.; Misra, R.; Sahoo, S. K. Nanomedicine 2012, 8, 147.
(10) Li, H.; Eddaoudi, M.; O'Keeffe, M.; Yaghi, O. M. Nature 1999, 402, 276.
(11) Evans, O. R.; Xiong, R.-G.; Wang, Z.; Wong, G. K.; Lin, W. Angew. Chem. Int. Ed. 1999, 38, 536
(12) Moulton, B.; Zaworotko, M. J. J. Chem. Rev. 2001, 101, 1629.
(13) Kitagawa, S.; Kitaura, R.; Noro, S.-I. Angew. Chem. Int. Ed. 2004, 43, 2334. (14) Oh, M.; Mirkin, C. A. Nature 2005, 438, 651.
(15) Evans, O. R.; Lin, W. Acc. Chem. Res. 2002, 35, 511.
(16) Seo, J. S.; Whang, D.; Lee, H.; Jun, S. I.; Oh, J.; Jeon, Y. J.; Kim, K. Nature 2000, 404, 982.
(17) Ferey, G.; Latroche, M.; Serre, C.; Millange, F.; Loiseau, T.; Percheron-Guegan, A. Chem. Commun. 2003, 2976.
(18) B, C.; Wang, L.; Xiao, Y.; Fronczek, F. R.; Xue, M.; Cui, Y.; Qian, G. Angew. Chem. Int. Ed. 2009, 48, 500.
17
(20) Lin, W.; Wang, L.; Ma, L. J. Am. Chem. Soc. 1999, 121, 11249.
(21) Park, K. H.; Jang, K.; Son, S. U.; Sweigart, D. A. J. Am. Chem. Soc. 2006, 128, 8740. (22) Lin, W.; Rieter, W. J.; Taylor, K. M. L. Angew. Chem. Int. Ed. 2009, 48, 650.
(23) Della Rocca, J.; Liu, D.; Lin, W. Acc. Chem. Res. 2011, 44, 957.
(24) Taylor-Pashow, K. M. L.; Della Rocca, J.; Huxford, R. C.; Lin, W. Chem. Commun. 2010, 46, 5832.
(25) Rieter, W. J.; Taylor, K. M. L.; Lin, W. J. Am. Chem. Soc. 2007, 129, 9852. (26) Rieter, W. J.; Taylor, K. M. L.; An, H.; Lin, W.; Lin, W. J. Am. Chem. Soc. 2006,
128, 9024.
(27) Taylor, K. M. L.; Jin, A.; Lin, W. Angew. Chem. Int. Ed. 2008, 47, 7722. (28) Taylor, K. M. L.; Rieter, W. J.; Lin, W. J. Am. Chem. Soc. 2008, 130, 14358. (29) deKrafft, K. E.; Xie, Z.; Cao, G.; Tran, S.; Ma, L.; Zhou, O. Z.; Lin, W. Angew.
Chem. Int. Ed. 2009, 48, 9901.
(30) deKrafft, K. E.; Boyle, W. S.; Burk, L. M.; Zhou, O. Z.; Lin, W. J. Mater. Chem. 2012, 22, 18139.
(31) Liu, D.; Huxford, R. C.; Lin, W. Angew. Chem. Int. Ed. 2011, 50, 3696.
(32) Bertini, I.; Gray, H. B.; Stiefel, E. I.; Valentine, J. S. Biological Inorganic Chemistry: Structure and Reactivity; University Science Books: Sausalito, CA, 2007.
(33) Park, J.; Yu, M. K.; Jeong, Y. Y.; Kim, J. W.; Lee, K.; Phan, V. N.; Jon, S. J. Mater. Chem. 2009, 19, 6412.
(34) Ferey, G.; Mellot-Draznieks, C.; Serre, C.; Millange, F.; Dutour, J.; Surble, S.; Matgiolaki, I. Science 2005, 309, 2040.
(35) Horcajada, P.; Serre, C.; Vallet-Regi, M.; Sebban, M.; Taulelle, F.; Ferey, G. Angew. Chem. Int. Ed. 2006, 309, 5974.
(36) Bauer, S.; Serre, C.; Deciv, T.; Horcajada, P.; Morrot, J.; Ferey, G. Inorg. Chem. 2008, 47, 7568.
18
(38) An, J.; Geib, S. J.; Rosi, N. L. J. Am. Chem. Soc. 2009, 131, 8376. (39) Miller, A. R.; Megson, I. L. Br. J. Pharmacol. 2007, 151, 305. (40) Zhu, H. F.; Ka, B.; Murad, F. World J. Surg. 2007, 31, 624.
(41) McKinlay, A. C.; Ziao, B.; Wragg, D. S.; Wheatley, P. S.; Megson, I. L.; Morris, R. E. J. Am. Chem. Soc. 2008, 130, 10440.
(42) Dietzel, P. D. C.; Morita, Y.; Blom, R.; Fjellvag, H. Angew. Chem. Int. Ed. 2005, 44, 6354.
(43) Wheatley, P. S.; Butler, A. R.; Crane, M. S.; Fox, S.; Xiao, B.; Rossi, A. G.; Megson, I. L.; Morris, R. E. J. Am. Chem. Soc. 2006, 128, 502.
(44) Sonveaux, P.; Jordan, B. F.; Gallez, B.; Feron, O. Eur. J. Cancer 2009, 45, 1352. (45) Huerta, S.; Chilka, S.; Bonavida, B. Int. J. Oncol 2008, 33, 909.
(46) Rieter, W. J.; Pott, K. M.; Taylor, K. M. L.; Lin, W. J. Am. Chem. Soc. 2008, 130, 11584.
(47) Taylor-Pashow, K. M. L.; Della Rocca, J.; Xie, Z.; Tran, S.; Lin, W. J. Am. Chem. Soc. 2009, 131, 14261.
(48) H, C.; MacDonald, R. C.; Li, S.; Krett, N. L.; Rosen, S. T.; O'Halloran, T. V. J. Am. Chem. Soc. 2006, 128, 13348.
(49) H, C.; Ahn, R.; Van den Bossche, J.; Thompson, D. H.; O'Halloran, T. V. Mol. Cancer. Ther. 2009, 8, 1955.
(50) Chen, H.; Pazicni, S.; Krett, N. L.; Ahn, R. W.; Penner-Hahn, J. E.; Rossen, S. T.; O'Halloran, T. V. Angew. Chem. Int. Ed. 2009, 48, 9295.
(51) Kester, M.; Heakal, Y.; Fox, T.; Sharma, A.; Robertson, G. P.; Morgan, T. T.; Altinoglu, E. I.; Tabakovic, A.; Parette, M. R.; Rouse, S. M. Nano Lett. 2008, 8, 4116.
CHAPTER 2
Lipid-Coated Nanoscale Coordination Polymers for Targeted Delivery of Methotrexate
(Portions of this chapter were adapted with permission from Huxford, R.C.;† deKrafft, K.E.;† Boyle, W.S.; Liu, D.; Lin, W. Chem. Sci. 2012, 3, 198. †Contributed equally to this work.
Copyright 2012 Royal Society of Chemistry)
2.1. Introduction
2.1.1. Conventional Cancer Chemotherapy - Methotrexate
Conventional cancer chemotherapy regimens consist of a single small molecule agent or a combination of agents. Despite the high efficacy of these therapies, current treatments are limited by nonspecific distribution throughout the body leading to high doses, rapid clearance, narrow therapeutic windows, poor pharmacokinetics, and high side effects.1 One such chemotherapeutic agent is methotrexate (MTX), shown in Figure 2.1.
Figure 2.1. Structure of the antifolate methotrexate (MTX).
20
21
Figure 2.2. Schematic showing the solvothermal synthesis of MTX- and folate-containing NCPs, encapsulation with a lipid bilayer containing a targeting ligand, and cell uptake and release.
2.1.2. Previous Methotrexate-Based Nanoscale Coordination Polymers
22
by encapsulation in a lipid bilayer (liposome), and exhibits cytotoxicity and enhanced uptake in Jurkat ALL cells.
Figure 2.3. SEM micrographs of (a) MTX and (b) Zr-MTX. TEM micrographs of (c) Zn-MTX and (d) Zr-Zn-MTX.
a)
b)
23
Figure 2.4. TGA plot of Zn-MTX, showing organic weight loss between 250 and 500 °C attributed to MTX (79.1 wt%).
Figure 2.5. TGA plot of Zr-MTX, showing organic weight loss between 250 and 500 °C attributed to MTX (78.2 wt%).
0
20
40
60
80
100
0
200
400
600
Temperature
(°C)
We
ig
h
t
%
0 20 40 60 80 100
0 200 400 600
W
eight %
24 2.1.3. Liposomes
Liposomes, bilayers of typically phospholipids, are known to stabilize nanomaterials.11-14 The coating process presumably occurs via charge-charge interactions between oppositely-charged particles and liposomes.15 Liposomes are formed by the self-assembly of lipids dispersed in aqueous solution, which forms liposomes that are multilamellar (containing concentric layers). The liposome diameter can be refined by development of multilamellar liposomes through an extruder to yield monodisperse liposomes containing one bilayer (unilamellar).16 These liposomes can be mixed with an aqueous particle dispersion, and the liposomes rearrange to result in encapsulation of individual particles (Figure 2.6). The addition of a lipid bilayer to a particle surface can result in enhanced stability as liposomes are mostly impermeable to moieties such as salts and macromolecules, compounds known to rapidly degrade particles under biological conditions.12,17,18
25 2.2. Results and Discussion
2.2.1. Lipid Coating of Zr-MTX NCP
Briefly, liposomes containing cationic lipids DOTAP (1,2-dioleoyl-3-trimethylammonium propane) or DSTAP/DOPE (DSTAP = 1,2-stearoyl-3-trimethylammonium propane, DOPE = L-α-phosphatidylethanolamine, dioleoyl) were prepared by reduction of lipids in chloroform to a lipid film, hydration in 1 mM aq. KCl, and extrusion through a series of polycarbonate filter membranes. For example, DOTAP liposomes with a Z average diameter of 51.9 nm, PDI of 0.105, and ζ potential of 68.3 mV were produced by this method (Figure 2.7).
Figure 2.7. TEM micrograph of DOTAP liposomes using Pt(II) as a stain.
26
and ζ potential plots, but encapsulation with a lipid bilayer did not result in stabilization of the Zr-MTX NCP. The following will illustrate an example: encapsulation of Zr-MTX with 1:1 (by mol) DOTAP/cholesterol liposomes. A dispersion of Zr-MTX in 1 mM aq. KCl was mixed with different amounts of 1:1 (by mol) DOTAP/cholesterol liposomes, resulting in different particle:liposome weight ratios. Monitoring the Z average diameter and ζ potential of the samples by DLS (Figure 2.8) can indicate successful lipid encapsulation. As liposomes are added to the NCP dispersion, aggregation is observed when some liposomes are added, followed by stabilization in Z average as the addition of more liposomes alleviates the aggregation. Encapsulation can also be monitored via changes in ζ potential; the potential increases from a negative value (non-coated particles = -26.2 mV) to a positive value that approaches that of the liposome dispersion (72.6 mV).
Figure 2.8. DLS plots of ζ potential and Z average of Zr-MTX NCPs given increasing amounts of 1:1 (by mol) DOTAP/cholesterol liposomes. As more liposomes are added to the formulation, ζ potential stabilizes at a positive value and aggregation dissipates.
‐40 ‐20 0 20 40 60 80 0 100 200 300 400 500 600
0 2 4 6 8 10
ζ
Potential
(mV)
Z A
verage
(nm)
Liposomes Added (wt%)
Zavg
ZetaζPotential
27
By SEM, the lipid-coated Zr-MTX particles, Zr-MTX@Lipid, do not differ from the as-synthesized particles, but use of a uranyl acetate stain with TEM imaging shows evidence of the DOTAP/cholesterol lipid bilayer (Figure 2.9). Uranyl acetate produces a dark ring around as-synthesized Zr-MTX since uranyl ions bind preferentially to carboxylates on the NCP surface.15 In lipid-coated particles, this dark ring is not present since the particles are lipid-coated and the uranyl acetate cannot permeate the lipid bilayer to bind with the particle. Despite the accumulating evidence of lipid encapsulation of Zr-MTX with DOTAP/cholesterol liposomes, the formulation did not stabilize the NCP, as shown by a release profile of Zr-MTX@Lipid in 8 mM PBS at 37 °C (Figure 2.10).
Figure 2.9. TEM micrographs of (a) Zr-MTX and (b) Zr-MTX@Lipid treated with uranyl acetate stain. Zr-MTX has a dark surface due to binding of uranyl acetate to surface carboxylates, a phenomenon not observed for Zr-MTX@Lipid due to shielding of the NCP surface by the lipid bilayer.
28
Figure 2.10. Release profile of Zr-MTX and Zr-MTX@Lipid in 8 mM PBS at 37 °C showing no enhanced stabilization for the lipid-coated formulation (t1/2 ~ 30 min).
After several attempts to stabilize Zr-MTX via lipid encapsulation, we speculated that Zr-MTX could not be stabilized due to the great driving force of Zr(IV) to form Zr3(PO4)4 (ksp = 10-134). Since phosphates of trivalent lanthanides have lower ksp values, we sought to fabricate MTX-containing NCPs using lanthanide (III) metals.
2.2.2. Synthesis and Characterization of La-MTX and Pr-MTX NCPs
NCPs of La-MTX were synthesized by a solvothermal method in which MTX and LaCl3·7H2O were heated in DMF at 80 °C. The resulting spherical particles were 300-500 nm in diameter by SEM (Figure 2.11). The large size of these particles precluded their use in biological applications. Several attempts were made to reduce the diameter of this formulation, but all were unsuccessful.
0 20 40 60 80 100
0 1 2 3 4 5 6
MTX Release (%)
Time (h)
Zr‐MTX
Zr‐MTX_40:1
Zr-MTX
29 Figure 2.11. SEM micrograph of La-MTX NCPs.
NCPs using the trivalent lanthanide praseodymium were produced by a similar solvothermal method to La-MTX. These particles are spherical and between 150-300 nm in diameter by SEM (Figure 2.12), with a Z average diameter of 235.6 nm, PDI of 0.192, and ζ potential of -15.3 mV by DLS. Pr-MTX has an exceptionally high MTX drug loading of 63.7 wt% by TGA (Figure 2.13). These particles are too large for biomedical applications, and the effect of Pr in biological systems is unknown, so these particles were not explored further.
30
Figure 2.13. TGA of Pr-MTX, showing organic weight loss between 250 and 550 °C attributed to MTX.
2.2.3. Synthesis and Characterization of Gd-MTX NCP
Nanoparticles of Gd-MTX were produced by a solvothermal technique in which equal molar amounts of Gd(NO3)3·6H2O and MTX were heated in DMF at 80 °C for 5 min. This reaction afforded a yellow product in ~85% yield. These NCPs are between 70-200 nm by both SEM and TEM with a diameter (number average) of 77.7 nm (Figure 2.14) and PDI of 0.040 by DLS, indicating a highly monodisperse sample. Gd-MTX possesses a high MTX drug loading of 71.6 wt% by TGA (Figure 2.15). Particles of Gd-MTX have a ζ potential of -10.0 mV, indicating that these particles can be encapsulated with a cationic lipid bilayer.
0 20 40 60 80 100
0 100 200 300 400 500 600
W
eight %
31
Figure 2.14. SEM (a) and TEM (b) micrographs of Gd-MTX NCPs.
Figure 2.15. TGA of Gd-MTX showing organic weight loss between 250 and 500 °C attributed to MTX.
2.2.4. Lipid Coating of Gd-MTX NCP
As-synthesized Gd-MTX NCPs were encapsulated in a 1:1 (by mol) DSTAP/DOPE lipid bilayer by mixing dispersions of liposomes and particles in 1 mM aq. KCl to yield
Gd-0 20 40 60 80 100
0 100 200 300 400 500 600
W
eight %
Temperature (°C)
32
MTX@Lipid. Successful lipid encapsulation was evidenced by monitoring the Z average diameter and ζ potential of the particle/liposome mixture with increasing liposome:particle weight ratios (Figure 2.16). Aggregation of the particles ceases and the ζ potential becomes positive with increased additions of liposomes, indicating successful lipid encapsulation. When Gd-MTX@Lipid is stained with uranyl acetate and imaged by TEM, a dark ring is evident presumably due to uranyl ions binding to the phosphates of the DOPE lipid,15 a phenomenon that is not observed for Gd-MTX (Figure 2.17).
Figure 2.16. DLS plots of ζ potential and Z average of Gd-MTX NCPs with the addition of increasing amounts of 1:1 (by mol) DSTAP/DOPE liposomes. This plot shows that with increasing liposome amounts, the ζ potential becomes positive and the Z average diameter approaches that of free liposomes.
‐30 ‐20 ‐10 0 10 20 30 40 50 0 200 400 600 800 1000
0 0.2 0.4 0.6 0.8 1
ζ
Potential
(mV)
Z A
verage
(nm)
Lipid:Particle (By Weight)
Zavg
Zeta
33
Figure 2.17. TEM micrographs of (a) Gd-MTX and (b) Gd-MTX@Lipid in the presence of uranyl acetate stain. Uranyl acetate forms dark rings on the surface of the lipid-coated formulation due to binding to the phosphates of the DOPE lipid.
Only a slight decrease in particle size from the as-synthesized particles is observed by DLS; particles of Gd-MTX@Lipid were 64.6 nm (number average) with a PDI of 0.240. The decrease in size can be attributed to a decrease in aggregation due to the lipid coating. The lipid-coated particles have a cationic ζ potential (32.6 mV) due to presence of the lipid bilayer on the particle surface. Further evidence of lipid encapsulation can be observed by laser scanning confocal microscopy. Gd-MTX particles doped with the optical imaging agent Ru(bpy)32+ (discussed in section 2.2.7) were encapsulated with a 1:1 (by mol) DSTAP/DOPE bilayer containing 10 mol% DOPE-FITC, another optical imaging agent. When the particles are imaged by confocal microscopy, co-localization of the red channel (particles) with the green channel (FITC) indicates individual particles are associated with lipid bilayers (Figure 2.18). Encapsulation of Gd-MTX with a DSTAP/DOPE lipid bilayer results in significant stabilization of the material in a release profile in 8 mM PBS at 37 °C (Figure 2.19). The as-synthesized particles are quite unstable, with t1/2 ~ 2 h, but the lipid-coated formulation has a t1/2 ~ 23 h, with complete release at 192 h. The amount of MTX released was determined by UV-Vis spectroscopy. MTX absorbs in the 200-400 nm region (Figure 2.20), and a standard
34
curve was determined using the absorbance at ~305 nm (Absorbance305 nm = 0.0222(µM MTX).
Figure 2.18. Confocal microscopy images of Ru(bpy)3-doped Gd-MTX@Lipid in which the lipid bilayer has been doped with 10 mol% DOPE-FITC. This experiment was conducted to show co-localization of NCP fluorescence with the fluorescence of the lipid bilayer. a) DIC image, b) red fluorescence due to NCPs, c) green fluorescence due to FITC-doped lipid bilayer, and d) overlay of NCP and lipid bilayer fluorescences showing co-localization.
Figure 2.19. Release profile for Gd-MTX@Lipid in 8 mM PBS at 37°C and using 10K mwco dialysis tubing. t1/2: free MTX = 1.5 h, Gd-MTX = 2 h, Gd-MTX@Lipid = 23 h. Complete MTX release from Gd-MTX@Lipid was observed at 143 h.
0 20 40 60 80 100
0 20 40 60 80 100 120 140
MTX Release (%)
Time (h)
Gd‐MTX
Gd‐MTX, 10:1 Part:DSTAP/DOPE
Gd-MTX
35
Figure 2.20. An absorption spectrum for MTX (black), compared to an absorption spectrum for a release profile aliquot from dialysis of Zn-MTX (red). The absorption profile does not change significantly, indicating that MTX remains unchanged under the synthetic conditions used.
The Gd-MTX@Lipid NCPs were rendered an active tumor targeting agent by doping the 1:1 (by mol) DSTAP/DOPE liposomes with 10 mol% of an anisamide (AA)-lipid conjugate, DOPE-AA. Anisamide is a small molecule targeting ligand that is known to target sigma receptors which are overexpressed on a number of epithelial cancer cell lines.19-24 Addition of AA to the liposome formulation did not significantly alter the size of the particles, as Gd-MTX@Lipid-AA has a number average diameter of 76.8 nm, PDI of 0.150, and a ζ potential of 25.3 mV.
2.2.5. Synthesis and Characterization of Gd-Folate NCP
Control vehicles, NCPs that do not contain any cytotoxic agent, were prepared using folic acid, an essential nutrient, instead of MTX. These particles were prepared by a solvothermal method in which GdNO3·6H2O and folic acid were heated in DMF at 80 °C,
230
280
330
380
Wavelength
(nm)
A
b
so
rb
an
36
producing particles that were between 200-300 nm by SEM with a number average diameter of 262 nm by DLS (Figure 2.21). These control vehicles were used to show that in vitro cytotoxicity arises from MTX, not Gd(III) or the lipid formulation.
Figure 2.21. SEM micrograph of Gd-Folate NCPs.
2.2.6. In Vitro Cytotoxicity and Viability Assays
37
Figure 2.22. In vitro viability curves of MTX and Zr-MTX against the CCRF-CEM acute lymphoblastic leukemia cell line over 3 h.
Figure 2.23. In vitro viability curves of MTX and Zr-MTX against the CCRF-CEM acute lymphoblastic leukemia cell line for 48 h.
0 20 40 60 80 100
0 10 20 30 40 50 60
V
iability %
[MTX] (µM)
MTX Zr-MTX
0 0.2 0.4 0.6 0.8 1
0 10 20 30 40
V
iability %
[MTX] (µM)
38
All Gd-MTX formulations were tested against Jurkat cells, an ALL cell line that is known to overexpress sigma receptors.23 This assay was completed over 72 h, and cytotoxicity was determined by the trypan blue exclusion assay (Figures 2.24 and 2.25). As-synthesized Gd-MTX was slightly less cytotoxic than free MTX (IC50 = 34.7 ± 2.5 nM) with an IC50 value of 54.7 ± 2.3 nM. The efficacy of Gd-MTX is not expected to be an improvement over the free drug due to rapid degradation of these unstable NCPs. The lipid-coated formulation showed enhanced efficacy over free MTX with an IC50 = 28.3 ± 0.6 nM, but the AA-modified particles showed an even more, statistically significant, increase in efficacy (IC50 = 23.7 ± 1.5 nM). The enhancement in efficacy of the lipid-coated particles is attributed to the known affinity of cationic lipid bilayers for cell membranes.
Figure 2.24. In vitro cytotoxicity curves for MTX-containing NCPs against Jurkat acute lymphoblastic leukemia cells.
0 20 40 60 80 100
0 0.5 1 1.5
V
iability
%
[MTX] (µM)
MTX Gd-MTX
39
Figure 2.25. IC50 plot of MTX-containing NCPs for a 72 h in vitro cytotoxicity assay against Jurkat ALL cells.
Viability assays testing the effect of Gd-Folate NCPs or free Gd(III) salt was conducted to ensure that the cytotoxicity of Gd-MTX can be attributed to MTX, not the Gd(III) ions or lipid bilayers. Free Gd(NO3)3 salt as well as Gd-Folate and the lipid-coated formulations of Gd-Folate were tested, and no cytotoxic effect was observed (Figure 2.26).
0 10 20 30 40 50 60
MTX Gd-MTX _@Lipid _@Lipid-AA
IC
50
(nM)
40
Figure 2.26. In vitro viability assay testing free Gd(III) and Gd-Folate NCPs, displaying that no cytotoxic effect was observed due to free Gd(III) or the control vehicles. This experiment confirms that the cytotoxicity observed for MTX-containing NCPs is due solely to MTX and no other agent.
2.2.7. Synthesis and Characterization of Ru(bpy)32+-Doped Gd-MTX NCP
Gd-MTX doped with 2.5, 5, or 10 mol% Ru(bpy)32+ were prepared by a similar solvothermal method in which the undoped nanoparticles were prepared. Our previous work has shown that Ru(bpy)23+ is an efficient optical imaging agent,25 and these doped NCPs were prepared for confocal microscopy studies. All doped NCPs were between 100-200 nm in diameter by SEM and TEM (Figure 2.27). No additional weight loss is observed by TGA, presumably because the addition of Ru(bpy)23+ was too low to be detected (Figure 2.28). Gd-MTX doped with 10 mol% Ru(bpy)23+ was used for confocal microscopy. These particles
0 20 40 60 80 100
0 0.5 1 2.5 5 10
V
iability %
[Folate] (µM)
Gd-MTX
_@Lipid
_@Lipid-AA
Gd(III) @Lipid Gd-Folate
41
have a number average diameter of 119.5 nm with a PDI of 0.154 and a ζ potential of -20.6 mV. These particles are 9.6 mol% Ru by ICP-MS, and the presence of Ru(bpy)23+ is evident by fluorescence in which a broad emission peak at ~620 nm is present (Figure 2.29).
Figure 2.27. SEM micrographs of Ru(bpy)32+-doped Gd-MTX with different doping amounts: (a) 2.5 mol%, (b) 5 mol%, (c) 10 mol%.
a) b)
42
Figure 2.28. TGA plot of Gd-MTX doped with 5 mol% Ru(bpy)32+ showing organic weight loss attributed to bpy ligands and MTX.
Figure 2.29. Fluorescence spectrum of Ru(bpy)32+-doped Gd-MTX showing emission from the presence of Ru(bpy)32+ (~620 nm).
0 20 40 60 80 100
0 100 200 300 400 500 600
W
eight %
Temperature (°C)
5mol% RuDye Gd‐MTX
Bare Gd‐MTX
Bare Zr‐RuDye
Ru(bpy)32+-Doped Gd-MTX Gd-MTX
Ru(bpy)32+ Dye
500 550 600 650 700
Emission
Wavelength(nm)
Gd‐MTX
Ru(bpy)3‐doped Gd‐MTX
Gd-MTX
43
Ru(bpy)32+-doped Gd-Folate NCPs were also prepared by a solvothermal synthesis in DMF at 80 °C. These particles fluoresce under a UV lamp and are 150-200 nm by SEM (Figure 2.30). This size is also observed by DLS with a number average diameter of 160.6 nm, PDI of 0.365, and ζ potential of -16.1 mV in 1 mM aq. KCl. These particles are 13.4 mol% Ru by ICP-MS.
Figure 2.30. SEM micrograph of Ru(bpy)32+-doped Gd-Folate NCPs.
2.2.8. Confocal Microscopy
44
and green (FITC) fluorescence is observed for lipid-coated Gd-MTX, but this signal is greatly enhanced in the AA-targeted particles, indicating increased uptake and efficacy of this formulation.
45
When Jurkat cells are incubated with Ru(bpy)32+-doped Gd-Folate NCPs and stained with the AnnexinV-FITC conjugate, red fluorescence is observed, but no green fluorescence from the early apoptosis indicator is observed (Figure 2.32). This control experiment emphasizes that cytotoxicity of this formulation is due to MTX, not Gd3+ or the lipid coating.
46 2.2.9. MR Relaxivities of Gd-MTX NCPs
Gd-MTX and the lipid-coated formulations were probed as potential theranostic agents by taking advantage of the use of Gd(III) as a MRI contrast enhancement agent. Samples of the NCPs were prepared and redispersed in H2O then analyzed on a 3T MR scanner. MR relaxivities (r1 and r2) were analyzed (Figures 2.33, 2.34, 2.35, and 2.36). These values are acceptable for MR contrast agents, as many agents display r1 values between 4-5 mM-1s-1. T1- and T2-weighted images of these formulations show increased contrast with increased concentration of NCPs suspended in H2O. It is likely that the as-synthesized Gd-MTX nanoparticles display higher relaxivities because H2O exchange is impeded by the lipid coatings.
Figure 2.33. MR relaxivity plots for Gd-MTX showing values for r1 and r2. y = 9.0251x + 0.271
R² = 0.9967 y = 32.407x + 0.659
R² = 0.994
0 0.5 1 1.5 2 2.5 3 3.5 4
0 0.025 0.05 0.075 0.1
47
Figure 2.34. MR relaxivity plots for Gd-MTX@Lipid showing values for r1 and r2.
Figure 2.35. MR relaxivity plots for Gd-MTX@Lipid-AA showing values for r1 and r2. y = 4.9743x + 0.273
R² = 0.9904 y = 25.547x + 0.6129
R² = 0.9995
0 1 2 3 4 5 6 7 8 9
0 0.05 0.1 0.15 0.2 0.25 0.3 0.35
T
‐ 1/s
‐ 1[Gd] (mM)
1/T1 1/T2 1/T1 1/T2y = 2.9666x + 0.2643 R² = 0.9909 y = 26.057x + 0.5239
R² = 0.9991
0 1 2 3 4 5 6 7 8 9
0 0.05 0.1 0.15 0.2 0.25 0.3
48
Figure 2.36. T2- (a) and T1- (b) weighted images for Gd-MTX, Gd-MTX@DSTAP/DOPE, and Gd-MTX@DSTAP/DOPE-AA. Varying concentrations increase from left to right.
2.2.10. PEGylation of Gd-MTX NCP
Attempts were made to PEGylate the lipid bilayers of the Gd-MTX formulations as PEGylation is known to enhance circulation of nanomaterials in biological systems.26-30 Two methods were done: post-insertion (in which PEG-lipid is added after lipid coating) and pre-insertion (in which PEG-lipid is added during lipid coating).31 Post-insertion was attempted