THE ROLE OF SET2, TRANSCRIPTION FACTOR RESIDENCE, AND NUCLEOSOME SPACING IN THE DYNAMIC ACCESS OF GENOMIC INFORMATION
Colin Ralston Lickwar
A dissertation submitted to the faculty of the University of North Carolina at Chapel Hill in partial fulfillment of the requirements for the degree of Doctor of Philosophy in the
Curriculum of Genetics and Molecular Biology
Chapel Hill 2012
Approved by:
Jason Lieb, PhD
Pilar Blancafort, PhD
Tim Elston, PhD
Brian Strahl, PhD
ii ©2012
ABSTRACT
COLIN RALSTON LICKWAR: The role of Set2, transcription factor residence, and nucleosome spacing in the dynamic access of genomic information
(Under the direction of Jason D. Lieb, PhD)
DNA is a heteropolymer that serves as a mutable form of storage for genomic
information. Nucleosomes condense genomes by wrapping 147 bp of negatively
charged DNA around a positively charged histone core. Histone modifications and
selective placement of nucleosomes expand and allow for regulated access of the
information content in DNA. Understanding and predicting the placement and
organization of nucleosomes, as well as the dynamics of genome utilization, is therefore
critical for expanding our knowledge of life.
A complex set of machinery regulates RNA polymerase II passage through a
nucleosomal template. Loss of the histone H3K36 methyltransferase, SET2, leads to aberrant (cryptic) transcription initiation from within the coding region of genes due to an
inability to regulate chromatin reassembly following transcription. We used whole
genome microarrays to map and identify sites of aberrant transcription initiation in set2Δ. We developed a statistically principled algorithm to show there is no evidence that
cryptic initiation occurs more frequently in long or infrequently transcribed genes.
I adapted an assay to study the residence dynamics of the S. cerevisiae
transcription factor, Rap1, genome-wide. Rap1 binds with a long residence at highly
iv
low in vitro affinity for the formation of nucleosomes. In contrast, we find that sites with short Rap1 binding typically have high nucleosome occupancy and fast histone turnover.
We propose that an active regulated competition between transcription factors and
nucleosomes can regulate transcription factor residence and function.
The HMGB class of proteins is known to influence the dynamics of nucleosomes
and transcription factors. We mapped the distribution of the major nuclear HMGB
containing proteins by ChIP-seq, genome accessibility using FAIRE-seq, and mapped
nucleosomes using MNase-seq in an HMGB mutant. We identified linker length
differences between several strains. This linker length change allowed us to identify
invariant nucleosome boundaries and test the underlying principles of nucleosome
vi
ACKNOWLEDGMENTS
I would like to thank Dr. Jason Lieb for providing an environment rich with
resources, interesting projects, and engaging science. I am thankful to the members of
my committee (Dr. Pilar Blancafort, Dr. Tim Elston, Dr. Brian Strahl, and Dr. Wei Sun) for
fostering a nurturing environment for my scientific training and personal development. I
would like to thank Dr. Bob Duronio for providing support in my training, and leadership
in the curriculum. I also thank Dr. Terry Magnuson for teaching me very much in a short
amount of time. I am grateful to Sausyty Hermreck and Cara Marlow for always knowing
what was going on. I am especially grateful to all the members of the Lieb lab; I learned
so much from all of you. To all my friends and family I am also indebted.
Chapter II credits: Bhargavi Rao performed Set2 RNA microarray experiments,
the initial analysis of the data, and coordinated the initial development of cryptic
transcript callers. Andrey Shabilan generated the statistically principled cryptic transcript
caller under the direction of Andrew Nobel. Deepak Jah provided insightful Set2
conversation. We thank Jerry Workman and Bing Li for communicating results prior to
publication and for helpful comments on the manuscript. We thank Sean Hanlon, Sevinc
Ercan, and Kelby Kizer for advice on the RNA preparation, and Bill Marlzuff for the use
of equipment.
Chapter III credits: Sean Hanlon initiated work on Rap1 turnover. He generated
a preliminary Rap1 turnover strain with a Tet-off system and performed initial
experiments with Bill Scovell of Bowling Green State University. Sean also guided my
framework for performing the experiments and performed the first time course
experiments with me. Tommy Kaplan and Ollie Rando provided insightful
correspondence as well as access to their turnover model and processed histone H3
data. Jim Mcnally coordinated the collaboration with Florian Mueller, and provided many
insights into the project, the turnover model, and the manuscript. Florian Mueller
provided mathematical, computational and physical expertise and adopted the H3
turnover model for Rap1 with a correction for background. Without him a principled
model to measure Rap1 turnover would not exist. Tim Elston provided initial support for
development of line fitting models. Sheera Adar, Tim Palpant, and Kiri Sunde helped
perform labor-intensive time course experiments. Tim Palpant helped generate
nucleosome positioning heat maps and Rap1 ChIP-Seq peak calls. Kiri Sunde helped
characterize the new turnover strains. Ji Young of Brenda Andrew’s lab generated a
high throughput method for generating turnover strains. I thank A. Leonardo Iniguez and
H. Rosenbaum of Roche Nimblegen for pre-release custom HD4 12-plex microarrays.
Chapter IV credits: Tim Palpant performed almost all Mnase, and ChIP-seq
experiments. I performed FAIRE experiments. I designed and generated the Nhp6a/b
rescue construct, transformed the strains and performed the Mnase with Tim Palpant.
Tim Palpant independently developed a substantial suite of tools to analyze and
visualize nucleosome positioning, FAIRE, and ChIP sequencing data, which can be
found at http://palpant.us/java-genomics-toolkit/ and
https://github.com/timpalpant/java-genomics-toolkit. The project would not be possible without these tools and Tim’s
analysis. Tim generated the statistical positioning model for predicting nucleosome
positioning in strains with different linker lengths. I conceptualized the initial parameters
to model the FAIRE signal and Tim Palpant developed the model and applied more
viii
TABLE OF CONTENTS
LIST OF TABLES ... xi
LIST OF FIGURES ... xii
LIST OF ABBREVIATIONS ... xiv
Chapter I. INTRODUCTION ... 1
Nucleosome positioning and occupancy in cell populations ... 2
Statistical positioning of nucleosomes ... 3
DNA sequence influences nucleosome positioning ... 4
Chromatin remodelers position nucleosomes and regulate access to DNA ... 4
Linker length can influence the position of the majority of nucleosomes ... 6
Histone H1 binds linker DNA and increases nucleosome spacing ... 7
The 30 nm fiber and DNA helical repeat influence the formation of nucleosome arrays ... 7
HMGB proteins bend DNA and increase nucleosome accessibility ... 8
Dynamic nucleosome accessibility selectively partitions genomic information ... 9
Nucleosome mediated regulation of transcription factor binding ... 9
Transcription factor residence dynamics are largely unexplored ... 10
Competition ChIP can measure transcription factor residency genome-wide ... 11
Chromatin impedes transcription elongation ... 11
II. THE SET2/RPD3S PATHWAY SUPPRESSES CRYPTIC TRANSCRIPTION WITHOUT REGARD TO GENE LENGTH OR TRANSCRIPTION FREQUENCY ... 13
RESULTS ... 14
Systematic ascertainment bias in previous characterizations of cryptic transcription may have influenced data analysis ... 14
At the level of raw data, new higher-resolution maps of Set2-dependent cryptic initiation are consistent with previous maps ... 16
An ascertainment bias makes detection of cryptic transcripts easier in longer
genes ... 19
Controlling probe-number ascertainment bias eliminates the relationship between cryptic initiation events and gene length ... 20
Sites of cryptic initiation are distributed randomly with regard to gene length ... 22
Sites of cryptic initiation are distributed randomly with regard to transcription rate ... 22
The ascertainment biases reported here are likely widespread ... 24
Identification of factors which lead to cryptic transcript initiation sites in set2∆ ... 24
DISCUSSION ... 26
MATERIALS AND METHODS ... 28
III. GENOME-WIDE PROTEIN-DNA BINDING DYNAMICS SUGGEST A MOLECULAR CLUTCH FOR TRANSCRIPTION FACTOR FUNCTION ... 32
RESULTS ... 34
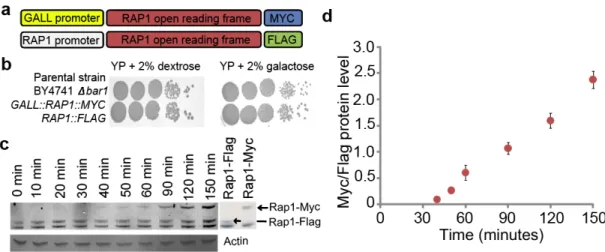
An experimental system to measure transcription factor binding dynamics ... 34
A quantitative model for transcription factor binding turnover and residence time ... 36
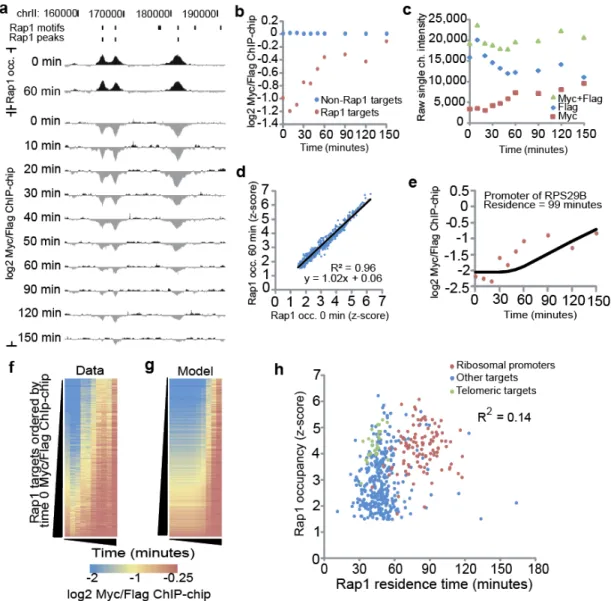
Efficient transcriptional activation is associated with stable Rap1 binding while lower transcript production is associated with treadmilling ... 37
Productive RNA Pol II recruitment is associated with slow Rap1 binding turnover ... 37
Histone acetyltransferase recruitment and histone acetylation are linked to stable Rap1 binding ... 39
Despite high Rap1 occupancy, sites of Rap1 treadmilling are more highly occupied by nucleosomes ... 40
Where Rap1 treadmills, so do nucleosomes ... 42
Weak Rap1 DNA sequence motifs are associated with treadmilling ... 42
DISCUSSION ... 45
Regulation of transcription factor function by nucleosome-mediated control of binding dynamics ... 45
The disparity between in vitro and in vivo residence times of transcription factors ... 49
The disconnection between residence and occupancy ... 50
Testing the transcription factor turnover model ... 51
x
Conclusion ... 61
SUPPLEMENTARY TEXT ... 64
MATERIALS AND METHODS ... 84
IV. GENOME-WIDE DIFFERENCES IN NUCLEOSOME SPACING REVEAL PRINCIPLES OF NUCLEOSOME POSITIONING ... 94
RESULTS ... 103
Nucleosome spacing is compressed in coding regions in nhp6a/b∆ ... 103
Change in linker length in nhp6a/b∆ is strain specific and cannot be rescued by re-addition of NHP6A/B ... 107
Introns may disconnect protein gene size from nucleosome array lengths ... 107
Nucleosome spacing is variable in promoters ... 109
Loss of NHP6A/B results in increased mRNA signal over introns ... 114
HMGB proteins are highly enriched in open chromatin regions ... 115
How are HMGB proteins targeted to DNA? ... 118
DISCUSSION ... 122
Current models for nucleosome positioning ... 122
What controls linker length? ... 124
Nucleosome spacing in promoters ... 125
The relationship between nucleosome positioning and FAIRE ... 125
The role of HMGB proteins in nucleosome accessibility ... 127
MATERIALS AND METHODS ... 129
V. THE NATURE OF NUCLEOSOME POSITIONING ... 135
APPENDIX A ... 146
A detailed protocol for galactose-induced competition ChIP ... 146
LIST OF TABLES
xii
LIST OF FIGURES
Figure 1-1. Current genome-wide maps of nucleosmes represent an average
of the population assayed. ... 3
Figure 1-2. A canonical nucleosome organization surrounding coding regions in S. cerevisiae. ... 5 Figure 2-1. Detection of cryptic initiation sites in S. cerevisiae strains lacking Set2 ... 17 Figure 2-2. Cryptic initiation events occur without regard to gene length. ... 21
Figure 2-3. Cryptic initiation events occur without regard to transcriptional
frequency. ... 23
Figure 2-4. The distribution of transcription related components relative to the +1
nucleosome. ... 25
Figure 2-5. Anecdotal evidence for the formation of new boundaries at
sites of cryptic initation in set2∆. ... 27
Figure 3-1. Development of transcription factor competition-ChIP in yeast. ... 36
Figure 3-2. Rap1-bound sites exhibit distinct replacement dynamics. ... 38
Figure 3-3. RNA Pol II recruitment, mRNA production, and histone acetyltransferase recruitment is associated with long Rap1
residence. ... 41
Figure 3-4. Evidence for competition between Rap1 and nucleosomes. ... 44
Figure 3-5. A three-state model for transcription factor binding dynamics. ... 47
Figure 3-6. Addition of .75M NaCl induces the environmental stress
transcriptional response during Rap1 turnover time course. ... 54
Figure 3-7. Following osmotic stress total Rap1 occupancy decreases then
recovers to near normal levels. ... 56
Figure 3-8. Differences in Myc/Flag occur simutlaneously with changes in
Rap1 occupancy. ... 57
Figure 3-9. Plate growth assay of turnover strains A. ... 60
Figure 3-10. Plate growth assay of turnover strains B. ... 60
Figure 3-11. Preliminary screen for presence of two differentially Myc and Flag
tagged copies in various turnover strains. ... 63
Figure 3-12. Rpb3 and Cbf1 turnover strains are suitable for ChIP. ... 63
Figure 4-2. Linker length is decreased ~3bp in nhp6, resulting in a cumulative
shift towards 5’ and 3’ boundaries. ... 106
Figure 4-3. Bistable genes acquire additional nucleosomes in nhp6. ... 108 Figure 4-4. Linker length changes may be strain-specific rather than the
direct result of Nhp6A and Nhp6b deletion. ... 110
Figure 4-5. Reintroduction of NHP6A and NHP6B genes rescues the nhp6a/b∆
slow growth phenotype, but not the compressed linker length. ... 111
Figure 4-6. Introns may decouple nucleosome array length from gene size. ... 112
Figure 4-7. FAIRE and nucleosome occupancy is anti-correlated. ... 114
Figure 4-8. NFR boundaries are defined precisely by FAIRE and sequence
characteristics. ... 116
Figure 4-9. Deletion of Nhp6a and Nhp6b alters gene expression modestly and
results in a splicing defect. ... 117
Figure 4-10. HMGB proteins bind promoters, often coordinate with Rap1 ... 118
Figure 4-11. HMGB proteins are in enriched in open chromatin. ... 120
Figure 4-12. Nhp6a and Nhp6b have high affinity for sequence specificity for
AT rich sequences. ... 121
Figure 5-1. The simultaneous influence of many components on the
organization of nucleosome positioning. ... 136
Figure 5-2. A hypothetical representation of the evolutionary constraints
xiv
LIST OF ABBREVIATIONS
BP BASE PAIR(S)
ChIP CHROMATIN IMMUNOPRECIPITATION
ChIP-chip CHROMATIN IMMUNOPRECIPITATION ON DNA MICROARRAYS
ChIP-seq CHROMATIN IMMUNOPRECIPITATION WITH NEXT GENERATION
SEQUENCING
H3K36me HISTONE H3 LYSINE 36 METHYLATION
HMGB HIGH MOBILITY GROUP BOX
HSF HEAT SHOCK FACTOR
KB KILOBASE
MB MEGABASE
MNase MICROCOCCAL NUCLEASE
NFR NUCLEOSOME FREE REGION
nm NANOMETER
PCR POLYMERASE CHAIN REACTION
PWM POSITION WEIGHT MATRIX
Rap1 REPRESSOR ACTIVATOR PROTEIN
RNA Pol II RNA POLYMERASE II
TF TRANSCRIPTION FACTOR
TN TERMINAL NUCLEOSOME
CHAPTER I
INTRODUCTION
Deoxyribonucleic acid (DNA) is a polymer that serves as a mutable form of
storage for hereditary information. The complete collection of an organism’s hereditary
genetic information is called a genome. To successfully store genomic information,
organisms must deal with packaging the stiff negatively charged DNA fiber into a small
space, while maintaining the ability to access the information contained in DNA rapidly.
Eukaryotic genomes can range from up to 1011 bp of DNA in plants1 to only ~5X10⁵ bp.
in Chorarachniophytes and Cryptomonads2. Human genomes are comprised of 3X10⁹
bp3, and the model organism, Saccharomyces cerevisiae’s, genome is 1.2X10⁷ bp4. Despite these broad variations in genome size, the fundamental form of packaging and
compaction in eukaryotes is the initial wrapping of 147 bp of DNA 1.7 superhelical turns
around a positively charged histone core to form the nucleosome5. Nucleosomes are
separated by an intervening piece of linker DNA, which can vary in length6. As a result,
nucleosomes can cover from 60 to 90 percent of the genome7,8.
Nucleosomes restrict access to particular regions of the genome and allow for
regulation of process such as transcription factor binding and gene expression. The
dynamic access to the information encoded in genomes is central to development and a
response to the environment. As a result, a large cohort of chromatin proteins work to
modulate nucleosome positioning and accessibility, and ultimately, increase the
information capacity of DNA9. For these reasons, the principles and mechanisms that
2
Nucleosome positioning and occupancy in cell populations
Every nucleosome is uniquely positioned at a particular genomic position in each
nucleus. However, in a cell population, nucleosomes are not always positioned at the
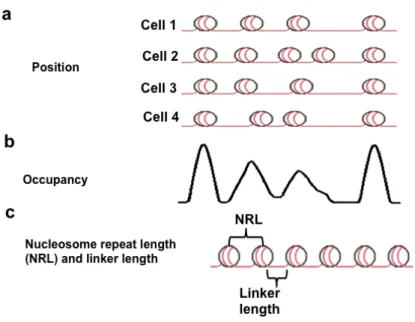
same precise region of the genome (Figure 1-1a). Currently, researchers rely on
genome-wide nucleosome maps generated from the average occupancy of individual
nucleosomes within a population. These nucleosome occupancy maps contain no
specific information on how neighboring nucleosomes are positioned within a unique
nucleus10-12 (Figure 1-1b,c). In addition, these average occupancy maps are often used
to identify the predominant position of nucleosomes within the population. This
complicates understanding of the actual principles that position nucleosomes on a single
genome.
Despite limitations in defining nucleosome positioning, a canonical organization
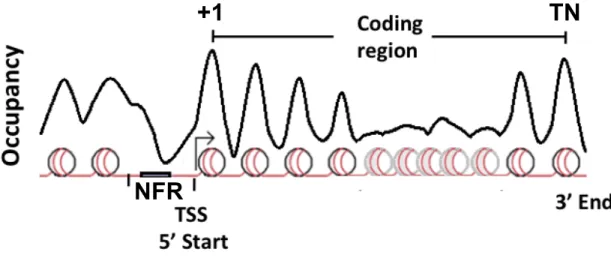
for nucleosome occupancy surrounding coding regions has been identified in S. cerevisiae and many other eukaryotes13 (Figure 1-2). In a population of cells, consistently positioned nucleosomes reside at the 5’ beginning (+1) and 3’ end of coding
regions (TN)14,15. On average, nucleosomes are spaced regularly with regard to this +1
nucleosome into the body of the gene16. However, nucleosomes within the middle of
coding regions frequently become inconsistently positioned within the population12.
Consistent positioning of nucleosomes at either end of coding regions is directed by
specific nucleosome boundaries, which generate nucleosome free regions (NFRs) and
force neighboring regions to have well-positioned nucleosomes12,14-17. NFRs at the 5’
end of genes also allow for regulated access to sequence specific transcription factors
and other transcription initiation components18. Similarly, the 3’ nucleosome depleted
Figure 1-1. Current genome-wide maps of nucleosmes represent an average of the population assayed. (a) While the position of each nucleosome is distinct in each cell, positions are not uniform across populations. (b)The average of this signal is defined as the nucleosome occupancy. (c) From nucleosome occupancy the average linker length between nucleosome and nuclesome repeat length (nucleosome to nucleosome distance) can be calculated.
Recent studies to identify the components that contribute to the positioning of
nucleosomes and nucleosome boundaries have identified many factors, which appear to
work in concert. These include an underlying steric hindrance model termed statistical
positioning14,16, DNA sequence10, ATP dependent chromatin remodelers12,20,21, DNA
binding proteins22, linker proteins6,23,24, and higher order chromatin structure, such as the
30 nm fiber25,26.
Statistical positioning of nucleosomes
In the 1980’s a statistical positioning hypothesis was put forth as an explanation for how
nucleosomes are positioned16,27. In its simplest form, statistical positioning is the idea
4
positioning of nucleosomes is then just the result of nucleosome density, steric
hindrance, and regions of the DNA that function as boundaries and can exclude
nucleosome formation. Quantitative models of statistical positioning have performed
well in predicting nucleosome positioning14,17, though recently, DNA sequence and
chromatin remodelers have been proposed to account for this overlap12.
DNA sequence influences nucleosome positioning
Each unique DNA sequence combination results in an altered capacity to form a
nucleosome10. AA/TT dinucleotides with 10bp periodicity, offset by 5 bp with 10 bp
periodic GC dinucleotides, preferentially form nucleosomes due to their intrinsic
curvature28,29. In contrast, sequences, such as A/T rich stretches, can exclude
nucleosome formation10,30-32. It has been proposed that Poly (dA:dT) DNA is especially
stiff, and therefore is poorly incorporated into the curved structure required for
nucleosome formation 31-33. Poly(dA:dT) stretches serve as major determinants of NFRs
in yeast34,35. However, the extent to which sequence actually contributes to nucleosome
positioning in vivo has been debated,10,11 and recent studies suggest the positioning of nucleosomes is dictated largely by chromatin remodelers12,20.
Chromatin remodelers position nucleosomes and regulate access to DNA
Chromatin remodelers play a critical role in the organization and access of genetic
information36. They function generally by using ATP to physically move, or disassemble
restrictive nucleosomes36. These actions allow for gated access to transcription factor
binding and transcription through a chromatin template18. Studies adding whole cell
Figure 1-2. A canonical nucleosome organization surrounding coding regions in
S. cerevisiae. Well-positioned nucleosomes flank the beginning (+1) and end of coding regions (TN). Nucleosomes become less well-positioned in the body of the coding region. Upstream of the +1 nucleosome a nucleosome free region (NFR) is thought to serve as a platform for the coordination of polymerase assembly and sequence-specific transcription factor binding.
that the periodicity and phasing of nucleosomes is ATP-dependent12. This suggests
that ATP-dependent chromatin remodelers can overcome nucleosome positioning that
results from an inherent sequence-based mechanism, and that statistical positioning
does not influence nucleosome positioning12.
Indeed, chromatin remodelers play specialized roles in the positioning of
nucleosomes. Isw2 may reinforce boundary positioned nucleosomes by stabilizing the
invariantly-positioned nucleosomes near the transcriptional start site of genes37.
Alternatively, chromatin remodelers can promote boundaries by excluding nucleosomes.
The RSC complex has been shown to have a strong influence in generating nucleosome
excluding boundaries/NFRs at promoters21,38,39. Deposition of Htz1 by the SWR1
complex at promoter nucleosomes, may further define nucleosomes surrounding
boundaries40.
NFR
6
The chromatin remodeler family, ISWI, functions to space nucleosomes an equal
distance apart41,42. In S. cerevisiae, deletion of ISW1 leads to shifts of nucleosome positioning primarily in coding regions41. The targeting of the Isw1 complex may be
mediated by its association with Ioc4p, a PWWP motif containing protein, which interacts
with the coding-region-specific H3k36me3 histone modification43. This provides a
plausible mechanism for how relatively equal nucleosome spacing in coding regions is
exclusively maintained (Figure 1-2). Furthermore, loss of ISW1, ISW2 and CHD1 results in major changes in nucleosome occupancy in gene coding regions20. While the
versatility of chromatin remodelers in providing a dynamic role in chromatin organization
is attractive, it is not entirely clear if they specify the density of nucleosomes or the linker
distance between each adjacent nucleosomes genome-wide.
Linker length can influence the position of the majority of nucleosomes
Nucleosomes are spaced by an intervening stretch of linker DNA (Figure 1-1a,c).
Linker DNA length and the nucleosome repeat length can vary within an individual cell,
between developmental stage, cell type, and between organisms6,44. Eukaryotic
nucleosome repeat lengths have been shown to range from a minimum of 155 bp in
Schizosaccharomyces pombe8 to ~240 bp in Thyone briareus7. Within the same human
individual, average linker length varied from 47 bp (194 bp repeat length) in granulocytes
to a 57 bp linker (204 bp repeat length) in CD4+ T cells6. Furthermore, euchromatic and
heterochromatic regions within CD4+ T cells showed a range of linker lengths,
presumably within the same nucleus6. Despite having such a profound impact on
nucleosome positioning genome-wide, little is known about the regulation and
Histone H1 binds linker DNA and increases nucleosome spacing
In eukaryotes, one or a subset of the linker histone H1s46 bind to linker DNA causing a
physical or electrostatic barrier to close nucleosome spacing, without the use of ATP47.
Though the HHO1 gene is considered by some to be a bona fide histone H1 homolog in
S. cerevisiae48, attempts to confirm Hho1 is a canonical H1 protein have been ambiguous49. However, like canonical histone H1, Hho1 forms a complex with
di-nucleosomes48, is nuclear50, and contains key binding residues conserved with the
globular domain of Histone H5 from chicken51. Hho1 does not, however, contain a
canonical C-terminal tail52,53. In S. cerevisiae, there are also fewer molecules of H1 relative to nucleosomes than in other eukaryotes44, varying from 1 in 454 to 1 in 37
molecules55. However, a kinetic pause during MNase digestion leaves a protected
fragment of 168 bp when Hho1 is present at a 1:1 ratio with nucleosomes in H1-stripped
HeLa cell chromatin48. Despite this property, loss of HHO1 in S. cerevisiae does not show a detectable change in dinucleosome ladder length following MNase digestion as
compared to Wild type48, suggesting that the influence of Hho1 over linker length may be
minimal in certain contexts in vivo56. In other species, the positive relationship between
histone H1 concentration and linker length is apparent6,23,44,47.
The 30 nm fiber and DNA helical repeat influence the formation of nucleosome
arrays
Histone H1 and some chromatin remodelers work to generate a consistent spacing
between nucleosomes42,44. A primary consequence of a consistent regulated repeat
length is the formation of higher order chromatin organizations such as the 30 nm
fiber26,45,57. The 30 nm fiber organization further condenses chromatin by generating
stacked arrays of nucleosomes45. The precise structure of the 30nm fiber is unknown
8
solenoid with bent linker DNA and a two start zigzag model with straight linker DNA26,45.
Both models rely on a roughly consistent spacing of nucleosomes.
For repeating nucleosome arrays to form consistent higher order chromatin
structures, they also require the coordination of the DNA polymer. The helical twist of
DNA creates one full turn every ~10.5 bp58. As linker length increases, each 1 bp change
results in a ~35° rotation of an adjacent nucleosome around the helical axis59. For this
reason, it has been proposed that nucleosome repeat length is generally limited to
10n+5 bp, ensuring that the ~10 bp helical twist of DNA can result in the formation of a
consistent, stable, higher order chromatin structure25,59 Both the linker length and its
relative flexibility or confirmation then becomes crucial for the regulation and
organization of chromatin.
HMGB proteins bend DNA and increase nucleosome accessibility
Though nucleosome repeat length seems to be highly regulated 6,44, the only other
protein known to alter linker length on a broad scale is the Drosophila high mobility
group box (HMGB) protein, HMG-D24. H1 and HMGB proteins may perform opposing
functions in the regulation of nucleosome accessibility on individual nucleosomes 60 and
broad chromatin scale61 by competing for binding to nucleosomal DNA62. HMGB proteins
are small, abundant, non-histone chromatin proteins conserved throughout eukaryotes61.
They typically bind in a sequence non-specific manner to both naked DNA and
nucleosomes61. HMGB proteins function to bend DNA, increase accessibility to
nucleosomes, and accelerate the binding turnover of DNA-associated proteins60,61,63,64.
In yeast, six nuclear HMGB proteins exist; Nhp6a, Nhp6b, Hmo1, Ixr1, Nhp10,
and the sequence specific transcription factor, Rox165. Nhp6a and Nhp6b are two highly
similar model HMGB proteins65. They interact genetically with many chromatin
mediated access to DNA65. As a result, understanding how and where HMGB proteins
function may provide an additional layer of nucleosome accessibility information that can
be overlaid on nucleosome positioning maps.
Dynamic nucleosome accessibility selectively partitions genomic information
Dynamic placement of nucleosomes allows for the temporal regulation of genomic
information. Often this regulation manifests at the level of gene expression. Recent
genome-wide studies using FAIRE66, DNase67 and MNase6 have provided powerful
insights into what portion of the genome is dynamically accessible. Cumulatively,
studies have identified that nucleosomes provide a substantial barrier to transcription
factor binding68, transcription69, and DNA repair70.
Nucleosome mediated regulation of transcription factor binding
The S. cerevisiae, PHO5 promoter, exemplifies a model system for nucleosome-mediated regulation of transcription factor binding and transcriptional regulation68. The
PHO5 gene is expressed in low phosphate conditions and repressed under high phosphate conditions. During repression, promoter nucleosomes are positioned over
the TATA box and the binding site for the sequence-specific transcription factor, Pho4, at
the PHO5 promoter. This configuration prevents Pho4 binding and transcriptional activation70,71. Switching to low phosphate conditions, recruits the chromatin remodelers,
SWI/SNF and INO80, evicting nucleosomes from the PHO5 promoter, allowing Pho4 to bind and activate PHO5 transcription68,72.
While this model provides a plausible mechanism for regulation of most genes,
far more complex and subtle mechanisms for regulating the nature of transcription factor
access, and ultimately, the amount of transcription have been discovered71,73. Factors
10
long range interactions76, nucleosome modifications77,78, nucleosome competition73,79
and nucleosome co-occupancy80 can all regulate how often transcription factors gain
access to DNA and perform their function.
Transcription factor residence dynamics are largely unexplored
Chromatin immuno-precipitation (ChIP) based assays have provided a powerful
method for defining the presence or absence of specific transcription factors and other
proteins at locations across the genome81. However, because they provide a snapshot
average of a cell population, they are essentially blind to how long proteins reside on
DNA. As a result, the length of transcription factor residence has been difficult to quantify
genome-wide82. Fluorescence recovery after photobleaching (FRAP) provides high
temporal resolution for transcription factor binding dynamics, but its utility is frequently
limited to relatively few loci with sufficient fluorescent intensity83-87. Furthermore, foci are
often generated through the introduction of artificial arrays of binding sites86.
Though many transcription factors have relatively long residence (10+ minutes)
on DNA in vitro, transcription factors often exhibit substantially faster dynamics in vivo as measured by FRAP85,86. For example, the glucocorticoid receptor has an in vitro residence time of 90 minutes88. In vivo, however, glucocorticoid receptor exhibits exceptionally short residence on the range of several seconds85,86. Despite the apparent
transient interaction of GR in vivo, relatively long binding events are still associated with more highly transcribed loci85,89. Similarly, FRAP of heat shock factor (HSF) in
Drosophila is bound longer under activating heat shock conditions84. This leads generally to a model where longer binding of transcription factors is associated with
more transcription, presumably through the increased probability in recruiting or
stabilizing transcription initiation complexes30. However, it is not clear what causes the
Competition ChIP can measure transcription factor residency genome-wide
Recently, competition ChIP has provided the ability to measure residence dynamics of
factors on DNA on a genome-wide and site-specific scale79,90-95. This strategy relies on a
strain containing two copies of the same DNA-associated factor. One copy is tagged
with a unique epitope and expressed constitutively, while the second copy is tagged with
a different unique epitope and is inducibly expressed. Following induction of the second
copy, the relative ratio of each isoform is measured genome-wide by chip or
ChIP-seq. The dynamics at each locus can than be measured genome-wide based on how
quickly they incorporate the second copy of the DNA-binding factor. Preliminary studies
have found that chromatin and nucleosomes are major regulators of transcription factor
dynamics79,90.
Chromatin impedes transcription elongation
Following the initiation of transcription by TFs, RNA polymerase II (RNA Pol II) must
traverse a chromatin template to transcribe DNA. Nucleosomes, again, impede this
process96,97. However, a complex system of machinery helps regulate RNA Pol II
transcription through chromatin18. The histone acetyltransferase complex, SAGA,
promotes transcription by acetylating nucleosomes in front of RNA Pol II98. Following
transcription, nucleosomes are then stabilized via deacetylation by the Set2/Rpd3S
pathway. Set2 is a histone methyltransferase that binds the CTD of elongating
polymerase and specifically methylates histone H3 on lysine 36 (H3K36me)99,100.
H3K36me recruits the Rpd3S complex, which deacetylates nucleosomes, resulting in
generally closed chromatin confirmation that is resistant to access101,102. Deletion of
12
organization of chromatin is critical to ensure the dynamic regulation of genomic
CHAPTER II
THE SET2/RPD3S PATHWAY SUPPRESSES CRYPTIC TRANSCRIPTION WITHOUT
REGARD TO GENE LENGTH OR TRANSCRIPTION FREQUENCY104
A primary function of eukaryotic genomes is to serve as the template for RNA
transcripts that encode proteins. The exact location along the DNA where these
transcripts initiate, and how frequently they are initiated, is highly regulated18,96,105. An
important component of directing initiation events to the 5′ end of genes is regulating
chromatin in such a way that a more open configuration is situated at the 5′ end, while
DNA downstream of the promoter is less accessible to transcription factors37,106,107. If
transcription-coupled chromatin remodeling is perturbed, as occurs in strains harboring
mutations in the genes encoding Spt6, Spt16, and components of the Set2/Rpd3S
pathway, inappropriate transcriptional initiation is found to occur at places within
protein-coding regions101-103,108-110. Therefore, the precise organization of chromatin along
transcription units is critical to directing transcription factors and RNA polymerase II
(RNA Pol II) to appropriate start sites within genes18,111-113.
The Set2 (Kmt3) enzyme methylates H3K36 in RNA Pol II transcribed portions of
the genome, and is targeted to genes through its association with the phosphorylated
C-Terminal Domain of the elongating RNA polymerase99,100,114-117. Methylated H3K36
residues are then recognized by the Eaf3 subunit of the Rpd3S complex, leading to
deacetylaytion of local histones by Rpd3101,102. This deacetylation is hypothesized to be
important for maintaining the integrity of chromatin following transcription, thereby
inhibiting the assembly of transcription factors at inappropriate or “cryptic” sites within
14
inappropriate transcripts arise from within coding regions. The origin and potential
function of these cryptic initiation sites has been the subject of intense investigation. One
foundational study concluded that “cryptic” transcription occurs preferentially in long
genes and in genes that are infrequently transcribed103. These conclusions suggest that
particular gene types are more dependent on the Set2/Rpd3S pathway for their function
than others. If true, this conclusion would imply that this class of genes is under a special
selective pressure to suppress cryptic transcription, with potentially wide-ranging
implications for the evolution of eukaryotic genomes. Here, we performed new
experiments to re-examine the findings of earlier studies. We conclude that the “cryptic”
transcription normally suppressed by the Set2/Rpd3S pathway occurs throughout the
genome and does not appear to be associated either positively or negatively with gene
length or transcriptional frequency.
RESULTS
Systematic ascertainment bias in previous characterizations of cryptic
transcription may have influenced data analysis
It has been reported that longer genes, and genes that are infrequently transcribed, are
particularly dependent on a mechanism of chromatin-mediated protection against cryptic
transcription103. To identify genes that relied on the Set2/Rpd3S pathway to suppress
cryptic transcription, Li et al. directly compared RNA prepared from set2∆ and wild-type strains using DNA microarrays. The authors then predicted the occurrence of cryptic
transcripts by comparing the ratio of probe values measured at the 5′ end of the gene to
the ratio of probe values at the 3′ end of the gene. A higher ratio at the 3′ end indicated
an aberrant transcript that initiated somewhere downstream of the natural 5′ promoter.
transcription occurs preferentially in long genes, and in genes that are infrequently
transcribed.
However, the previous experiments and analyses did not account for several
important factors in collecting and analyzing the data. First, if cryptic transcription occurs
at random along the genome, then it is more likely to occur in longer genes. Second, by
the same reasoning, longer genes are more likely to contain multiple cryptic initiation
sites. This would make microarray detection of cryptic initiation easier for longer genes,
especially when the number of probes per gene is low, because multiple initiation events
may be detected and interpreted as a single event. Third, a cryptic initiation event that is
flanked on either side by a larger number of microarray probes, as occurs in longer
genes, will be easier to detect because more measurements are taken on either side of
the initiation event. Finally, cryptic transcription is inherently easier to detect on genes
that are transcribed at low levels119. Consider two equally sized genes, both of which
have a cryptic promoter in the same position along the gene. In both cases, assume that
cryptic promoter produces 5 mRNAs per hour. However, one of the genes is transcribed
from its natural promoter at 1 mRNA per hour, and the other is transcribed at 50 mRNAs
per hour. Assuming equal mRNA stabilities, the ratio produced at the 3′ end by the
cryptic transcript of the highly expressed gene will be 55/50 = 1.1, while the ratio at the 3′
end of the infrequently transcribed gene will be 6/1 = 6. Therefore cryptic transcription
that occurs in frequently transcribed genes (ratio 1.1) is much more difficult to detect
than a cryptic promoter of equal strength from an infrequently transcribed gene (ratio 6).
This would be especially true if the level of transcription at a given cryptic promoter is
generally independent of the level of transcription from the natural promoter, as appears
16
Given these potential biases, we were motivated to revisit the previous
experiments with a higher-resolution detection platform, and to develop an analysis
method that explicitly accounted for the confounding factors described above.
At the level of raw data, new higher-resolution maps of Set2-dependent cryptic
initiation are consistent with previous maps
As in the previous study, we prepared RNA from set2∆ and wild-type strains, and labeled them for direct comparison through microarray hybridization (Materials and
Methods). In our case, the samples were applied to DNA microarrays containing
385,000 probes, which corresponds to an average start-to-start probe spacing of 31 bp,
and an average of 51 probes per open reading frame (ORF). In the previous
experiments, the arrays contained 40,174 probes, which corresponds to an average
start-to-start spacing of 261 bp and an average of 4.6 probes per ORF. The higher
resolution in the new study is critical: in the previous study 676 ORFs contained only a
single probe, meaning that it was impossible to detect cryptic transcription in those
genes, and 983 contained only two probes, meaning a call would be dependent on the
value from a single probe. The higher resolution of our data afforded us the opportunity
to call multiple cryptic initiation events within a single gene, rather than being limited to
identifying genes in which one or more initiation events may have occurred. We
therefore employed a statistically principled change-point detection algorithm to identify
the step-like transitions in the log intensity ratios across a transcription unit120.These
“transitions” represent putative cryptic initiation events.
The algorithm operates on a gene-by-gene basis, and in a sequential fashion to
detect the existence and location of potential cryptic initiation events. At each probe
within a gene, it compares the measured values (Z-scores) to the left and the right of the
pre-defined significance threshold (for the given gene length), the location at which the
maximum is achieved is identified as a transition point. The search procedure is then
recursively applied to the observations lying to the left and to the right of the transition
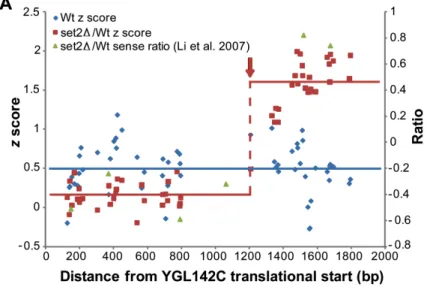
Figure 2-1. Detection of cryptic initiation sites in S. cerevisiae strains lacking Set2 (A) YGL142C exhibits cryptic initiation in the set2∆ strain (red, supF 29.7), but not wild-type (blue). Plotted along the length of YGL142C are z scores of wild type (Wt) RNA raw probe intensity values (blue); set2∆ RNA/Wt RNA (red) and set2∆/Wt ratios from Li et al. 2007 (green). The transition probe detected by our algorithm is marked by a dashed red line and red arrow. The solid lines represent the average z score for Wt (blue) and
18
point. Further details of the algorithm and the scaled supF statistic are presented in
Materials andMethods.
We selected two significance thresholds which led to family-wise error rates of
roughly 10-10 and 10-26, and identified 1193 and 429 genes, respectively, with at least
one cryptic initiation event (Table S1121). Individual genes identified by the algorithm as
containing cryptic initiation events typically exhibit internal transitions that are clear by
visual inspection (Figure 2-1A). Furthermore, genes characterized previously as
containing cryptic transcripts in set2∆ strains, including FLO8 (supF = 3.62) STE11
(supF = 9.02) and PCA1 (supF = 70.9) were identified by our algorithm. Using the more stringent cutoff, 59% of the genes we identified were identified previously as containing a
cryptic initiation event103. We find this concordance striking, especially because the
earlier study made use of a different microarray platform, a different RNA labeling
method, and a different method of identifying cryptic initiation sites (Figure 2-1B).
Indeed, examination of individual loci reveals that the raw data from this study and the
previous study are consistent with each other (Figure 2-1A). The concordance of our
raw data with the raw data from the lower-resolution study, along with the utility of our
data in the identification of genes previously characterized as containing cryptic
transcripts, provides support for our experimental design, analysis methods, and
More cryptic initiation sites are detected in long genes, and these cannot be
accounted for solely by correcting for gene length
Previous studies have concluded that longer genes are especially prone to cryptic
transcription upon deletion of SET2103. This conclusion was based on the observation that long genes were more likely to be identified as containing a cryptic promoter than
short genes. To determine if this observation could be explained solely by the fact that
longer genes afford more opportunity for a cryptic event to occur, we grouped all genes
according to size. For each group, we then calculated the rate of cryptic initiation
(measured in transitions per base pair, Figure 2-2A). Measuring the rate of transitions,
rather than the absolute number of transitions, for genes binned by length is a simple
way to correct for gene length. The positive correlation between gene length and the rate
of transitions per base shows that transitions are indeed detected more often in the
context of longer genes, and that the additional transitions detected in long genes cannot
be accounted for simply by correcting for gene length.
An ascertainment bias makes detection of cryptic transcripts easier in longer
genes
Any method for change-point detection, in this case applied to cryptic transcription, will
have greater power to identify a transition event that is flanked on either side by a large
number of microarray probes. Thus in small genes, which are represented by fewer
probes, transitions are more difficult to detect. We wondered if this ascertainment bias
might explain the observed higher rate of cryptic transcript detection in longer genes. To
investigate this, we took all of the cryptic initiation sites we detected, and computationally
reduced the number of probes surrounding each transition. In each case, this was
accomplished by examining a shrinking window centered on each transition point.
20
the shrinking window was applied, statistical confidence was reduced, often below our
selected cutoffs, as the window size approached 500 bp (Figure 2-2B-E).
We conclude that our method, and indeed any statistically-principled method for
cryptic initiation analysis using discrete expression-based probes, can more readily
identify sites of cryptic initiation in long genes, where more probes flank every putative
site. As a result, a cryptic initiation site of a given magnitude is more likely to be detected
in longer genes containing many probes than in shorter genes with relatively few probes.
Controlling probe-number ascertainment bias eliminates the relationship between
cryptic initiation events and gene length
If long genes truly contain more sites of cryptic initiation than short genes, those
additional sites of initiation should still be detected when long and short genes are
placed on equal footing with regard to detection. To test this, for each gene over 500 bp
in length, we artificially broke that gene into as many non-redundant approximately 500
bp ”subgenes” as possible (Materials and Methods). We then re-ran our detection
algorithm on these newly created “subgenes”, which were of relatively uniform length. To
see if longer genes really harbored more cryptic initiation events, we computationally
stitched the genes back together, binned the genes according to their length, and again
calculated the rate of cryptic initiations per base. This treatment of the data holds
constant both the probe-number bias and the bias caused by multiple cryptic initiations
in the same gene, both of which favor detection of cryptic initiation events in longer
genes. We found that after this treatment, long genes no longer harbor more cryptic
initiation events. Indeed, they may harbor fewer cryptic initiation events per unit length
(compare Figures 2-2A and 2-2F). Therefore, controlling ascertainment biases inherent
in transcript-based detection by microarray eliminated the relationship between the
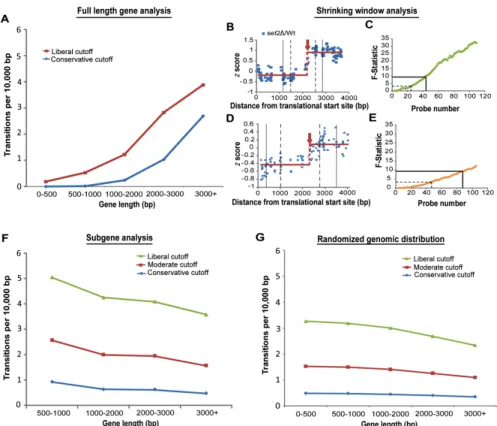
Figure 2-2. Cryptic initiation events occur without regard to gene length. (A) The number of cryptic initiation events detected per base increases with gene length. Shown is the detection rate for five gene-length bins at conservative (supF 9, 801 transitions, blue) and liberal (supF 3, 1757 transitions, red) cutoffs. (B-C) Reducing the number of probes flanking a transition event causes statistical significance to decrease. Plotted along the length of YDR104C are z scores of set2∆ RNA/Wt RNA. The solid horizontal lines represent the average z score for the set2∆/Wt values (red) before and after the cryptic initiation event. The black solid and dashed vertical lines correspond to the number of probes required to achieve the supF 9 and supF 3 cutoffs respectively.
Panel C plots the calculated supF values (y-axis) as a window centered on the detected transition shrinks, causing fewer probes to be available for transition detection (x-axis). The solid and dashed black lines call attention to the supF 9 and supF 3 cutoffs. (D-E)
22
Sites of cryptic initiation are distributed randomly with regard to gene length
Our analysis of cryptic initiation events is consistent with such events being distributed
throughout transcription units without respect to their length. To test this hypothesis, we
assigned each detected transition at random to an ORF probe, and compared several
features of the randomly assigned transitions to these same features under the observed
(not randomized) transition locations. As was the case with the observed locations, and
as expected, when transitions were randomly distributed, longer genes contained more
transitions. However, when the transition rate per base was calculated using the random assignments, there is no relationship between transition rate and length, which is nearly
identical to what we observe with real data when the cryptic initiation calls are made
using uniform-length subgenes, which control probe-number ascertainment bias (Figure
2-2G; compare to Figure 2-2F). The fact that randomly assigned transitions, which do
not depend on a detection algorithm, so closely mimic the observations made with real
data when length biases are controlled, strongly suggests that real cryptic initiation
events are distributed randomly in relation to gene length.
Sites of cryptic initiation are distributed randomly with regard to transcription rate
Previous studies reported that infrequently transcribed genes are especially prone to
cryptic initiation events in the absence of Set2103. However, as has been noted by
others, gene length and transcription rate are not independent variables114,122. In
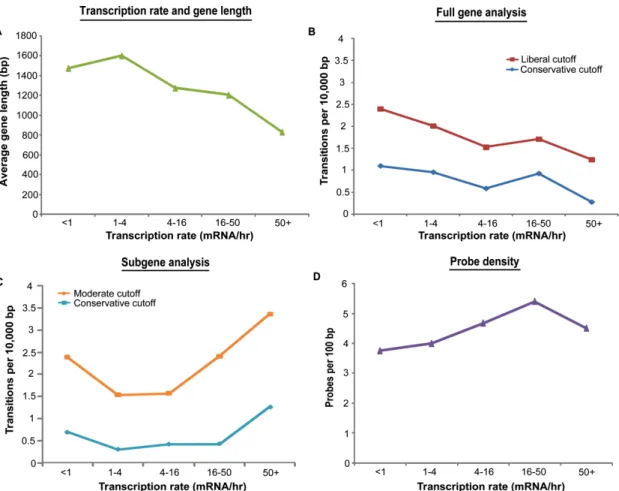
particular, long genes tend to be transcribed less frequently (Figure 2-3A). We sought to
determine if any relationship between transcription rate and cryptic initiation rate
remained after controlling for ascertainment biases due to gene length. First, we binned
genes according to their transcription rate122, and plotted the number of cryptic initiations
per base for each of the bins according to our full-length gene analysis. Consistent with
Figure 2-3. Cryptic initiation events occur without regard to transcriptional frequency.
(A) Infrequently transcribed genes tend to be long. The average gene length for each transcription-rate bin is shown. (B) Without correcting for gene length, infrequently transcribed genes appear to have a higher rate of cryptic initiation. Genes were binned according to their transcription rate, and the cryptic initiation rate was determined for each bin. (C) Detection of cryptic initiation sites using subgenes of uniform length eliminates the inverse relationship between gene transcription frequency and cryptic initiation frequency. There may in fact be a trend toward more cryptic initiation in heavily transcribed genes. (D) Probe density cannot account for the observed relationship between transcription frequency and cryptic initiation frequency. Probe coverage is fairly uniform across gene transcription rate bins.
initiation rate and transcription rate (Figure 2-3B). However, we noted that the plot
looked very similar to the relationship between gene length and transcription rate
(Figure 2-3A). Next, we performed the same analysis, but this time using our subgene
analysis. As described above, the subgene analysis controls the probe-number bias that
24
transcribed genes are, if anything, more likely to contain cryptic initiation sites (Figure
2-3C), in contradiction to the previously reported results. Furthermore, this increased rate
of cryptic initiation among highly transcribed genes cannot be accounted for by
differences in probe coverage among this class of genes (Figure 2-3D).
The ascertainment biases reported here are likely widespread
Although not addressed directly by our manuscript, the same biases that cause long and
infrequently transcribed genes to appear to be more susceptible to perturbations of the
Set2/Rpd3S pathway could also make it appear as if such genes are differentially
associated with histone modifications or other genomic features. These biases are
exaggerated by the popular “modified average gene analysis” method, which unnaturally
forces every gene into a unit length, despite variations in real gene length of over an
order of magnitude. Not only are such representations of dubious biological relevance,
they are also suspect from a statistical standpoint because the number of data points
underlying the “modified average gene” vary dramatically depending on real gene length.
We are optimistic that technologies such as next-generation DNA sequencing will
partially overcome the ascertainment biases we report here, but when transcripts are
analyzed, even these approaches will be susceptible to such effects since longer and
more frequently transcribed genes will accumulate more sequence reads.
Identification of factors which lead to cryptic transcript initiation sites in set2∆
Despite the biased ability to confidently call cryptic transcripts, it is unlikely that our
identified high confidence sites are false positives. We wondered if the distribution of
cryptic sites was the result of underlying chromatin features, which might cause cryptic
26
transcripts were called more frequently in the middle of long genes (Figure 2-4A,B). We
find by ChIP that Set2 is excluded from the 5’ end of coding regions and promoters in
essentially all genes101 (Figure 2-4C). This suggests that certain genes are not more
sensitive to the loss of SET2. Set2 distribution is consistent with recruitment to the Ser2 phosphorylated form of RNA polymerase II123 (Figure 2-4D-F).
Considering the general nucleosome depletion at promoters in yeast, we
wondered if nucleosomes were depleted in set2∆ at sites of cryptic initiation. We find anecdotal evidence that nucleosomes are depleted at the site of cryptic transcription
initiation (Figure 2-5A-C). We are currently in the process of identifying sites of altered
nucleosome occupancy more thoroughly in set2∆. While initial analysis has identified coincident sites of nucleosomes occupancy depletion and cryptic transcript initiation, it is
not clear if this overlap occurs more often than would be expected by chance.
Unfortunately, if cryptic promoter formation is rare in the population, it may be difficult to
identify nucleosome-depleted sites in set2∆, even if depletion is required for the formation of cryptic transcripts. Identifying the distribution of the general transcription
machinery, Htz1, or the RSC complex also help identify cryptic promoters or boundaries
in set2∆.
DISCUSSION
The possibility of NFR formation upon loss of Set2 is exciting because it
suggests a pathway and mechanism for how DNA is dynamically accessed for promoter
specification, alternative start sites, and DNA repair. The formation of NFRs upon loss of
SET2, also suggest that chromatin components function to compartmentalize sequence from the selective constraints of other genomic regions. In this case, Set2 (and histone
deacetylation) may function partly to hide promoter-like sequences in the coding region,
Figure 2-5. Anecdotal evidence for the formation of new boundaries at sites of cryptic initation in set2∆. (A) Smoothed dyads of Wt (BY4742) at the YDR128W locus. (B) Smoothed nucleosome dyads of set2∆ (BY4742) at the YDR128W locus. Nucleosome occupancy is depleted at the site of cryptic transcript initiation. (C)
set2∆/Wt expression log2 Lickwar et al. 2009) at the YDR128W locus.
space, ignorant to sequence specific transcription factor binding sites and transcription
start sites sequences. Importantly, this accessibility might be initiated solely by
H3K36me loss in coding regions, or otherwise. H3K36me loss could be accomplished at
specific sites by the recruitment of the H3K36me specific demethylases, Rph1 and
Jdh1124. The dissection of this accessibility pathway could be achieved in a strain that
rapidly loses Set2, followed by profiling the subsequent dynamics of the chromatin
landscape (nucleosome occupancy, histone modification, chromatin remodelers,
transcription components, etc.). Similar strategies could be performed with any of the
mutants that show cryptic transcription defects119.
The hypothesis that infrequently transcribed long genes are particularly
28
data. Instead, our analysis indicates that Set2 suppresses cryptic transcription in
wild-type cells across the genome in a manner that is, to first order, independent of gene
length and gene frequency. This is a significant conclusion because it is consistent with
previous reports that H3K36 methylation levels in yeast are largely independent of
transcription rate114, and because it obviates the need to posit a biological or
evolutionary mechanism that accounts for a link between suppression of cryptic
transcription and gene length or transcriptional frequency. It appears more likely that
cryptic transcripts arise due to chance occurrences of DNA sequences that have the
capacity to inappropriately recruit transcription initiation factors, or initiate transcription,
for example sequences resembling a TATA box108 or nucleosome-excluding elements.
Alternatively, sites of cryptic transcription could be distributed arbitrarily relative to length
and transcription rate, but still represent functional internal promoters that are
conditionally active119. While to date there is no evidence of a function for cryptic
transcripts in yeast, the use of alternative start sites is extremely widespread in
eukaryotic genomes, and it is likely that the Set2/Rpd3S pathway influences the
evolution of alternative promoters in more complex eukaryotes.
MATERIALS AND METHODS
RNA preparation
Wild type (BY4741) and set2∆ (BY4741) strains were grown at 30°C in YPD (1% yeast extract, 2% peptone, 2% dextrose) to an OD600 of 0.6-0.8. For each of the three
replicates, total RNA was extracted by acid-phenol method99. Lack of RNA degradation
was confirmed by gel electrophoresis. Double-stranded cDNA was prepared using an
Invitrogen SuperScript™ (Cat No. 11917-010) primed with Oligo(dt) and random
CGH arrays (2005-08-16_SCER_WG_CGH) with Tm-normalized probes. In one of the
replicates, assignment of the fluorescent label was reversed. Z scores were calculated for each replicate based on the log2 (635/532 intensity) for each probe. The average z score value for each probe among the three replicates was used for further analysis. For
Figure 1A, wild-type values were calculated by median centering the raw wild-type probe
values from each array. Z scores were then calculated for each array, and the average z
score for each probe across the three replicates was used for subsequent analysis. Raw
microarray data is available via GEO accession number GSE13310.
Cryptic initiation analysis
To detect cryptic initiation events, we employed a change-point detection algorithm120.
The algorithm is applied independently to each gene and operates in a sequential
fashion. At each probe within a gene, the algorithm compares the average measured
probe values (z scores) to the left and to the right of the probe using a standard F-statistic. We then calculate the maximum F statistic appearing along the gene, which is
known as the supF statistic125, and compare a scaled version of this statistic to one of two pre-defined significance thresholds. If the scaled supF statistic exceeds a significance threshold, the corresponding location of the observed maximum F-statistic is
identified as a cryptic initiation point. The search procedure is then applied separately
and independently to the observations lying to the left and to the right of the detected
cryptic initiation point. This process of splitting and searching for potential cryptic
initiations continues until no significant transition (as judged by the scaled supF statistic) can be found in a given interval.
The number of probes varies greatly across genes, ranging from few to several
hundreds. The moderate number of probes for most genes does not allow us to use