The handle
http://hdl.handle.net/1887/37572
holds various files of this Leiden University
dissertation.
1
Population ageing and health care expenditure
2
Cover by: dr. André Keizer Published by: Ridderprint B.V.
ISBN:978-94-6299-265-8
No part of this book may be produced, stored or transmitted in any form or by any means without permission from the author.
3
Population ageing and health care expenditure
Proefschrift
ter verkrijging van
de graad van Doctor aan de Universiteit Leiden, op gezag van de Rector Magnificus prof. mr. C.J.J. Stolker,
volgens besluit van het College voor Promoties te verdedigen op dinsdag 2 februari 2015
klokke 16:15
door
Hendrik Jan Albert (Herbert) Rolden geboren te Groningen, Nederland
4
Co-promotor: Dr. D. van Bodegom
Promotiecommissie: Prof. dr. A.M. Stiggelbout
Prof. dr. J.J. Polder (National Institute for Public
Health and the Environment (RIVM) and Tilburg University)
Dr. A. de Bont (Institute of Health Policy &
5
1. General introduction 7
Part I – Determinants on the macro-level: The national economy, cli-mate, and national policy
2. Old age mortality and macroeconomic cycles 15
3. Seasonal variation in mortality, medical care expenditure, and
institu-tionalization in older people 31
4. The association between expenses for general practice and other
health care expenses later in time 51
Part II – Determinants on the micro-level: Patient-centred care, the spouse and time to death
5. Effectiveness of a transitional care programme to improve outcomes
of frail older patients after hospitalisation 65
6. Changes in health care expenditure after the loss of a spouse 83
7. Variation in the costs of dying and the role of different health services,
socio-demographic characteristics, and preceding health care costs 103
8. Discussion 123
Nederlandse samenvatting 135
Appendix
List of publications 145
Acknowledgments 147
7
Chapter 1
8
Population ageing and health care expenditure
National levels of health care spending are rising in many developed countries. Faced with increasing pressure on public finances, policy-makers are directing their attention towards the potential causes of this rise. Population ageing is perceived to be an im-portant cause. For example, the Netherlands Bureau for Economic Policy Analysis esti-mated that population ageing caused 20% of the total rise in real health care
expendi-ture (HCE) per capita in the Netherlands between 1972 and 2010.1 Consequently, if this
growth rate is extrapolated and other important factors are left aside – such as
techno-logical innovation, health policy restructuring and the Baumol effect1 – population
age-ing will require Dutch citizens to spend 23% more on health care through taxes and premiums in 2040 than they did in 2010.
In contrast, other authors have found that population ageing only has a modest
or even ignorable impact on health care costs.2-4 They consistently find that
technolog-ical innovations have been the major driver of growth in health care spending on the national level in recent decennia, and the demographic factors like population ageing play a minor or even insignificant role. Such contrasting results in literature on popula-tion ageing exist because populapopula-tion ageing itself is a complex dynamic involving many facets. Not only does a high degree of uncertainty surround these facets, many forecasts do not include all facets. In general, the term population ageing refers to three dynam-ics: (1) rising life expectancy; (2) a higher share of older people; and (3) increased mor-tality rates. These three dynamics have different implications for future health care spending, each with many different scenarios.
Rising life expectancy will only result in increased HCE if people will also live longer with health related problems. Otherwise, more life years will only postpone an increase in HCE. It is also possible that a higher life expectancy will dampen HCE (see next paragraph). Concerning the second dynamic, the share of older people is increas-ing and older people consume a relatively high share of health care. In 2007, Dutch cit-izens aged 65 years and older made up 15% of the total population, but were responsi-ble for 37.5% of the total level of health care spending, equalling 27.75 billion of roughly
1 The Baumol effect refers to an economic law, which stipulates that economic growth is
9
74 billion euros.5,6 When taking into consideration that the share of seniors is
fore-casted to rise up to 26% in 2040, there is prima facie evidence for a considerable impact of population ageing on HCE through this second dynamic (in this case, a rise from 74 billion to 88 billion from 2007 to 2040, equalling ±424 million euros annually). How-ever, this simple extrapolation does not take the many counteracting dynamics into
ac-count, such as the ‘red herring’ phenomenon.2
The red herring phenomenon is related to the third dynamic: increased mortality rates. It refers to the notion that a strong rise in HCE by age on the population level conceals that there is actually not a strong rise in HCE by age on the individual level. On the individual level, in contrast, HCE increase only slightly with age, but rapidly before death. What then underlies the association between age and HCE on a population level
is actually a rising mortality risk in combination with high ‘costs of dying,’ and not a
presumed direct impact of age on HCE.7 It is important to note here that the costs of
dying decrease with age.11 Economists therefore conclude that it is important to include
predictions about age, mortality and the costs of dying in forecasts concerning HCE,
ra-ther than just age8,9 – although some economic researchers do not agree with this
point.10,11
Aim and outline of this thesis
To gain a better understanding of how the ageing of a population affects health care spending, it is important to investigate the three separate dynamics that underlie the
association between HCE and population ageing. Therefore, the aim of this thesis is to
investigate the determinants of mortality, health care expenditure and the costs of dying in the older population. The different determinants investigated in this thesis can be separated in two categories: (1) determinants that apply to the country as a whole (macro-level) – e.g. the status of the national economy; and (2) determinants relevant for the individual (micro-level) – e.g. a person’s relationship status. Part I of this thesis
(chapter 2─4) is dedicated to macro-level determinants, and part II (chapters 5─7) deals
with the micro-level.
2 The term ‘red herring’ refers to an illusionary tactic to draw one’s attention away from the real
10
Overview of the chapters
Studies have found that rates in unemployment and economic growth affect the mor-tality rates of a population. It is unclear if and how economic growth is associated with
mortality at older age. This is investigated in chapter 2. Another important macro-level
determinant of mortality is seasonality. It is known that mortality rates of older people are higher in cold seasons and during heat waves, but it is unknown if seasonal cycles
exist in medical care expenses and the institutionalization rates of older people.
Chap-ter 3 deals with this issue. Chapter 4 focuses on the national health care system. Spe-cifically, the idea that the effective use of general practitioners (GPs) can increase the cost-effectiveness of the national health care system is investigated. When GPs act as gatekeepers utilization of more expensive specialist care is avoided through selective referral, improved coordination, and the GPs ability to perform basic treatments at lower costs. However, the cost-effectiveness of such a gatekeeping system has not been studied properly.
Part II (the micro-level) starts with a chapter on personalized medicine. The care network surrounding frail older people is usually of a bureaucratic and complex nature, which comes at the expense of their health as well as the efficiency of regional health
care supply. In chapter 5 a programme is described that aims to improve the health of
hospitalized frail older people by improving their network through the individual tai-loring of care. Not only the structure of the formal care network is important for the health of the elderly patient, and the efficiency of health care of older patients: the in-formal care network is also of crucial importance. The most important part of an older person’s care network is the spouse. It is known that married older people live in better health and have a lower mortality risk. The effect on marital status on HCE needs fur-ther exploration. The effect of the loss of the spouse on HCE through time is reported in
chapter 6. Finally, chapter 7 concerns the costs of dying. The focus lies on four deter-minants on which current literature is non-existent or controversial: variation in the cost of dying, and the role of socio-demographic characteristics, different health ser-vices, and preceding HCE in the costs of dying. The key findings of this thesis are
dis-cussed in chapter 8, which also concerns the impact of these findings on the debate
11
References
1. De Jong J. Decompositie van de zorguitgaven, 1972-2010. CPB achtergronddocument bij: CPB
Policy Brief 2011/11. Den Haag: Centraal Planbureau. 2012. Available:
http://www.cpb.nl/en/publication/decompositie-van-de-zorguitgaven-1972-2010
2. Barros PP. The black box of health care expenditure growth determinants. Health Econ. 1998;
7: 533-44.
3. Reinhardt U. Does the aging of the population really drive the demand for health care? Health
Affairs. 2003; 22: 27-39.
4. Breyer F, Costa-Font J, Felder S. Ageing, health, and health care. Oxf Rev Econ Policy. 2010; 26:
674-90.
5. Van Duijn C, Stoeldraijer L. Bevolkingsprognose 2012-2060: Langer leven, langer werken.
Den Haag: Central Bureau of Statistics. Available:
http://www.cbs.nl/NR/rdonlyres/DB34C87D-823D-49B4-AE3A-A3DE66CDCB1A/0/2012 bevolkingprognoselangerlevenlangerwerken.pdf
6. Slobbe LCJ , Smit JM, Groen J, Poos MJJC, Kommer GJ (2011). Kosten van Ziekten in Nederland
2007: Trends in de Nederlandse zorguitgaven 1999-2010. Bilthoven: National Institute for Public Health and the Environment. Available:
http://www.rivm.nl/bibliotheek/rapporten/270751023.pdf
7. Zweifel P, Felder S, Meiers M. Ageing of population and health care expenses: A red herring?
Health Econ. 1999; 8: 485-96.
8. Felder S, Meier M, Schmitt H. Health care expenditure in the last months of life. J Health Econ.
2000; 19: 679-695.
9. Stearns SC, Norton EC. Time to include time to death? The future of health care expenditure
predictions. Health Econ. 2004; 13: 315–27.
10.Werblow A, Felder S, Zweifel P. Population ageing and health care expenditure: A school of
‘red herrings’? Health Econ. 2007; 16: 1109-1126.
11.Van Baal PH, Wong A. Time to death and the forecasting of macro-level health care
expendi-tures: some further considerations. J Health Econ. 2012; 32: 876-87.
12.Breyer F, Felder S. Life expectancy and health care expenditures: A new calculation for
12
Supplementary material
The Dutch health care system
Health care in the Netherlands can be separated into two main sectors: medical care and long-term care. Medical care refers to consultations, medication and treatment from general practitioners, medical specialists, dentists, pharmacists, and therapists (such as physiotherapists and psychotherapists). Some forms of instrumental aid and transportation are also provided through the medical care sector. In the studied time period, health care providers bill health care insurers in the form of diagnosis related groups. Medical care is legally arranged through the Health Insurance Act (HIA).
Long-term care in the Netherlands is legally arranged through the Exceptional Medical Expenses Act (EMEA). Entitled to care through the EMEA are people who can-not satisfy their basic care needs independently due to a physical, psychogeriatric or psychiatric ailment, or a mental, physical or sensorial handicap. Before someone may receive long-term care through the EMEA, the Center for Indication Setting has to eval-uate the client’s health status and issue an official indication. When an indication is set
for a client, the actual provision of long-term care is arranged by so-called care offices.
After an indication is set, the care office appoints a health care provider for a client, or distributes a personal budget. The health care insurer who has the highest share of cli-ents in a region acts as the care office for that region.
There were basically five separate long-term care services funded through the EMEA in the studied time period: (1) personal care (e.g. dressing, undressing, help with bathing or showering), (2) nursing care (e.g. wound dressing), (3) counseling (daytime activities and help with improving self-reliance, individually tailored or in groups), (4) treatment (forms of rehabilitation or therapy) and (5) residence. Indications for
extra-mural care are defined in type and level (hours per week). Since July 1st 2007,
13
Part I
15
Chapter 2
Old age mortality and macroeconomic cycles
Published as: H.J.A. Rolden, D. van Bodegom, W.B. van den Hout, R.G.J. Westendorp. Old age mortality and macroeconomic cycles.
16
Abstract
Background: As mortality is more and more concentrated at old age, it becomes critical to identify the determinants of old age mortality. It has counter-intuitively been found that mortality rates at all ages are higher during short-term increases in economic growth. Work-stress is found to be a contributing factor to this association, but cannot explain the association for the older, retired population.
Methods: Historical figures of gross domestic product (Angus Maddison) were com-pared with mortality rates (Human Mortality Database) of middle aged (40-44 years) and older people (70-74 years) in nineteen developed countries for the period 1950 through 2008. Regressions were performed on the de-trended data, accounting for au-tocorrelation, and aggregated using random effects models.
Results: Most countries show pro-cyclical associations between the economy and mor-tality, especially with regard to male mortality rates. On average, for every 1% increase in gross domestic product, mortality increases with 0.36% for 70-74 year old men (p<.001) and 0.38% for 40-44 year old men (p<.001). The effect for women is 0.18% for 70-74 year olds (p=.012) and 0.15% for 40-44 year olds (p=.118).
17
Introduction
Life expectancy in developed countries is continuously on the rise.1 A major part of the
longevity increase was due to a mortality reduction at younger age, but is now mainly
attributable to a reduction of old age mortality.2,3 It is therefore important to investigate
the determinants of old age mortality. Long-term economic growth is an important
de-terminant of lower mortality rates of older people, as wealth creates health.4-6 Since
many developed countries are currently in a recession, one could expect this has a dampening effect on old age survival. However, it has been found that annual increases in unemployment, or decreases in gross domestic product (GDP), are associated with
lower mortality rates at all ages. The association between macroeconomic cycles and mortality remains unknown. Since many developed countries are facing a recession, as well as a growing share of older people, there is a strong case to study the relation be-tween macroeconomic cycles and old age mortality.
An association between mortality and short-term fluctuations in unemployment
rates or GDP was found to exist in Germany,7 Japan,8 Mexico,9 Spain,10 Sweden11,12 and
the US.13-17 Two papers analyzed the association in multiple countries, but only used
age-standardized mortality rates.18,19 The counter-intuitive association between the
economy and mortality has been explained by increased job-related stress, higher risk of traffic accidents, and more unhealthy lifestyles during years of lower unemployment. Other explanations include lagged rather than concomitant effects (economic
expan-sions diminish mortality rates, but with a delay)20,21 or spurious correlation due to
methodological issues.22,23 Currently, the mechanisms underlying the association
re-main largely unknown. Of the aforementioned studies on mortality and short-term
fluc-tuations in unemployment rates or GDP, a few considered old age mortality. Neumayer,7
Tapia-granados,10 Ruhm,13 and Miller et al.17 report that the association between
18
The aim of the present study is to explore and analyze the association between macro-economic cycles and cyclic variation in mortality rates of middle aged and older people. There are two main differences between our study and the aforementioned studies. First, rather than comparing mortality rates with annual fluctuations in unemployment or GDP, we compare cycles lasting several years. Second, we focus on old age mortality and compare this with a middle age working group. We also study this in a large group of countries, rather than in a single country. Other studies in multiple countries did not differentially study the older population.
Methods
Data collection
Data of gross domestic product per capita (GDP) and mortality of 19 developed coun-tries between 1950 and 2008 were obtained from Angus Maddison’s dataset and the
Human Mortality Database respectively.24 Maddison’s dataset was used because it
com-prises data over a long period of time. To compare long cycles in the economy with changes in the trends of mortality, we considered that a dataset encompassing at least 50 years of data per country is required. The dataset offers estimated historical figures of GDP, defined as Geary-Khamis (G-K) dollars with purchasing power held constant with 1990 as the price level year. Geary and Khamis offered a credited alternative to price power parity adjusted figures of other economic institutes, such as the World Bank. Many studies on the association between the economy and mortality use unem-ployment as an indicator for a country’s economic status, sometimes with income fig-ures. We use GDP rather than unemployment for two reasons. First, only a few older people have jobs, so they are probably more directly influenced by changes in GDP ra-ther than employment. Second, unemployment figures do not date back far enough to provide a long enough time frame.
19
T a b le 1 . P o p u la ti o n s iz e , r e a l G D P p e r ca p it a , a n d m o rt a li ty r a te s fo r b o th ge n d e rs a n d t w o a ge gr o u p s fo r n in e te e n O E C D -c o u n -tr ie s in 1 9 5 0 a n d 2 0 0 8 . P o p u la ti o n s iz e (x 1 0 0 0 ) a R e a l G D P p e r c a p it a M o r ta li ty r a te s A g e 7 0 -7 4 , m a le ( % ) A g e 7 0 -7 4 , fe m a le ( % ) A g e 4 0 -4 4 , m a le ( % ) A g e 4 0 -4 4 , fe m a le ( % ) 1 9 5 0 2 0 0 8 1 9 5 0 2 0 0 8 1 9 5 0 2 0 0 8 1 9 5 0 2 0 0 8 1 9 5 0 2 0 0 8 1 9 5 0 2 0 0 8 A u st ra li a b 8 ,2 6 7 2 0 ,7 5 0 7 ,4 1 2 2 5 ,3 0 1 6 .5 4 2 .2 8 4 .2 8 1 .3 8 .4 0 .1 5 .3 2 .1 0 A u st ri a 6 ,9 3 5 8 ,2 0 6 3 ,7 0 6 2 4 ,1 3 1 6 .6 0 2 .6 5 4 .9 7 1 .4 0 .4 6 .1 6 .3 4 .0 8 B e lg iu m 8 ,6 3 9 1 0 ,4 0 4 5 ,4 6 2 2 3 ,6 5 5 7 .9 1 2 .4 1 5 .6 6 1 .0 5 .7 2 .1 6 .6 0 .0 9 C a n a d a b 1 4 ,0 1 1 3 2 ,9 3 6 7 ,2 9 1 2 5 ,2 6 7 5 .4 7 2 .6 7 4 .2 5 1 .6 7 .4 0 .1 6 .3 1 .1 0 D e n m a rk 4 ,2 7 1 5 ,4 8 5 6 ,9 4 3 2 4 ,6 2 1 5 .1 8 3 .2 4 4 .6 2 2 .1 5 .2 9 .1 8 .2 6 .1 2 F in la n d 4 ,0 0 9 5 ,2 4 5 4 ,2 5 3 2 4 ,3 4 4 7 .5 9 2 .9 0 5 .5 8 1 .4 1 .6 5 .2 6 .3 3 .1 0 F ra n ce b 4 2 ,5 1 8 6 3 ,6 8 2 5 ,1 8 6 2 2 ,2 2 3 6 .4 3 2 .5 8 4 .3 7 1 .2 0 .5 4 .2 3 .3 3 .1 1 Ir e la n d 2 ,9 6 3 4 ,5 1 8 3 ,4 5 3 2 7 ,8 9 8 6 .2 8 3 .0 2 5 .3 1 1 .6 9 .4 7 .1 6 .4 5 .1 0 It a ly b 4 7 ,1 0 5 5 9 ,6 2 7 2 ,8 8 1 1 9 ,9 0 9 5 .4 0 2 .6 1 4 .6 7 1 .3 2 .4 3 .1 4 .3 0 .0 8 Ja p a n 8 3 ,8 0 5 1 2 7 ,7 8 8 1 ,9 2 1 2 2 ,8 1 6 7 .9 1 2 .4 1 5 .6 6 1 .0 5 .7 2 .1 6 .6 0 .0 9 N e th e rl a n d s 1 0 ,1 2 1 1 6 ,4 1 0 3 ,5 0 2 2 4 ,6 9 5 4 .7 0 2 .8 0 4 .3 3 1 .6 3 .2 6 .1 4 .2 2 .1 0 N . Z e a la n d 1 ,9 0 8 4 ,1 7 3 8 ,4 5 6 2 5 ,2 6 7 5 .9 1 2 .5 0 4 .0 8 1 .7 4 .3 1 .1 6 .2 9 .1 1 N o rw a y 3 ,2 6 5 4 ,6 4 4 5 ,9 9 6 2 8 ,5 0 0 4 .3 4 2 .6 4 3 .7 5 1 .5 7 .3 0 .1 5 .2 1 .0 8 P o rt u g a l 8 ,4 4 3 1 0 ,6 7 7 2 ,0 8 6 1 4 ,4 3 6 6 .9 0 3 .0 2 4 .9 1 1 .5 4 .7 0 .2 8 .4 3 .1 2 S p a in c 2 8 ,0 6 3 4 4 ,4 3 2 2 ,1 8 9 1 9 ,7 0 6 6 .6 0 2 .8 1 5 .0 4 1 .2 7 .5 9 .2 1 .4 0 .1 0 S w e d e n 7 ,0 1 4 9 ,0 4 5 6 ,7 6 9 2 4 ,4 0 9 5 .0 7 2 .5 1 4 .5 4 1 .4 9 .2 8 .1 3 .2 5 .0 9 S w it ze rl a n d b 4 ,6 9 4 7 ,5 5 5 9 ,0 6 4 2 5 ,1 0 4 6 .1 5 2 .3 7 4 .5 4 1 .2 9 .3 8 .1 4 .2 8 .0 8 U K 5 0 ,1 2 7 6 1 ,6 4 3 6 ,9 3 9 2 3 ,7 4 2 6 .7 1 2 .8 4 4 .6 3 1 .8 5 .3 7 .1 9 .2 8 .1 2 U S A b 1 5 7 ,8 6 8 3 0 1 ,5 8 0 9 ,5 6 1 3 1 ,1 7 8 6 .0 2 3 .0 2 4 .2 8 2 .0 3 .5 3 .2 8 .3 5 .1 7a P
o p u la ti o n d a ta i s fr o m t h e U S C e n su s B u re a u .
b D
a ta a v a il a b le u n ti l 2 0 0 7 .
c D
20
In addition, Hungary was excluded because of methodological issues (see statistical analysis) and a turbulent historic background – including repression, revolution, and the shift from a plan economy into a capitalist economy. Characteristics of the nineteen included countries are shown in table 1.
Statistical analysis
To capture cyclical variation in the economy and mortality, we transformed real figures of gross domestic product and mortality rates into percentual deviations around the long-term trend. The long-term trend of GDP is expressed as the log-linear function
log GDP = α + β*Y + ε
where GDP stands for gross domestic product, α for the intercept, β for the regression coefficient, Y for year (1950-2008), and ε for the error term. Using this method, the con-stant growth or decline rate is filtered out to retrieve the cyclic movements around its
long-term trend and prevent interference from the trend itself. The average fit (R2) of
all log-linear functions for GDP and mortality in the 19 included countries was 0.89.
Hungary was excluded, in part because of the low fit of the long-term trends (R2=0.47).
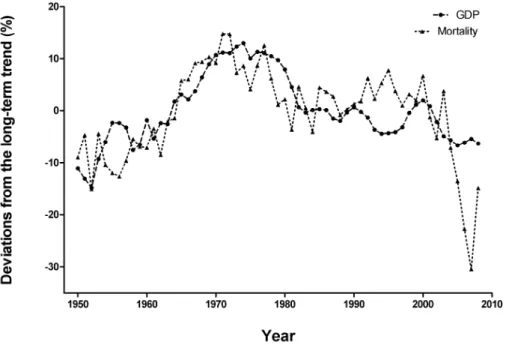
Figure 1 portrays figures of GDP (a) and mortality (b) as well as their long-term trends for the Netherlands from 1950 through 2008. In both panels, the arrow shows an ex-ample of a deviation. In previous literature, authors comparing GDP and mortality often use deviations from the Hodrick-Prescott trend.
Separate analyses were performed for each country, gender and age group. Per-centual deviations from the long-term trend are calculated by subtracting the log-linear function from the real figures, and expressing this value as a percentage of the log-linear function. In each separate analysis, deviations of mortality are regressed on deviations of GDP in a linear regression model. Due to their cyclic nature, data in subsequent years are likely to be correlated: standard regressions would therefore underestimate uncer-tainty. Instead, we used Cochrane–Orcutt regression to account for autocorrelation and calculated Durbin-Watson test statistics.
The separate analyses were aggregated over all countries using a meta-analysis with a random effects model for continuous variables: the overall coefficients with con-fidence intervals were estimated from the separate estimated coefficients and standard
errors for the nineteen countries.25 Data transformations were performed in SPSS 21.0.
22
Results
Autocorrelation properties
According to the Durbin-Watson test statistic,26 70 of the 76 analyses (4 groups in 19
countries) show signs of autocorrelation. After applying the Cochrane-Orcutt method only seven associations still showed signs of autocorrelation. The following results are all adjusted for autocorrelation.
Macroeconomic cycles and mortality
In the long term, an increase in gross domestic product (GDP) is associated with a de-crease in mortality in all countries. However, the cycles around the trends in GDP and mortality show a different association. An example of the association is given in figure 2. Here, percentual deviations from the trend for GDP and mortality in men aged 40-44 are shown for the Netherlands from 1950 through 2008. The deviations in GDP and mortality show a parallel, or pro-cyclical, movement. This means that mortality rises in the Netherlands when its economy is in an upward cycle, or in other words, when the economy expands.
23
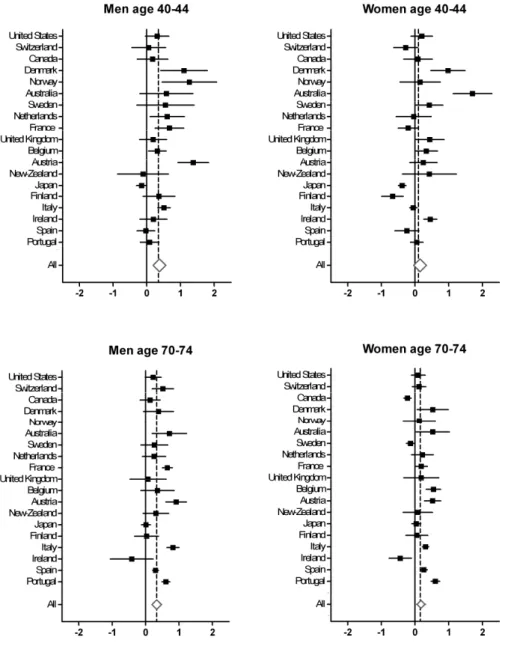
The forest plots in figure 3 summarize the associations between macroeconomic cycles and cyclical variation in mortality for all the analyzed countries. The means, confidence intervals, and significance levels of the associations are presented in supplementary ta-ble 1 (page 29). The coefficients in the forest plots reflect the change in percentual de-viations from the long-term trend for mortality with every 1% change in dede-viations of the country’s GDP. A positive coefficient thus stands for a pro-cyclical association, whereby mortality increases during economic expansion.For males aged 70 through 74, mortality rates increase in 17 of the 18 countries when the economy expands (analysis for men aged 40-44 in Norway could not be per-formed, since transformation of autocorrelation properties was not possible). Of these pro-cyclical associations seven are significant. On average, mortality in older males show an increase of 0.36% (CI 95% 0.22 to 0.50; p<.001) for every one percent the mac-roeconomic cycle moves upward. For the middle age male group, mortality rates in 16 countries also show a pro-cyclical movement, of which seven are significant. On aver-age, mortality trends of males age 40-44 increase with 0.38% (CI 95% 0.19 to 0.56; p<.001) for every percent the economy expands.
For females aged 70 through 74 (figure 3), mortality rates increase in 16 coun-tries when the economy expands. Seven of these pro-cyclical associations are signifi-cant. The remaining three anti-cyclical associations are all significant (Canada, Ireland and Sweden). On average, mortality for this age group increases with 0.18% (95% CI 0.04 to 0.32; p=.012) when the macroeconomic cycle moves upward with 1%. Mortality rates of females age 40 through 44 show a pro-cyclical association in 12 countries, of which six are significant. Of the seven anti-cyclical associations, two are significant (Fin-land and Japan). On average, mortality trends of females age 40-44 increase with 0.15% (CI 95% -0.04 to 0.34; p=.118) for every percent the macroeconomic cycle goes up-wards.
It is plausible that a pro-cyclical movement between the economy and mortality exists. Gerdtham and Ruhm have found that a 1% decrease in unemployment is associ-ated with a 0.4% increase in cardiovascular disease, 1.1% in influenza/pneumonia,
1.8% in liver disease, 2.1% in motor vehicle deaths, and 0.8% in other accidents.18
Lower unemployment rates during downward cycles in gross domestic product can in-duce these job-related stress factors. However, direct job-related factors do not explain our finding that older people react at least similarly to changes in the economy as
mid-dle age people. It is known that air pollution increases during economic expansions,27
24
25
Furthermore, air pollution doesn’t explain why men suffer more during good economic times than women. It could be that other factors are at play at higher ages. For example,changes in social support can have a considerable impact on old age mortality.28-31
When employment rates and the amounts of workload increase for the working popu-lation, it is plausible that there is less time for informal care-giving by younger relatives and friends for the chronically ill or oldest old. Also, the non-working older partner can be overburdened with informal care when the working children have less spare time,
leading to higher mortality in the older care-giver group.32
Another possible explanation of the first kind is of a psychosocial nature, known
as the inhibition effect.22 Studies show that persons who remain employed during times
of higher unemployment reduce their alcohol consumption, and exhibit less antisocial
behavior.33,34 Also, the number of road accidents and other traumas decreases with
higher unemployment, although suicide and homicide rates increase.35,36 Ruhm found
that during times of lower unemployment smoking and obesity figures increase, diets
become more unhealthy, and physical exercise decreases.14 It could be that older people
show the same kind of inhibition effect during downward cycles in the economy. The effect might even be stronger for pensioners, because they do not have the effect of in-creased risk of mortality by unemployment to counterbalance the inhibition effect. On the other hand, older people are less inclined to show this kind of behavior on the basis of changes in gross domestic product, since they are less dependent on the economy than employed or job-seeking individuals. Also, unhealthy lifestyles usually do not re-sult in increased mortality risk immediately, but some years later.
Secondly, one could also argue for reversed causality and that changes in mor-tality rates influence economic variables. Macroeconomic cycles are partly dependent on shifts in the demographic composition of a country, such as immigration and labor force supply. Taking this point of view, one could argue that old age mortality influences the economy. If mortality rates of the non-working population increase relative to those of the working population, average figures of labor productivity per capita will increase, raising per capita figures of gross domestic product.
Thirdly, economic expansions may decrease mortality with a delay. What seems as concomitant variation on first sight, could be a lagged reversed causal relation in re-ality. Some authors propose this delayed effect is the true dynamic behind the found
effect of short-term fluctuations in the economy and mortality.20,21 However, graphs
26
Finally, there could be a spurious association between economic and mortality
fig-ures.22-23 In this case, methodological issues in time-series analyses, or the existence of
a third variable, are at play. Concerning methodological issues, we tried to avoid an im-portant caveat by adjusting for autocorrelation. Concerning a third variable, many de-terminants or even confounders could cause changes in economic and mortality figures, such as health policies, air pollution, or informal care. To acquire enough data to analyze macroeconomic cycles, a dataset comprising many years was needed. More specific data on potential explanatory variables were not available for the selected time period. Furthermore, data about underlying causes of mortality rates are available through the OECD, but these data are only available for age-standardized mortality rates, and not age-specific mortality rates.
This implies that further research with the inclusions of such omitted variables is needed to unravel the seemingly pro-cyclical association between the economy and mortality in developed countries. Especially panel studies could greatly contribute to our understanding of the dynamics behind the association. This applies especially for explaining changes in mortality trends of older people, where current explanations do not suffice. Another limitation of our broad dataset is that the many differences be-tween the here included countries could not be analyzed. We included all countries for which figures of gross domestic product and mortality were known from 1950 on-wards, without paying attention to, for example, the differences in demographic com-position or culture. The statistically significant reversed relationship we found for women in some countries suggest that there is heterogeneity among the countries.
A strong aspect of this study is that we are the first to compare long cycles in gross domestic product and cyclical variation in mortality. Earlier studies on the asso-ciation between the economic environment and mortality have focused on short-term fluctuations in unemployment or gross domestic product. Furthermore, our analysis in-cludes a very comprehensive dataset with economic and mortality figures in over 50 years for nineteen developed countries. Earlier studies analyzing multiple countries use age-standardized mortality rates only.
27
References
1. Vaupel JW. The remarkable improvements in survival at older ages. Philos Trans R Soc Lond.
1997; 352: 1799-1804.
2. Wilmoth JR, Deegan LJ, Lundstrom H et al. Increase of maximum life-span in Sweden,
1861-1999. Science. 2000; 289: 2366-8.
3. Yang S, Khang YH, Harper S et al. Understanding the rapid increase in life expectancy in South
Korea. Am J Public Health. 2010; 100: 896-903.
4. Preston SH. The changing relation between mortality and level of economic development. Int
J Epidemiol. 2007; 36: 484-90.
5. Pritchett L, Summers LH. Wealthier is healthier. J Hum Resources. 1997; 31: 841-68.
6. Cutler DM, Deaton AS, Lleras-Muney A. The determinants of mortality. J Econ Perspect. 2006;
20: 97-120.
7. Neumayer E. Recessions lower (some) mortality rates – evidence from Germany. Soc Sci Med
2008; 58: 1037-47.
8. Tapia-Granados JA. Macroeconomic fluctuations and mortality in postwar Japan. Demography
2008; 45: 323-43.
9. Gonzalez F, Quast T. Macroeconomic changes and mortality in Mexico. Empirical Econ. 2011;
40: 305-19.
10.Tapia-Granados JA. Recessions and mortality in Spain, 1980-1997. Eur J Population. 2005; 21:
393-422.
11.Tapia-Granados JA, Ionides EL. The reversal of the relation between economic growth and
health progress: Sweden in the 19th and 20th centuries. J Health Econ. 2008; 27: 544-63.
12.Tapia-Granados JA, Ionides EL. Mortality and macroeconomic fluctuations in contemporary
Sweden. Eur J Population. 2011; 27: 157-84.
13.Ruhm CJ. Are recessions good for your health? Quarterly J Econ. 2000; 115: 617-50.
14.Ruhm CJ. Good times make you sick. J Health Econ. 2003; 22: 637-58.
15.Tapia-Granados JA. Increasing mortality during the expansions of the US economy,
1900-1996. Int J Epidemiol. 2005; 34: 1194-1202.
16.Ruhm CJ. Commentary: Mortality increases during economic upturns. Int J Epidemiol. 2005;
34: 1206-11.
17.Miller DL, Page ME, Stevens AH et al. Why are recessions good for your health? Am Econ
Re-view. 2009; 99: 122-7.
18.Gerdtham UG, Ruhm CJ. Deaths rise in good economic times: Evidence from the OECD. Econ
Hum Biol. 2006; 4: 298-316.
19.McAvinchey I. A Comparison of unemployment, income, and mortality interaction for five
Eu-ropean countries. Applied Econ. 1988; 20: 453-71.
20.Catalano R. The effect of deviations from trends in national income on mortality: The Danish
and USA data revisited. Eur J Epidemiol. 1997; 13: 737-43.
21.McKee M, Suhrcke M. Commentary: Health and economic transition. Int J Epidemiol. 2005; 34:
1203-6.
22.Catalano R, Bellows B. Commentary: If economic expansion threatens public health, should
epidemiologists recommend recession? Int J Epidemiol. 2005; 34: 1212-3.
23.Søgaard J. Econometric critique of the economic change model of mortality. Soc Sci Med. 1992;
28
24.Maddison A. Statistics on World Population, GDP and Per Capita GDP, 1-2008. 2010.
http://www.ggdc.net/MADDISON/oriindex.htm. Accessed 15 May 2012.
25.Harris RJ, Bradburn MJ, Deeks JJ et al. Metan: fixed- and random-effects meta-analysis. Stata
J. 2008; 8: 3–28.
26.Savin NE, White KJ. The Durbin-Watson test for serial correlation with extreme sample sizes
or many regressors. Econometrica. 1977; 45: 1989-96.
27.Chay KY, Greenstone M. The impact of air pollution on infant mortality: Evidence from
geo-graphic variation in pollution shocks induced by a recession. Quarterly J Econ. 2003; 118:
1121-67.
28.Blazer DG. Social support and mortality in an elderly community population. Am J Epidemiol.
1982; 115: 684-94.
29.Hanson BS, Isacsson SO, Janzon L et al. Social network and social support influence mortality
in elderly men. Prospective population study of “men born in 1914”, Malmö, Sweden. Am J Epidemiol. 1989; 130: 100-11.
30.Penninx BWJH, van Tilburg T, Kriegsman DMW et al. Effects of social support and personal
coping resources on mortality in older age: The longitudinal aging study Amsterdam. Am J
Epidemiol. 1997; 146: 510-19.
31.Temkin-Greener H, Bajorska A, Peterson DR et al. Social support and risk-adjusted mortality
in a frail older population. Med Care. 2004; 42: 779-88.
32.Schulz R, Beach SR. Care giving as a risk factor for mortality: The caregiver health effects
study. JAMA. 1999; 282: 2215-9.
33.Catalano R, Dooley D, Wilson G et al. Job loss and alcohol abuse: A test using the data from the
Epidemiologic Catchment Area Project. J Health Soc Behav. 1993; 34: 215-26.
34.Catalano R, Dooley D, Novaco R et al. Using the ECA data to examine the effect of job lay-off on
violent behavior. Hosp Community Psychiatry. 1993; 44: 874-8.
35.Stuckler D, Basu S, Suhrcke M et al. The public health effect of economic crises and alternative
policy responses in Europe: An empirical analysis. Lancet. 2009 ; 374: 315-23.
36.Catalano R. Health costs of economic expansion: The case of manufacturing accidents. Am J
31
Chapter 3
Seasonal variation in mortality, medical care
expenditure and institutionalization in older people
Published as: H.J.A. Rolden, J.H.T. Rohling, D. van Bodegom, R.G.J. Westendorp Seasonal variation in mortality, medical care expenditure and institutionalization in older people: Evidence from a Dutch cohort of older health insurance clients
32
Abstract
Background:The mortality rates of older people changes with the seasons. However, it has not been properly investigated whether the seasons affect medical care expendi-ture (MCE) and institutionalization. Seasonal variation in MCE is plausible, as MCE rises exponentially before death. It is therefore important to investigate the impact of the seasons on MCE, either separate from mortality or not.
Methods: Data on mortality, MCE and institutionalization from people aged 65 and older in a region in the Netherlands from July 2007 through 2010 were retrieved from a regional health care insurer and were linked with data from the Netherlands Institute for Social Research, and Statistics Netherlands (n=61,495). The Seasonal and Trend de-composition using Loess (STL) method was used to divide mortality rates, MCE, and institutionalization rates into a long-term trend, seasonal variation, and remaining var-iation. For every season we calculated the 95% confidence interval compared to the long-term trend using Welch’s t-test.
Results:The mortality rates of older people differ significantly between the seasons, and are 21% higher in the winter compared to the summer. MCE rises with 13% from the summer to the winter; this seasonal difference is higher for the non-deceased than for the deceased group (14% vs. 6%). Seasonal variation in mortality is more nounced in men and people in residential care. Seasonal variation in MCE is more pro-nounced in women. Institutionalization rates are significantly higher in the winter, but the other seasons show no significant impact.
33
Introduction
Developed countries are faced with ageing populations and increasing health care ex-penses. Investigating the determinants of health care expenditure in the older popula-tion is therefore of high importance. Many epidemiological studies show that there is
seasonal variation in mortality,1-16 but whether medical care expenditure (MCE) also
shows seasonal variation has not been formally investigated. Since individual levels of
MCE rise steeply prior to death,17-22 it seems only logical that – as a direct result of
sea-sonal variation in mortality – there is seasea-sonal variation in MCE. However, the level of MCE may also change with the seasons due to changes in non-fatal forms of morbidity. It is therefore tempting to study seasonal differences in older people’s health also by focusing on changes in health care utilization and expenditure separately for individu-als who died and those who survived.
It has been found that mortality rates in the older population rise during winter
time in Europe,8-10,16 the US,6 and low and middle income countries,5,12 and
New-Zea-land.4 Summers are also associated with higher mortality rates.2,3,6,11 A very recent
multi-country investigation shows that mortality rates gradually increase with colder
temperatures, but also show a sudden increase when excessive heat occurs.7 Many
dif-ferent factors are thought to underlie the association between ambient temperature
and morbidity and mortality, such as changes in the risk cardiovascular events,23,24
sus-ceptibility to infectious diseases,14,25,26 and the risk of incurring a hip fracture.27 The
oc-currence of more strokes and hip fractures during cold seasons implies that the demand for institutional care is higher during these seasons. Some studies find that the effect of
seasonal variation is more prominent in women than men.4,9,16 Socioeconomic
differ-ences did not influence the associations.8,15
34
Methods
The Dutch health care system
Health care in the Netherlands can be separated into two main sectors: medical care and long-term care. Medical care refers to consultations, medication and treatment from general practitioners, medical specialists, dentists, pharmacists, and therapists (such as physiotherapists and psychotherapists). Some forms of instrumental aid and transportation are also provided through the medical care sector. In the studied time period, health care providers bill health care insurers in the form of diagnosis related groups. Medical care is legally arranged through the Health Insurance Act (HIA).
Long-term care in the Netherlands is legally arranged through the Exceptional Medical Expenses Act (EMEA). Entitled to care through the EMEA are people who can-not provide in their basic care needs independently due to a physical, psychogeriatric or psychiatric ailment, or a mental, physical or sensorial handicap. Before someone may receive long-term care through the EMEA, the Center for Indication Setting has to eval-uate the client’s health status and issue an official indication. When an indication is set
for a client, the actual provision of long-term care is arranged by so-called care offices.
After an indication is set, the care office appoints a health care provider for a client, or distributes a personal budget. The health care insurer who has the highest share of cli-ents in a region acts as the care office for that region.
Indications for residential care are defined in type and level (hours per week).
Since July 1st 2007, residential care is indicated in terms of Care Weight Packages
(CWPs). CWPs are pre-defined bundles of care, consisting of different types of long-term care on different levels, complemented with residence. From July 2007 through December 2010, residential care was categorized into ten CWPs: the first four relate to different types of residential care in care homes, the second four to nursing homes, the
9th to rehabilitation, and the 10th to palliative care.
Ethics statement
After consulting the internal review board (IRB) of the regional health insurer, data on health care expenditure were retrieved from a health insurer. A formal waiver of IRB
approval was received from Statistics Netherlands (Centraal Bureau van de Statistiek)
35
could then only access the de-identified data in a secured room of Statistics Nether-lands. The authors had no access to identifying information. Any output destined for publication was first scrutinized by the IRB of Statistics Netherlands, so no output could be traced back to individuals. No data are publicly available. Data collection and analysis was in full accordance with privacy legislation and protocol.Data
With the aim to perform multiple studies on the association between the life situation
of older people and their health care expenses, the Leiden Health care Costs in Old Age
(LHCOA) study was started in 2011. For this study, data on health care expenses of 61,495 people aged 65 and older in a period of 42 months were retrieved from a re-gional Dutch health insurance company and matched with data on socio-economic char-acteristics from Statistics Netherlands. Data were collected using the following steps:
1. After consulting the IRB (legal department) of the regional health insurance
com-pany, data on MCE were retrieved from the management information system of the health insurance company. Data were collected for the period July 2007 through 2010 for all persons who lived in the regions where the health care insurer acted as the long-term care office, and who reached the age of 65 before 2011. Addresses were linked with data on socio-economic status by postal code, provided by the Netherlands Institute for Social Research
2. In accordance with the IRB of the health insurance company, data on long-term care
utilization were collected from the EMEA Care Registration system (ECR), an infor-mation system which offers an oversight of all the coded messages that are sent between organizations active within the confounds of the EMEA. ECR messages designating the start and end of long-term care provision were used to determine whether a client was institutionalized. Institutionalization rate was defined as the admission rate to care and nursing homes.
3. After consulting the IRB of Statistics Netherlands a single transfer of data from the
36
The total study population of the LHCOA study (n=61,495) was used to investigate the association between the seasons and mortality, medical care expenditure (MCE) and institutionalization rate. If an association between seasonal change and mortality as well as MCE is found, it will be unclear whether the association with MCE is caused by mortality in combination with the high costs of dying, or whether there is a direct asso-ciation between seasonal changes and MCE. Therefore, the total study population was divided into two groups: subjects who died before 2012 (n=9,202), and those that sur-vived until 2012 (n=52,293). If an association between seasonal changes and MCE ex-ists in the survivor group, there is evidence for a direct association, separate from mor-tality rates and the costs of dying.
Besides splitting up the study population into a deceased and non-deceased group, we also separated subgroups on the basis of age, gender, and residential status. We divided the population in community-dwellers and institutionalized subjects to fur-ther investigate the link between mortality and outside temperature. Institutionalized subjects were admitted in a care home or nursing home and were therefore predomi-nantly or even exclusively exposed to a constant inside temperature. If there is also sea-sonal variation in mortality for the institutionalized, it is plausible that seasea-sonal varia-tion is caused by other factors than temperature alone.
Statistical analysis
Seasons represent three-monthly periods. In the Netherlands, the winter season
offi-cially starts on December 21st and ends on March 20th. Therefore, winter data were
de-fined as January, February and March. Spring, summer and autumn were dede-fined using the subsequent three monthly periods.
The Seasonal and Trend decomposition using Loess (STL) method was used to analyse seasonal variation in mortality risk, MCE, and institutionalization rate. The STL method decomposes longitudinal data into a long-term trend, seasonal variation, and remaining variation that does not stem from the long-term trend or from seasonal
var-iation.28 The long-term trend in the STL method reflects an array of possible external
37
Results
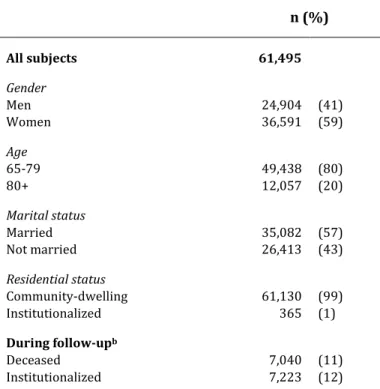
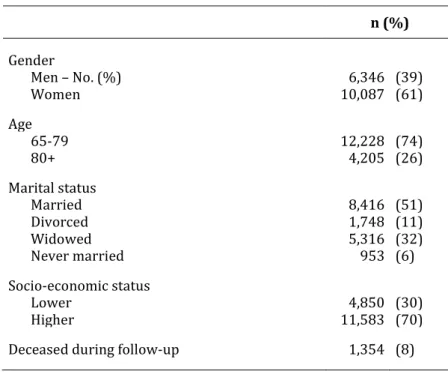
Table 1 shows the characteristics of the study population. The study population in-cludes 61,495 subjects aged 65 years and older, with an average follow-up of 35.7 months. Socio-demographic characteristics are shown for the first month of follow-up. Also shown is the number of deaths and institutionalizations during follow-up.
Table 1. Characteristics of the study population.a n (%)
All subjects 61,495
Gender
Men 24,904 (41)
Women 36,591 (59)
Age
65-79 49,438 (80)
80+ 12,057 (20)
Marital status
Married 35,082 (57)
Not married 26,413 (43)
Residential status
Community-dwelling 61,130 (99)
Institutionalized 365 (1)
During follow-upb
Deceased 7,040 (11)
Institutionalized 7,223 (12)
a Data on these characteristics refer to the first month of follow-up.
b Average individual follow-up is 35.7 months.
38
39
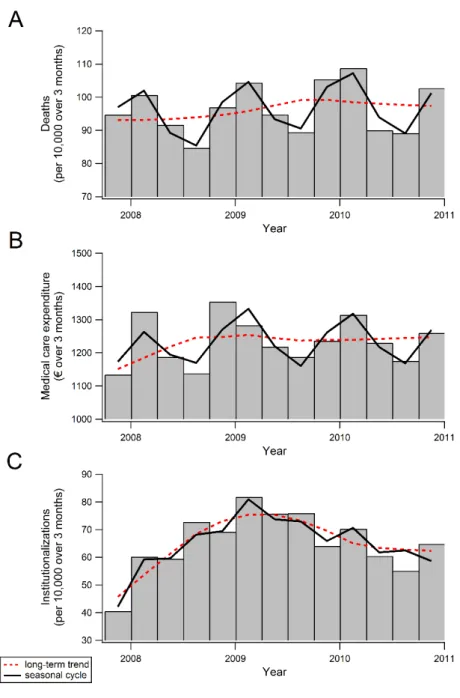
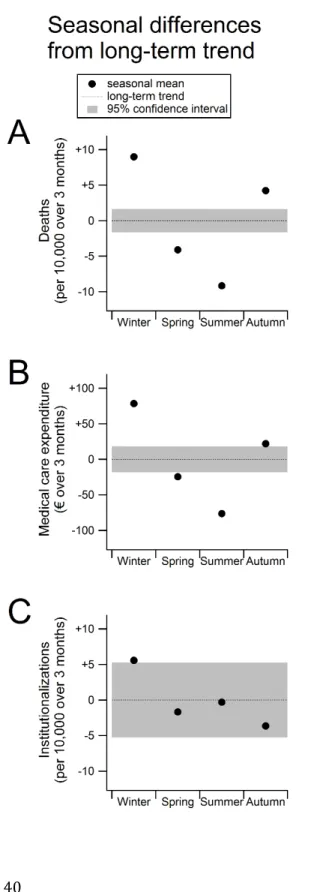
Figure 2 shows the seasonal variation for mortality rates (panel A), MCE (panel B), and institutionalization rates (panel C). The figure expresses the absolute difference from the long-term average. The average of all years and seasons is set at zero with the cor-responding confidence interval as a coloured band. When the point estimate of the sea-sonal component is outside this confidence interval, it is significantly different from the long-term trend. Visible from figure 2 is that all seasonal means differ significantly from the long-term trend for mortality and MCE. Institutionalization rates only differ signifi-cantly from the long-term average during the winter period.The average number of deaths (fig 2, panel A) in every season (all three months) was 96 per 10,000 persons from July 2007 through 2010 according to the long-term trend. On average, there are 9 more deaths per 10,000 population in all three months of the winter period (+9%). Similarly, per 10,000 population there are 4 less deaths in the spring (–4%), 9 less in the summer (–9%), and 4 more in the autumn (+4%). There-fore, the average number of deaths per 10,000 population was 87 in the summer and 105 in the winter. Relatively, the number of deaths in older people is thus 21% higher in the winter than in the summer.
Panel B of figure 2 shows that MCE is also higher in the autumn and winter than in the spring and summer. Average MCE per person was €1,231 per season (all three months) in the studied time period (based on the long-term trend). Expenditure per person was €79 above this average in the winter (+6%), €24 lower in the spring (–2%), €76 lower in the summer (–6%), and €23 higher in the autumn (+2%). Consequently, seasonal MCE rises with 13% from the summer to the winter (€1,155 vs. €1,310 per person).
41
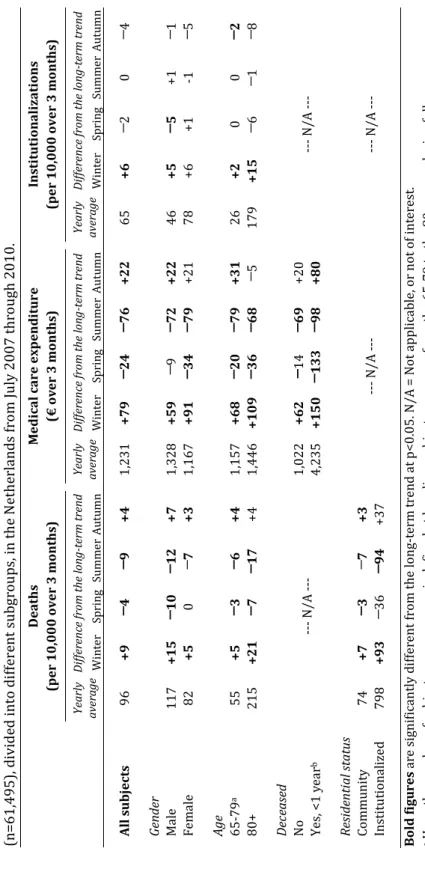
In table 2, the specific data are shown for the mortality rates, MCE, and institutionaliza-tion rates for the total study populainstitutionaliza-tion (described above), as well as for subgroups based on gender, age, residential status and vital status. Visible in table 2 is that for both the deceased and non-deceased subgroup, MCE is higher in the autumn and winter and lower in the spring and summer. Average MCE was €1,022 per season for individuals surviving, and expenditure was €62 above this average in the winter (+6%), €14 lower in the spring (–1%), €69 lower in the summer (–7%), and €20 higher in the autumn (+2%). Consequently, MCE for the non-deceased group is 14% higher in the winter than in the summer (€1,084 vs. €953). In contrast to all the other subgroups, the lowest level of MCE in the deceased group is not reached in the summer, but in the spring. Seasonal variation is less pronounced in the deceased group: MCE is 6% lower in the summer than in the winter for individuals in their last year before death (€4,385 vs. €4,137), and 7% lower in the spring (€4,385 vs. €4,102).There is greater seasonal variation in the mortality of men than that of women: the male mortality rate is 26% higher in the winter than in the summer, and this differ-ence is 16% for women. In contrast, seasonal changes in MCE are more prevalent for women than for men: MCE is 16% higher in the winter than in the summer for women, and this difference is 10% for men. There is not much difference between the two age groups concerning seasonal variation in mortality rates, MCE and institutionalization rates. However, seasonal variations are slightly more concentrated in a winter peak for the older patients, and more dispersed throughout the seasons for younger patients.
42
T a b le 2 . S e a so n a l v a ri a ti o n i n m o rt a li ty r a te s, m e d ic a l ca re e x p e n d it u re a n d i n st it u ti o n a li za ti o n r a te o f a n o ld e r p o p u la ti o n (n = 6 1 ,4 9 5 ), d iv id e d i n to d if fe re n t su b g ro u p s, i n t h e N e th e rl a n d s fr o m J u ly 2 0 0 7 t h ro u gh 2 0 1 0 . D e a th s (p e r 1 0 ,0 0 0 o v e r 3 m o n th s) M e d ic a l c a r e e x p e n d it u r e (€ o v e r 3 m o n th s) In st it u ti o n a li z a ti o n s (p e r 1 0 ,0 0 0 o v e r 3 m o n th s) Y ea rl y a ve ra g e D if fe re n ce fr om t h e lo n g -t er m t re n d Y ea rl y a ve ra g e D if fe re n ce fr om t h e lo n g -t er m t re n d Y ea rl y a ve ra g e D if fe re n ce fr om t h e lo n g -t er m t re n d W in te r S p ri n g S u m m e r A u tu m n W in te r S p ri n g S u m m e r A u tu m n W in te r S p ri n g S u m m e r A u tu m n A ll s u b je c ts 9 6 + 9 ─ 4 ─ 9 + 4 1 ,2 3 1 + 7 9 ─ 2 4 ─ 7 6 + 2 2 6 5 + 6 ─ 2 0 ─ 4 G en d er M a le 1 1 7 + 1 5 ─ 1 0 ─ 1 2 + 7 1 ,3 2 8 + 5 9 ─ 9 ─ 7 2 + 2 2 4 6 + 5 ─ 5 + 1 ─ 1 F e m a le 8 2 + 5 0 ─ 7 + 3 1 ,1 6 7 + 9 1 ─ 3 4 ─ 7 9 + 2 1 7 8 + 6 + 1 -1 ─ 5 A g e 6 5 -7 9 a 5 5 + 5 ─ 3 ─ 6 + 4 1 ,1 5 7 + 6 8 ─ 2 0 ─ 7 9 + 3 1 2 6 + 2 0 0 ─ 2 8 0 + 2 1 5 + 2 1 ─ 7 ─ 1 7 + 4 1 ,4 4 6 + 1 0 9 ─ 3 6 ─ 6 8 ─ 5 1 7 9 + 1 5 ─ 6 ─ 1 ─ 8 D ec ea se d N o --- N / A - --1 ,0 2 2 + 6 2 ─ 1 4 ─ 6 9 + 2 0 --- N / A - --Y e s, < 1 y e a r b 4 ,2 3 5 + 1 5 0 ─ 1 3 3 ─ 9 8 + 8 0 R es id en ti a l s ta tu s C o m m u n it y 7 4 + 7 ─ 3 ─ 7 + 3 --- N / A - --- N / A - --In st it u ti o n a li ze d 7 9 8 + 9 3 ─ 3 6 ─ 9 4 + 3 7 B o ld f igu r e s a re s ig n if ic a n tl y d if fe re n t fr o m t h e l o n g -t e rm t re n d a t p < 0 .0 5 . N / A = N o t a p p li ca b le , o r n o t o f in te re st .a H
e re , t h e n u m b e r o f su b je ct s p e r a g e g ro u p i s d e fi n e d a t b a se li n e ; su b je ct s ca n m o v e f ro m t h e 6 5 -7 9 t o t h e 8 0 + g ro u p d u ri n g f o ll o w -u p .
b T
43
Institutionalization rates are consistently lowest in the autumn and highest in the win-ter, regardless of which subgroup is considered. The size of the relative differences be-tween the autumn and the winter are also similar across subgroups: the lowest ence is 13%, found in males and those aged 80 years and older, while the highest differ-ence is 17%, found in those aged younger than 80 yearsDiscussion
We find that older people die more in the winter and autumn than in the spring and summer. Furthermore, their average level of MCE is considerably higher in the winter than in the spring and summer, and their risk of institutionalization peaks in the winter. Seasonal variation is stronger for men than women, but rather similar between age groups, deceased and non-deceased subjects, and institutionalized and community-dwelling elderly.
Interpretation of results
Previous studies already showed that mortality in the older population is associated
with the seasons,1-16 but seasonal variation in MCE is a novel finding. The changes in
mortality, MCE and institutionalization suggest that older people’s health is affected by the seasons. It has been found that health is affected by harsh climate conditions, such
as cold temperatures,1,2,4,7-10,12,13,15,16 and heat waves.2,3,6,7,9,11-13 In contrast to some of
these studies, we did not find increased mortality rates during the summer. Higher mor-tality rates in the summer are related to extremely hot temperatures, mainly during heat waves. Extreme hot temperatures are not common in the Netherlands, and, when they occur, usually last only several days.
Different biological pathways could underlie the influence of ambient tempera-ture on older peoples’ health. For example, it has been found that colder temperatempera-tures
are associated with increased blood pressure,29,30 higher blood-clotting activity,31 and
decreased lung function in COPD patients.32 In contrast, very warm temperatures can
also cause physical problems. For example, the thermoregulatory function and heart
rate variability of older people decrease during extremely warm days.33,34 We could not
44
play a major role in the seasonal variations found in this study, as the institutionalized elderly are subjected to relatively constant inside temperatures.
Besides ambient temperature, there are many different season-dependent fac-tors that potentially affect population health. First, it is possible that flu underlies sea-sonal variation in mortality and MCE, as prevalence rates of flu are higher in the winter, and institutionalized people are also – or even more – susceptible to flu compared to
those in the community setting.35 Second, snow and ice may increase the risk of falls
and resulting fractures, especially in older people in the community setting.26 Third,
studies have shown that sunlight has a positive effect on health, such as pain after spinal
surgery,36 and length of stay and survival after myocardial infarction.37 Fourth, the level
of air pollution shows an association with seasonal changes, and air pollution has an
important impact on health outcomes, such as mortality,38 stroke,39 diabetes,40 mental
health,41,42 and even atherosclerosis.43 Fifth, there is evidence that atmospheric
pres-sure and humidity also affect population health.44,45 Sixth, and finally, it is possible that
the demand and supply of outpatient care is lower during the summer due to the sum-mer holidays of clinicians and patients, also leading to lower expenditure levels in this season. However, if this would be a major cause of the found seasonal variation in MCE, it would be more plausible that MCE is highest in the autumn, and not in the winter, because outpatient care would peak after the summer holidays.
A higher prevalence of flu in the winter, as well as reduced hours of sunlight, may explain why older people in residential care also show seasonal variation in their mor-tality rates. Our analysis shows that men suffer more from seasonal changes than
women, which stands in contrast to other findings.3,8,15 It is unclear why our results
dif-fer from these previous findings, but it is possible that our study population shows dis-crepancies with those used in previous studies.
45
Strengths and weaknesses
The existence of seasonal variation in MCE, both close to death as well as independent from impending death, and institutionalization is a novel finding. For the purpose of our analysis, we were able to analyse data on a large study population, which could be sep-arated into several subpopulations, and we used an advanced statistical method to dis-entangle seasonal variation from a long-term trend and other variation. However, the time period over which we could perform our analysis was rather short (three and a half years). Because, in addition, the data pertained to monthly or quarterly averages, we could not assess the proportional impact of flu, snow and ice, air pollution, sunlight, ambient temperatures, or other climate conditions on mortality, MCE and institutional-ization. Another issue pertains to the representativeness of the study population. The study population consists of clients from one health insurer within specific regions of the Netherlands. Although the study population is quite comparable to the Dutch pop-ulation aged 65 and older in terms of gender and marital status, the number of people
aged 80 and older in the study population was relatively low (20% vs. 26.5%).46 We
could not ascertain how representative our study population was in terms of other characteristics.
Implications and future research
We performed this study for three reasons: (1) to make policy-makers aware of the im-pact the seasons can have on the health of older people (if any), as well as the collective health care budget; (2) to show epidemiologists and health economists if and how much the seasons affect MCE and institutionalization rates; and (3) to find out if specific pa-tients groups are more at risk during certain seasons – in this case policy-makers and clinicians will know which patient groups will most likely benefit from targeted inter-ventions.
46
Furthermore, seasonal variation in mortality rates and medical care expenditure could warrant policy changes that could benefit older people and/or decrease the expendi-ture levels. The finding that institutionalized elderly have a more pronounced seasonal variation in mortality, show that these people may benefit from programmes targeting health care workers’ vaccination or hygiene, improving sunlight exposure or vitamin D status, or promoting better climate control in residential care facilities. To prevent in-creased levels of MCE or deaths of community-dwellers in the colder seasons, it is of primary importance that we understand which climate conditions impact their health, and through which biological pathways.
Further investigations into seasonal changes in health, MCE and mortality should preferably use daily data over a long period in time, and include many different varia-bles, such as ambient temperature, flu prevalence, sunlight hours, air pollution, atmos-pheric pressure, and humidity. Furthermore, including data on the types of illness or causes of death could disclose which biological pathways are mainly associated with seasonal changes in health and expenditure.
Conclusions