CD30-REDIRECTED CHIMERIC ANTIGEN RECEPTOR T CELLS TARGET EMBRYONAL CARCINOMA VIA ANTIGEN-DEPENDENT AND FAS/FASL INTERACTIONS
Lee Kyung Hong
A dissertation submitted to the faculty at the University of North Carolina at Chapel Hill in partial fulfillment of the requirements for the degree of Doctor of Philosophy in the Department of Microbiology
and Immunology.
Chapel Hill 2018
Approved by:
Gianpietro Dotti
Barbara Savoldo
Shehzad Sheikh
Roland Tisch
Yisong Wan
iii ABSTRACT
Lee Kyung Hong: CD30-Redirected Chimeric Antigen Receptor T Cells Target Embryonal Carcinoma via Antigen-dependent and Fas/FasL Interactions
(Under the direction of Gianpietro Dotti)
Embryonal carcinomas (ECs) and mixed testicular germ cell tumors (TGCTs) containing EC express CD30 and are the most aggressive TGCT subtypes. Chimeric antigen receptor T cells (CAR-Ts) combine the cytotoxic properties of T cells with the antigen specificity of monoclonal antibodies to target antigen-expressing cells, such as infected or cancerous cells. CAR-Ts targeting CD30 (CD30.CAR-Ts) have shown robust anti-tumor activity against Hodgkin’s lymphoma, but have not been tested against solid tumors. We tested whether CD30.CAR-Ts could also target ECs using in vitro and in vivo models. CD30.CAR-Ts exhibited anti-tumor activity in vitro against the human EC cell lines Tera-1, Tera-2 and NCCIT, and putative EC stem cells identified by Hoechst dye staining. Cytolytic activity of Ts was complemented by sustained proliferation and pro-inflammatory cytokine production. CD30.CAR-Ts also demonstrated anti-tumor activity in an in vivo xenograft NSG mouse model of metastatic EC. Remarkably, we observed that CD30.CAR-Ts, while targeting CD30+ EC tumor cells through the CAR
(i.e. antigen-dependent targeting), also eliminated surrounding CD30– EC cells in an antigen-independent
manner via cell-cell contact-dependent Fas/FasL interaction. In addition, inducing Fas (CD95) expression in CD30+ but Fas– EC was sufficient to improve CD30.CAR-T anti-tumor activity. Overall, these data
iv
v
ACKNOWLEDGMENTS
To my mentors Dr. Gianpietro Dotti and Dr. Barbara Savoldo, thank you for the invaluable guidance you have given me during my PhD training. I am grateful to have been given the opportunity to contribute to the exciting and growing field of cancer immunotherapy. To the Savoldo/Dotti laboratory members, thank you for making every day coming into lab exciting, intellectually stimulating, and most of all a great place to work. I appreciate your helpful discussions, both formal and informal, in making me a better scientist.
Many thanks also go to the mentors who have inspired me along the way. Dr. Susan Henning as advisor for the UNC Advocates for MD/PhD Women in Science (AMPWIS) student group, thank you for your encouragement and example. Thanks to the UNC MD/PhD program leadership – Dr. Mohanish Deshmukh, Dr. Toni Darville, Alison Regan, Carol Herrion, Dr. Kimryn Rathmell (former), and Dr. Eugene Orringer (former). In particular, I wouldn’t be where I am today without Dr. Orringer, who recruited me to UNC and instilled me with confidence that I could fulfill my dream of becoming a physician-scientist. Dr. “O,” I miss you and hope to do you proud.
Finally, many thanks go to my family and friends who have loved and supported me through the many ups and downs of my training. A special thanks goes to my parents, who have shown me
vi
TABLE OF CONTENTS
LIST OF TABLES ... viii
LIST OF FIGURES ... ix
LIST OF ABBREVIATIONS ... xi
CHAPTER 1: INTRODUCTION ... 1
1.1 Tumor infiltrating lymphocyte (TIL) therapy for solid tumors ... 1
1.2 Engineered T cell receptor (TCR) T cell therapy for solid tumors ... 2
1.3 Chimeric antigen receptor (CAR) T cell therapy for solid tumors ... 3
1.4 Development of CD30-specific CAR-Ts (CD30.CAR-Ts) ... 6
CHAPTER 2: CD30.CAR-Ts TARGET EMBRYONAL CARCINOMA ... 10
2.1 Introduction ... 10
2.2 Methods ... 12
2.3 Results ... 18
2.4 Discussion ... 23
2.5 Authorship Contributions ... 26
2.6 Figures ... 27
2.7 Tables ... 50
CHAPTER 3: DISCUSSION ... 56
vii
3.2 CD30.CAR-Ts utilize Fas/FasL interactions to target ECs with
heterogeneous antigen expression ... 57
3.3 CD30.CAR-Ts introduce Fas/FasL interactions in a localized manner ... 58
3.4 Improvements to CD30.CAR-Ts for optimal T cell trafficking and persistence in vivo ... 60
APPENDIX 1: EPIGENETIC DYSFUNCTION IN TURNER SYNDROME IMMUNE CELLS ... 64
APPENDIX 2: COMBINATION CENTRAL TOLERANCE AND PERIPHERAL CHECKPOINT BLOCKADE UNLEASHES ANTI-MELANOMA IMMUNITY ... 76
viii
LIST OF TABLES
Table 1.1: Comparison of Adoptive T Cell Therapies………... 9
Table 2.1: List of differentially expressed apoptosis and p53-related genes between
NCCIT and Tera-1 cells………..51
Table 2.2: List of differentially expressed apoptosis and p53-related genes between
NCCIT and Tera-2 cells………..53
Table 2.3: List of differentially expressed apoptosis and p53-related genes between
ix
LIST OF FIGURES
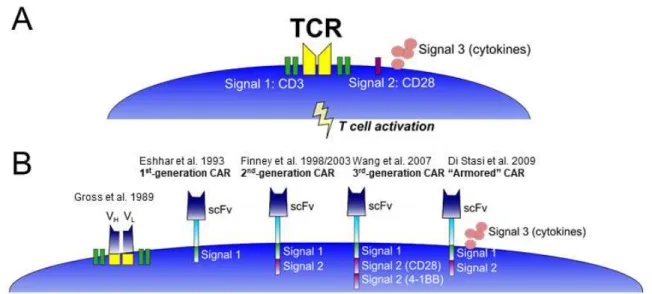
Figure 1.1: Chimeric antigen receptor (CAR) evolution………... 8
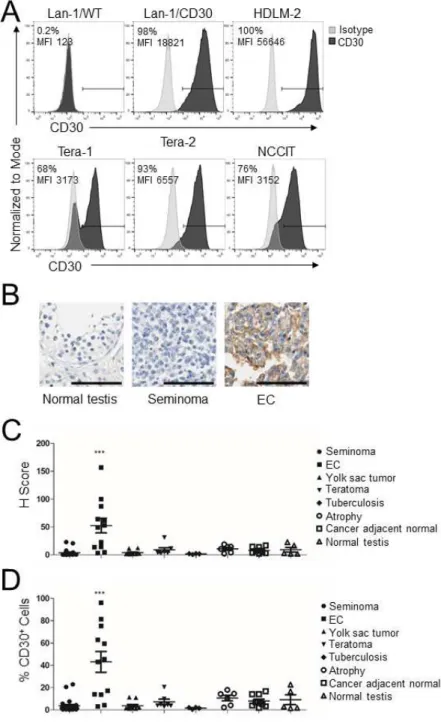
Figure 2.1: CD30 is expressed by EC cell lines and primary ECs.………..27
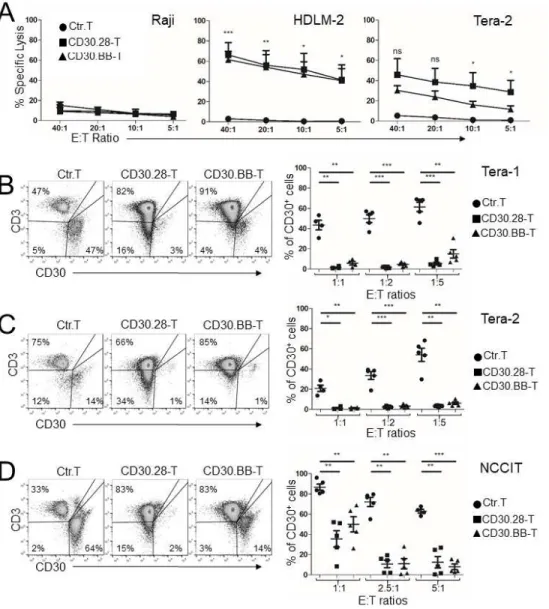
Figure 2.2: CD30.CAR-Ts exhibit cytotoxic activity against EC cell lines in vitro….………...29
Figure 2.3: EC-derived SP cells are targeted by CD30.CAR-Ts………. 30
Figure 2.4: CD30.CAR-Ts localize to EC tumors and exhibit anti-tumor activity in vivo………..32
Figure 2.5: CD30.CAR-Ts eliminate Tera-1 CD30– cells in a cell contact-dependent but antigen-independent manner………. 34
Figure 2.6: Functional Fas-FasL interaction is critical for the elimination of CD30– EC cells and enhances anti-tumor activity of CD30.CAR-Ts……….36
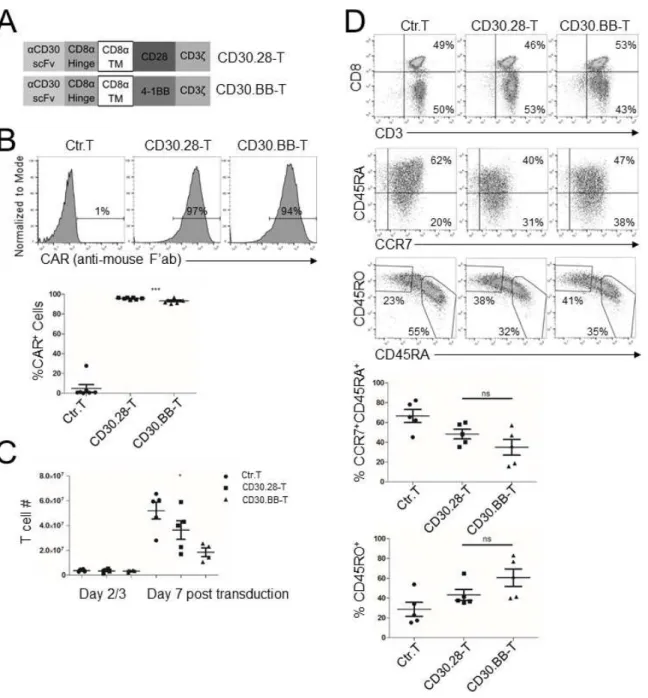
Figure 2.S1: CD30.CAR-T characteristics……….. 38
Figure 2.S2: Co-culture of CD30.CAR-Ts and tumor cells……….40
Figure 2.S3: CD30.CAR-Ts proliferate and secrete pro-inflammatory cytokines in response to EC cell lines………. 42
Figure 2.S4: CD30.CAR-T expansion and anti-tumor activity in vivo……… 43
Figure 2.S5: Tera-1 CD30– cells are eliminated by CAR-Ts in a cell contact-dependent but antigen-independent manner………. 45
x
Figure 2.S7: Tera-2 cells are susceptible to antigen-independent killing by CD30.CAR-Ts,
while NCCIT cells are resistant to CD30.CAR-T targeting………... 48
xi
LIST OF ABBREVIATIONS
ALCL Anaplastic large cell lymphoma
ANOVA Analysis of variance
BLI Bioluminescence
CAIX Carbonic anhydrase 9
CAR Chimeric antigen receptor
CAR-Ts Chimeric antigen receptor T cells
CD30.28-T CD30-redirected chimeric antigen receptor T cell with CD28 endodomain
CD30.BB-T CD30-redirected chimeric antigen receptor T cell with 4-1BB endodomain
CD30.CAR-T CD30-redirected chimeric antigen receptor T cell
CEA Carcinoembryonic antigen
CFSE Carboxyfluorescein succinimidyl ester
CRS Cytokine release syndrome
CTLs Cytotoxic T lymphocytes
DR Death receptor
EBV Epstein-Barr virus
EC Embryonal carcinoma
EGFRvIII Epidermal growth factor receptor variant III
xii Fc Constant fragment
FDA Food and Drug Administration
FR Folate receptor
Fv Variable fragment
GBM Glioblastoma multiforme
HBSS Hank’s Balanced Salt Solution
HL Hodgkin’s Lymphoma
HLA Human leukocyte antigen
IACUC Institutional Animal Care and Use Committee
IFNγ Interferon gamma
IHC Immunohistochemistry
IL-2 Interleukin-2
IL-15 Interleukin-15
i.v. Intravenous
mAb Monoclonal antibody
MHC Major histocompatibility complex
MMAE Monomethyl auristatin E
NSG NOD/SCID/γcnull
NS-TGCTs Non-seminoma testicular germ cell tumors
xiii
RANTES regulated on activation, normal T cell expressed and secreted; also known as chemokine ligand 5 (CCL5)
scFv Single-chain variable fragment
TCRs T cell receptors
TGCTs Testicular germ cell tumors
TILs Tumor infiltrating lymphocytes
TNFα Tumor necrosis factor alpha
TRAIL TNF-related apoptosis-inducing ligand
1
CHAPTER 1: INTRODUCTION
Boosting the immune system to kill cancer cells has a more than 100-year history, beginning in 1891 when William Coley, upon observing that cancer patients with infections showed better tumor control, used a mixture of heat-killed bacteria to induce regression of inoperable sarcomas (1). Adoptive T cell therapy harnesses the properties of cytotoxic T lymphocytes (CTLs), an arm of the adaptive immune system, to circulate systemically, migrate, and target unwanted cells such as infected and/or cancerous cells while sparing normal cells. As “living drugs,” T cells have multiple advantages over conventional therapies such as the ability to a) mount a specific cytotoxic immune response against target cells which can involve recruitment of other immune cells, b) proliferate in response to antigen stimulation, and c) survive long-term in vivo (1). T cell therapies against solid tumors, which pose their own unique challenges compared to hematological malignancies, have been tested in clinical trials over the past thirty years with varying success. Here, advances in adoptive T cell therapy and the evolution of chimeric antigen receptor T cells (CAR-Ts) against solid tumors, with an emphasis on CD30-specific CAR-Ts, will be discussed.
1.1 Tumor infiltrating lymphocyte (TIL) therapy for solid tumors
2
Early clinical trials using TILs for melanoma showed promising results with 60% objective response (12;13), but relied on the use of recombinant IL-2 to expand TIL numbers in vitro after isolation from tumor biopsies. These protocols were further modified, for example by continuous administration of recombinant IL-2 (14), lymphodepletion prior to TIL infusion (15-17), or more recently using short-term cultured TILs (18) to further improve TIL expansion and persistence after infusion in patients. Based on these early results for melanoma, TIL clinical trials were subsequently expanded for other cancers. For renal cell carcinoma, TIL therapy with recombinant IL-2 showed a 9.1% complete response and 25.5% partial response (19). In addition, 29% of patients who received TILs with continuous infusions of IL-2 showed an objective tumor response (14). Stage III non-small cell lung carcinoma patients (20) and epithelial ovarian cancer patients (21) also showed an improvement in reduced local relapse and improved disease-free survival compared to standard chemotherapy alone.
However, many hurdles remained for TIL therapy that limited its applicability. Only a fraction of cancer patients qualified for TIL therapy based on several criteria: a) a resectable tumor that is TIL positive, b) TILs that can be successfully isolated and expanded, and c) TILs that exhibit anti-tumor activity (22). Because of the high number of TILs required (on the order of 1010-11), in vitro expansion was laborious and
took several weeks (23;24) and was not feasible for some TILs (25). In addition, whether TILs contain tumor specific CTLs was difficult to test due to limited numbers of TILs and the requirement for fresh viable autologous and allogeneic tumor cells for screening purposes. Several studies even showed mixed results or little benefit of TIL therapy (8;26;27). Subsequently, engineered T cells containing either T cell receptors (TCRs) or chimeric antigen receptors (CARs) were tested to develop an adoptive T cell therapy that used lower T cell numbers while maintaining tumor antigen specificity.
1.2 Engineered T cell receptor (TCR) T cell therapy for solid tumors
3
shorten the manufacturing process compared to TILs, which require higher T cell numbers. Engineered TCRs can also recognize both extracellular and intracellular targets that are MHC-presented, thus broadening the scope of tumor-associated antigens to target compared to CARs, which only recognize extracellular antigens.
Morgan et al (30) published the first report of MART-1 TCR T cells mediating tumor regression. Subsequent studies combining MART-1 TCR T cells with dendritic cell vaccination resulted in tumor regression among 69% of participants (31). TCR T cells against other melanoma antigens such as gp100 (32) and NY-ESO-1 (33) showed promising results, though these trials had small cohorts. NY-ESO-1 TCR T cells, in particular, have been further tested in multiple myeloma with 50% progression-free survival (34) and synovial cell sarcoma with 61% objective response (33;35). Other tumor-associated antigens such as CEA (36) and cancer testis antigens MAGE-A3 (37;38) and MAGE-A4 (39) have been targeted using TCR T cell therapy.
However, there are several limitations to engineered TCRs. First, the number of patients who can benefit from TCR therapy is limited based on HLA haplotype (40). TCR affinity for cancer targets, as opposed to viral peptides, is typically in the low micromolar range since many tumor-associated antigens are derived from self antigens (41); this low affinity can further limit the activation and cytotoxicity of engineered TCR T cells. In addition, new unintended specificities may derive from mispairing with endogenous chains or as consequence of artificial enhancement of affinity (42;43). Finally, tumor cells can escape TCR T cell targeting by downregulating HLA expression (44). An alternative approach, which does not rely on HLA expression and antigen presentation, was also needed.
1.3 Chimeric antigen receptor (CAR) T cell therapy for solid tumors
4
the TCR with heavy and light chain Fv domains. They showed that the chimeric receptor endowed T cells with the ability to recognize its target antigen in a non-MHC restricted manner and induced T cell activation and IL-2 production. Chimeric antigen receptor T cells (CAR-Ts), unlike engineered TCR T cells, do not rely on pairing for proper activation through the receptor. Instead, the extracellular single-chain variable fragment (scFv) of the CAR recognizes the target antigen in a MHC-independent manner and with higher affinity than TCRs (46).
Over its 20-plus year history, CARs have undergone several major modifications to improve its function (Fig.1B). The first major milestone in CAR development was when Zelig Eshhar and colleagues fused a scFv to a transmembrane domain and intracellular CD3ζ endodomain, called the T-body or first-generation CAR (47). Eshhar’s group subsequently showed CAR-T lytic activity against ovarian cancer cell lines (48), Neu/HER2 expressing transformed cells (49), and B cell lymphomas (50). However, these first-generation CARs were unable to activate resting or naïve T lymphocytes, and CAR-Ts produced limited amounts of cytokines (51). Second-generation CARs integrated endodomains from co-stimulatory molecules traditionally provided as “signal 2” of TCR-mediated activation, such as CD28 (52), ICOS (53), CD134 (OX40R) (54), and CD137 (4-1BB) (55) to further enhance T cell proliferation and cytokine production. CAR-Ts have also been further engineered to express cytokines or co-stimulatory ligands to further support their proliferation and/or migration to tumor sites (56).
5
endodomain transmits T cell signals to induce activation in a similar manner to TCR-mediated activation (47).
Early pre-clinical models showed promising improvements (52;54), and were more specifically designed against solid tumor antigens prostate-specific membrane antigen (PSMA) (59) and CEA (60), or the leukemia/lymphoma antigen CD19 which is the most commonly studied CAR to date (55;61-63). Third-generation CARs, which incorporate an additional co-stimulatory molecule, showed enhanced cytokine production, sustained proliferation, and better tumor control in vivo compared to either co-stimulatory molecule alone (64-66), but clinical experience with third-generation CARs is limited (67). CAR-Ts have been further engineered to express cytokines or co-stimulatory ligands to further improve T cell persistence, homing, and anti-tumor activity in vivo, or “armored” CARs (56).
6
manufacturing process, as well as to target antigens. A comparison between these adoptive T cell therapies is summarized in Table 1.
1.4 Development of CD30-specific CAR-Ts (CD30.CAR-Ts)
CD30 (encoded by TNFRSF8) is a member of the TNF receptor superfamily that was initially discovered in Reed-Sternberg cells of Hodgkin’s Lymphoma (HL) (80-83). Its extracellular domain can be cleaved to produce a soluble form, which can be released into the serum (84), but importantly antibody binding of CD30 is unaffected even in the presence of soluble CD30 (85). CD30 ligand (CD30L, or CD153), also a member of the TNF family, can be membrane-bound or soluble. Binding of CD30 with its ligand induces downstream signal transduction and activation of NF-kB (86); however, its function is variable depending on context and target cells. While CD30 function in normal cells like lymphocytes is unclear, CD30 has been shown to promote cell proliferation and survival in transformed embryonic stem cells (87).
Because of its limited expression in normal tissues and high expression in Reed-Sternberg cells, CD30 has been targeted by multiple investigators using monoclonal antibodies. Initial studies were done in 1992 using the CD30 murine monoclonal antibody Ber-H2 and showed tumor localization but no anti-tumor activity (88). Other CD30-targeting antibodies, such as Ber-H2 conjugated to the Saproin toxin (89;90) or human anti-CD30 monoclonal antibody (91) showed modest responses. Brentuximab vedotin (BV), an antibody-drug conjugate of an anti-CD30 antibody with a potent anti-microtubule cytotoxin monomethyl auristatin E (MMAE) (92), has shown the highest response rates to date for anti-CD30 antibody therapy (93-95) and was subsequently approved by the FDA in 2011 for relapsed HL (84).
7
the native TCR and EBV-CD30+ HL cells through the CAR (97). Importantly, although a subpopulation of
activated T cells express CD30, CD30.CAR-Ts did not impair adaptive immune responses (97).
8
9
Pros Cons
Tumor infiltrating lymphocytes (TILs)
• Polyclonal repertoire enables targeting multiple antigens and potentially minimizes tumor escape • Likely enriched for T cell
subsets that already show anti-tumor activity
• Long manufacturing process (8-12 weeks)
• Difficult to isolate (requires tumor biopsy and presence of TILs)
Engineered T Cell Receptors (TCRs)
• Target both extracellular and intracellular antigens presented on MHC • Can signal through TCR
with as little as 1 MHC-peptide complex present on target cells
• Pre-defined antigen specificity
• Limited to specific HLA haplotype
• Tumor cells can escape by MHC downregulation • Relies on co-stimulation
from target cells • Potential formation of
mispaired TCRs with unintended specificities Engineered Chimeric Antigen
Receptors (CARs)
• Bypasses MHC restriction and co-stimulation
• High affinity
• Other non-protein antigens, such as glycoproteins and glycolipids, can be targeted • Pre-defined antigen
specificity
• Only extracellular antigens can be targeted
• Requires sufficient number of antigens to initiate T cell activation
10
CHAPTER 2: CD30.CAR-Ts TARGET EMBRYONAL CARCINOMA1
2.1 Introduction
Testicular germ cell tumors (TGCTs), sub-categorized as seminomas and non-seminomas (NS-TGCTs), are the most common malignancies in male adolescents and young adults (100), and incidence continues to rise in the United States and worldwide (101). Pure embryonal carcinomas (EC), a subtype of NS-TGCTs derived from malignant embryonic stem cells, accounts for 2% of all TGCTs (102). More commonly, EC is a histologic component in 85% of mixed TGCTs in which multiple subtypes are present (102), and the presence of EC is associated with poor outcomes (103). While orchiectomy is curative in patients with localized (i.e. stage 1) NS-TGCTs (104), patients with metastatic disease and those presenting with primary mediastinal tumors, even when cured, often develop long-term chemotherapy-related side effects that reduce their life expectancy (105). In addition, patients who relapse after chemotherapy have poor prognosis, with an overall survival rate of only 30-40% (106). Therefore, immunotherapy may be beneficial in improving overall survival while reducing chemotherapy-associated morbidities.
CD30 antigen expression is a distinctive feature of ECs and an attractive target for
immunotherapy (107). CD30 is a TNF superfamily member with a pro-survival role in transformed stem cells (87). Furthermore, CD30 is stably expressed by ECs at diagnosis and at relapse, and the persistence of CD30+ tumor cells post-chemotherapy is considered a negative prognostic factor (108). Targeting
CD30 by brentuximab, a toxin-conjugated anti-CD30 monoclonal antibody (mAb), has led to partial responses in 2 out of 3 TGCT patients in a phase 2 open-label multicenter study (109). In a separate
1 Lee Kyung Hong, Yuhui Chen, Christof Chiu Smith, Stephanie Montgomery, Benjamin Vincent, Gianpietro Dotti,
11
study, 22% of patients with mixed TGCTs treated with brentuximab achieved objective but transient clinical responses (110).
Chimeric antigen receptor (CAR)-based technology overcomes some of the limitations of mAb-based immunotherapy because CARs combine the antigen specificity of a mAb with intrinsic properties of T lymphocytes (111). CARs are chimeric proteins in which an Ab single-chain variable fragment (scFv), as an extracellular receptor, is fused with T cell effector and co-stimulatory intracellular domains (112). In sharp contrast to mAbs, CAR-expressing T lymphocytes (CAR-Ts) can persist long-term, migrate to the tumor site following chemokine gradients such as CXCL12 in TGCTs (103), and exploit multiple lytic functions (113). CD30-redirected CAR T cells (CD30.CAR-Ts) have shown anti-tumor activity in vitro and in vivo in preclinical lymphoma models (97;114), and more recently in patients with Hodgkin’s lymphomas and CD30+ non-Hodgkin’s lymphomas (98;99). However, CD30.CAR-Ts have
not yet been explored in solid tumors. Here, we demonstrated the anti-tumor activity of CD30.CAR-Ts against CD30+ ECs and discovered a mechanistic link between the lytic activity of CD30.CAR-Ts against
bystander CD30– ECs and the Fas/FasL pathway. Furthermore, we showed that inducing Fas expression
in otherwise Fas– EC cells enhanced CD30.CAR-T-mediated tumor elimination. These results support the
12 2.2 Methods
Tumor cell lines. The Hodgkin’s lymphoma-derived cell line HDLM-2 was obtained from the German Collection of Cell Cultures (DMSZ, Braunschweig, Germany). The Burkitt’s lymphoma-derived cell line Raji, the EC-derived cell lines NCCIT, Tera-1, and Tera-2, the neuroblastoma-derived cell line Lan-1, and the leukemia-derived cell line K562 were obtained from American Type Culture Collection (ATCC). K562 cells were transduced with a retroviral vector encoding human CD19 to constitutively express CD19. Similarly, Lan-1 cells were transduced with a retroviral vector encoding human CD30 to constitutively express CD30. For CD95 overexpression in NCCIT cells, the full-length human CD95 was cloned into the retroviral vector PLX encoding the puromycin resistance gene. For CD95 knockdown in Tera-1 cells, we used the previously described CD95 siRNA pSUPER vectors (115). The retroviral vector encoding eGFP-Firefly-Luciferase (eGFP-FFLuc) was used to label either tumor cells or CD30.CAR-Ts for in vivo studies (56). Raji, K562, Lan-1 and NCCIT cells were maintained in culture with RPMI 1640 medium (Gibco) supplemented with 10% fetal bovine serum (Corning), 1X penicillin-streptavidin (Invitrogen), and 2 mM GlutaMax (Invitrogen). Tera-1 and Tera-2 cells were maintained with McCoy’s 5A media (Corning) with 15% FBS, 1X penicillin-streptavidin, and 2 mM GlutaMax. Cells were maintained in culture in a humidified atmosphere containing 5% CO2 at 37°C. Tumor cell lines were
routinely tested to exclude contamination with mycoplasma and assessed for the expression of CD30 by flow cytometry to confirm identity.
Retroviral constructs and transduction of T lymphocytes. We constructed two second-generation CD30.CARs encoding either the CD28 (CD30.28) or 4-1BB (CD30.BB) endodomains coupled with the CD3ζ endodomain (Fig. S1A) using the previously reported CD30-specific single-chain variable fragment (scFv) (97). Non-transduced T cells from matched donors or T cells transduced with a CD19.CAR encoding the CD28 endodomain (63) were used as controls for in vitro and in vivo
13
donors (Gulf Coast Regional Blood Center, Houston, TX) were transduced to express the CD30.CARs or CD19.CAR and maintained in culture as previously described (116).
Flow cytometry. The following mAbs conjugated with phycoerythrin (PE), fluorescein isothiocyanate (FITC), allophycocyanin (APC), APC-H7, Alexa Fluor 647 (AF 647), Alexa Fluor 700, Brilliant Violet (BV) 711, and/or peridinin chlorophyll protein (Per-CP) were used: CD3, CD4, CD8, CD30 (Clone Ber-H3), CD33, CD45, CD45RA, CD45RO, CD95, CCR7, Ganglioside GD2 (GD2) and active caspase 3 (BD Biosciences). Rabbit anti-cleaved caspase 7 and Alexa Fluor 488-conjugated goat anti-rabbit IgG mAbs were purchased from Cell Signaling Technologies. CAR expression by T cells was detected using a goat anti-mouse F(ab’)2 antibody (Jackson Immuno). To detect CD19.CAR we used a specific anti-idiotype antibody (Clone 233-4A) generated by immunizing mice with the anti-CD19 scFv followed by APC-conjugated rat anti-mouse IgG secondary mAb (BD Biosciences). For absolute number calculations, samples were analyzed using CountBright absolute counting beads per manufacturer’s instructions (Thermo Fisher). For intracellular staining, cells were stained with surface antibodies, then washed and fixed with Cytofix/Cytoperm (BD), followed by intracellular staining in 1X permeabilization buffer per manufacturer’s instructions. Samples were analyzed using a FACSCanto II flow cytometer (BD), and data were analyzed by FlowJo (Treestar). At least 10,000 positive events were collected for each sample. FACS sorting was also performed using CD30-PE or CD95-PE labeled tumor cells on an Aria III flow cytometer (BD; UNC Flow Cytometry Core Facility).
14
Corresponding band-pass filter sets were: blue 450-50 bp/450 LP, 610-20 bp/690 LP (LSRII/Fortessa) and 450-50 bp/502 LP (Aria III).
Cytotoxicity assay. The cytotoxic activity of transduced effector cells was evaluated using a 6-hour 51Cr release assay as previously described (16). Labeled target cells were: Raji (CD30–), HDLM-2
(CD30+), Tera-2, and NCCIT.
In vitro co-culture. Adherent tumor cell lines were plated at 0.1 - 0.25 × 10⁶ cells/mL in a
24-well tissue culture plate one day prior to the addition of CD30.CAR-Ts or CD19.CAR-Ts at various effector/target (E:T) ratios. After five days in culture at 37°C, cells were collected using Versene (UNC Tissue Culture Facility) for non-enzymatic dissociation of tumor cells, washed in PBS, labeled with fluorescent CD3-APCH7 and CD30-FITC mAbs and analyzed by flow cytometry. In experiments with Lan-1/WT or Lan-1/CD30 control tumor cells, remaining cells were labeled with CD3-APCH7 and GD2-PE (Clone 14.G2a) mAbs. In experiments where CD19.CAR-Ts and K562 cells were used, remaining cells were also labeled with CD33-APC mAb. Transwell assays were performed using 0.4 μm transwells (EMD Millipore) in 24-well tissue culture plates.
Carboxyfluorescein succinimidyl ester (CFSE)-based proliferation assay. CD30.CAR-Ts and control T cells were labeled with CFSE following manufacturer's instructions (Invitrogen) and
co-cultured with tumor cells at 5:1 E:T ratio. On day 5, cells were collected, labeled with CD3-APCH7, CD4-PECy7, and CD8-APC mAbs (BD Biosciences), and analyzed for CFSE dilution by flow cytometry. In separate co-culture experiments, tumor cells were labeled with CFSE and plated one day prior to the addition of control T cells and CD30.CAR-Ts. Five days later cells were collected and CFSE+ tumor cells
were identified by flow cytometry.
15
Reverse transcription quantitative polymerase chain reaction. Cells were lysed and RNA was extracted using the RNeasy Mini kit (Qiagen) and reverse transcribed into cDNA (Superscript VILO, Invitrogen). Human ABCG2, SOX2, and CD95L (FasL) mRNA expression was quantified using Taqman probes (Applied Biosystems) on a Quantstudio 6 PCR machine (Applied Biosystems) using β-actin as housekeeping gene control (Invitrogen).
Xenograft mouse models. To measure in vivo the growth of EC cells, we used two orthotopic models in 6–12 week-old NOD/SCID/γcnull (NSG) male mice. In the first model, Tera-2 eGFP-FFLuc cells were re-suspended in DPBS (Corning) and injected directly into the left testis (2 × 10⁶ cells/mice)
(117). In the second model, Tera-2 eGFP-FFLuc cells were re-suspended in Matrigel (Corning) and engrafted under the left kidney capsule (0.25 × 10⁶ cells/mice) (118). To assess anti-tumor activity of
CD30.CAR-Ts, mice received T cells (1 × 10⁷ cells/mouse) intravenously via tail vein injection 14 days
later, when the bioluminescence emission (BLI) of the tumor was consistently measurable. To monitor T cell localization and expansion, mice were engrafted with wild type (WT) Tera-2 cells, and infused 21 days later with 1 × 10⁷ control or CD30.CAR-Ts transduced with eGFP-FFLuc. The IVIS imaging system
(Xenogen; UNC Biomedical Imaging Research Center) was used to monitor tumor growth or T cell expansion and localization. Briefly, a constant region of interest was drawn over the tumor regions and the intensity of the signal measured as total flux (photon/sec) as previously described (118).
Mouse tissue processing and immunohistochemistry (IHC). T cell-treated mice with tumor engrafted in kidney or testis were sacrificed and tumors were fixed in 10% neutral buffered formalin (Fisher Scientific), processed in 3 μm longitudinal planes, and stained for hematoxylin/eosin (H&E) and anti-human CD3 mAb (UNC Lineberger Animal Histopathology Core Facility). Blood samples
16
cumulative score of the frequency of positive cells x score calculated by a membrane staining algorithm, which scores cells based on membrane staining intensity, while the frequency of CD30+ cells is the
percent total positive staining cells (UNC Translational Pathology Laboratory). Tumors collected from tumor bearing mice were counted by a board-certified veterinary pathologist (S. Montgomery) blinded to experimental conditions. A random tumor field containing at least 80% tumor and positively labeled CD3 cells was selected and, depending on tumor size, up to ten high power (400X) fields of view were
examined using a grid matrix approach as previously described (118). Two samples from mice treated with either CD30.28-Ts or CD30.BB-Ts had sheets of positive cells that were too numerous to count (TNTC) and were not included in the quantitative analysis.
RNA-Seq. Briefly, total RNA was extracted from EC cell lines and mRNA libraries were prepared (TruSeq Stranded mRNA Library Prep, Illumina) and sequenced on the Illumina HiSeq4000 platform (UNC High-Throughput Sequencing Facility) using paired-end 100-bp reads, with 84 million reads on average (range 49–139 million). RNA-seq data was aligned with STAR alignment (v2.4.2) and quantified with Salmon (v0.6.0). Differential gene expression analysis was performed using the R DESEq2 package (https://genomebiology.biomedcentral.com/articles/10.1186/s13059-014-0550-8). Among all significantly expressed genes between NCCIT, TERA1, and TERA2 cell lines (FDR p-value < =0.05), expression was further filtered to genes contained within the KEGG Apoptosis and the Biocarta p53 pathway signatures (https://www.ncbi.nlm.nih.gov/pubmed/10592173;
https://doi.org/10.1089/152791601750294344).
17
Statistical significance for differences in tumor growth in vivo were evaluated by one-way ANOVA. Differences in survival curves for mouse experiments were compared by log-rank (Mantel-Cox) test.
18 2.3 Results
EC cell lines and TGCT tissue specimens express CD30. We assessed the expression of CD30 in three human EC cell lines (Tera-1, Tera-2, and NCCIT) by flow cytometry, and used wild type Lan-1 (Lan-1/WT) and CD30+ Lan-1 (Lan-1/CD30) cells as negative and positive controls, respectively. The
HDLM-2 Hodgkin’s lymphoma cell line that constitutively expresses CD30 (119) was also used as a positive control. All EC cell lines expressed CD30 but also contained a fraction of CD30–/dim cells, which
were more prominent in the Tera-1 cell line (Fig.2.1A). We next examined CD30 expression by
immunohistochemistry (IHC) in human tissue microarrays (TMA) that include normal testes, seminomas, and NS-TGCTs. Normal testes and seminomas did not display CD30 staining (Fig.2.1B). In contrast, up to 70% of EC specimens exhibited a moderate to strong, granular, membranous and Golgi CD30 staining pattern (Fig.2.1B). When the pattern of CD30 expression was scored using computational analysis and analyzed as H score (Fig.2.1C) or as frequency of positive cells (Fig.2.1D), CD30 was routinely expressed only by primary ECs (p<0.001, one-way ANOVA), although with some heterogeneity.
CD30.CAR-Ts target CD30+ EC cell lines and their side population (SP) cells. We
engineered T cells to express either CD30.28 or CD30.BB CARs (Fig.2.S1A). Transduction efficiency was consistently >90% for both constructs (Fig.2.S1B), and CD30.CAR-Ts expanded in vitro in the presence of cytokines (Fig.2.S1C). CD30.CAR-Ts showed phenotypic characteristics of stem cell-like, effector-memory and central-memory T cells (Fig.2.S1D).
CD30.CAR-Ts lysed CD30+ tumor cells at higher frequencies compared to control T cells
(Ctr.Ts), while sparing CD30– tumor cells in short-term 51Cr release assays (Fig.2.2A). CD30.CAR-Ts
also effectively eliminated CD30+ tumor cells in long-term co-culture experiments. Specifically, using
effector:target (E:T) ratios ranging from 1:5 to 5:1, both CD30.28-Ts and CD30.BB-Ts exhibited anti-tumor activity against all three EC cell lines tested (Fig.2.2B-D and 2.S2B-D). Of note, while
19
ratio (Fig.2.2D). CD30.CAR-Ts targeted Lan-1/CD30 cells while neither Ctr.Ts nor CD30.CAR-Ts eliminated Lan-1/WT cells (Fig.2.S2A). Both CD30.28-Ts and CD30.BB-Ts showed robust proliferation in response to EC cells, as assessed by CFSE dilution assays (Fig.2.S3A), confirming both endodomains provided adequate co-stimulation. Additionally, CD30.CAR-Ts secreted IFNγ and IL-2 upon stimulation with EC cells (Fig.2.S3B,C). In summary, CD30.CAR-Ts showed selective activation by CD30+ EC cells
and anti-tumor activity in vitro.
Cancer stem cells are a subpopulation of tumor cells with stem cell characteristics that can contribute to tumor relapse (120). Taking in consideration the germinal origin of ECs, we examined if EC cell lines contain putative cancer stem cells using the Hoechst 33342 staining for detection of SP cells (121). While all EC lines had a proportion of SPcells, Tera-1 cells showed the highest frequency of SP cells (15-30%) (Fig.2.3A). SPcells retained the expression of CD30 (Fig.2.3A) and exhibited cancer stem cell characteristics based on the expression of the stem cell-associated markers ABCG2 (122) and SOX2 (123) (Fig.2.3B), and their capacity to differentiate to non-SP cells (121) (Fig.2.3C). Importantly, CD30.CAR-Ts targeted sorted SP cells in co-culture assays (Fig.2.3D). Therefore, CD30.CAR-Ts can target both differentiated and stem cell-like CD30+ EC cells.
CD30.CAR-Ts localize to EC tumors and exhibit anti-tumor activity in vivo. To model EC in
20
(i.v.) consistently localized and accumulated at the tumor site. While CD30.BB-Ts showed increased accumulation early after injection, CD30.28-Ts showed better long-term persistence compared to that of controls (Ctr.Ts) or CD30.BB-Ts (Fig.2.4C and 2.S4A). T cells were detectable in the blood (Fig.2.S4B) and spleen (Fig.2.S4C) in all treatment groups between day 30–45 post T cell infusion. In tumor
specimens collected between day 30–45 post T cell infusion, we observed infiltrating CD3+ T cells that
occasionally formed small clusters (Fig.2.S4D). However, no significant differences in CD3+ T cell
infiltration between Ctr-T and CD30.CAR-T treated groups were observed (Fig.2.4D).
To test CD30.CAR-T anti-tumor activity, luciferase-labeled EC cells were engrafted in the kidney and tumor growth measured by BLI. When tumors in the kidney showed consistent increase in BLI, mice received i.v. unlabeled Ctr.Ts or CD30.CAR-Ts. Both CD30.28-Ts and CD30.BB-Ts reduced the tumor growth compared to Ctr.Ts (Fig.2.4E and 2.S4E), but CD30.28-Ts provided better survival when using tumor BLI of 5 x 10⁷ p/s as a survival cutoff (Fig.2.4F).
CD30– EC cells are eliminated by CD30.CAR-Ts via antigen-independent, but cell-cell
contact-dependent mechanisms. While not displaying lytic activity against CD30– tumor cells alone in
short-term (Fig.2.2A) or long-term (Fig.2.S2A) assays, CD30.CAR-Ts completely eliminated Tera-1 cells, which contain a mixture of CD30+ and CD30– cells (Fig.2.1A), in 5-day co-culture assays
(Fig.2.2B). To dissect this phenomenon, we co-cultured CD30.CAR-Ts with CD30– flow-sorted Tera-1
cells (Fig.2.5A) and found that they were no longer eliminated (Fig.2.5B), with no detectable IFNγ or IL-2 released in culture supernatants (Fig.2.S5B). In addition, when unselected Tera-1 cells were co-cultured with CD30.CAR-Ts at very low E:T ratios, CD30+ Tera-1 cells were preferentially eliminated over the
CD30– fraction (Fig.2.5C). Similar results were observed with CD30.BB-Ts (Fig.2.S5). We found no
evidence of CD30 upregulation in CD30– Tera-1 cells when these cells were exposed to soluble factors
21
CD19.CAR-Ts, which target the CD19 antigen that is not expressed by EC cells, in the presence of CD19– (K562/WT) or CD19+ (K562/CD19+) target cells to induce CAR-T activation. As shown in
Fig.2.5D, CD19.CAR-Ts eliminated Tera-1 cells only in the presence of K562/CD19+ cells. Furthermore,
the elimination of Tera-1 cells was T cell-tumor cell contact-dependent since the anti-tumor effects were abolished when CD19.CAR-Ts and K562/CD19+ cells were separated from Tera-1 cells using a transwell
(Fig.2.5E). These data suggest that CD30.CAR-Ts, upon activation through the CAR, can eliminate the fraction of Tera-1 cells that is CD30– cells in a cell-cell contact dependent, but antigen-independent
mechanism.
Fas/FasL pathway mediates the elimination of CD30– EC cells and improves the elimination
of CD30+ EC cells by CD30.CAR-Ts. Fas-FasL (CD95/CD95L) interactions between tumor cells and cytotoxic T lymphocytes contribute to tumor cell death (125). CAR-Ts also upregulate FasL upon receptor engagement (126;127), and Tera-1 cells express Fas (Fig.2.6A). Since the CD30– fraction of
Tera-1 cells also retains Fas expression (Fig.2.6B), we investigated whether CD30.CAR-Ts utilize the Fas/FasL pathway to eliminate the CD30– fraction of Tera-1 cells. CD30.28-Ts upregulated FasL upon
CAR engagement with EC cells after 4 hours in vitro (Fig.2.6C). In contrast, EC cell lines neither expressed FasL mRNA nor secreted FasL in culture supernatants (data not shown). When co-cultured with CD30.28-Ts, the CD30– fraction of Tera-1 cells showed caspase 3 activity (Fig.2.6D), which is
primarily triggered by the Fas/FasL pathway (125). By contrast, cell death of the CD30+ fraction was
primarily caused by granzyme B/perforin-mediated membrane damage as detected by cleaved caspase 7 (128;129) (Fig.2.6E). When CD95 was knocked down in Tera-1 cells via specific siRNA (115) (Tera-1/CD95 KO, Fig.2.6F), we found reduced caspase 3 activity among CD30– Tera-1 cells compared to
wildtype Tera-1 cells when co-cultured with CD30.28-Ts (Fig.2.6G). Similar Fas/FasL-mediated effects were observed when the experiments were repeated using CD30.BB-Ts (Fig.2.S6).
22
Tera-2 cells that express CD95 (Fig.2.6A) were similarly targeted via antigen-independent Fas/FasL killing by CD19.CAR-Ts (Fig.2.S7A), but not NCCIT cells (Fig.2.S7B) that lack CD95 expression (Fig.2.6A). Interestingly NCCIT cells appeared constitutively more resistant to CD30.CAR-T mediated killing (Fig.2.2D and 2.S7C) and showed significantly decreased expression of apoptosis-related genes by RNA-Seq (notably p53, Fas, and TRAIL receptor) compared to either Tera-1 or Tera-2, which showed greater co-clustering of apoptosis-related gene expression patterns (Fig.2.S7D and Supplemental Table). However, when engineered to express CD95 (NCCIT/CD95+, Fig.2.6H), NCCIT cells were more
23 2.4 Discussion
Investigation of novel drugs for the treatment of ECs and TGCTs in general did not significantly progress in the past few decades, and the outcome of patients treated with new drugs remains poor with an overall survival rate of 30–40% (106). As previously identified in Hodgkin’s lymphoma (97;98), CD30 expression by ECs can be exploited to develop targeted therapies in these malignancies. CD30 is found on ECs at diagnosis and its expression is retained in a significant number of patients who
progressed after multiple chemotherapy regimens (108). Promising results have been reported using brentuximab vedotin in relapsed TGCT patients enrolled in clinical studies (110;130) and clinical outcome will likely be further improved in combination with other agents.
Here we propose CD30.CAR-Ts as a valuable approach to enhance the therapeutic index of CD30-targeted therapies in ECs. We recently reported that autologous CD30.CAR-Ts were safe in patients with relapsed CD30+ lymphomas, with promising anti-tumor activity documented even in the
absence of a conditioning regimen before infusing CD30.CAR-Ts (98). In our preclinical study using CD30+ ECs, we show that CD30.CAR-Ts can selectively target human EC cell lines, localize at the tumor
site in vivo and control tumor growth.
The presence of the EC subtype among NS-TGCTs correlates with higher rates of relapse after chemotherapy (103), which may be driven, at least in part, by the intrinsic stem cell properties of ECs (131). Cancer stem cells, which differentiate into multiple tumor cell types, are indeed often resistant to chemotherapy and act as a reservoir of tumor cells that ultimately leads to recurrence (132). Herszfeld et al. specifically linked CD30 expression to enhanced tumorigenic features among transformed
hematopoietic stem cells (87). Because CD30 expression is retained by putative EC stem cells identified as SP cells (121), targeting this molecule with CAR-Ts may prove significantly advantageous to
ultimately overcome the drug resistance of these tumor cells. Therefore, CD30.CAR-Ts may potentially reduce the chance of relapse by eliminating the reservoir of stem cell-like ECs, in addition to
24
Another common cause of tumor escape and relapse after targeted immunotherapy is the heterogeneous expression of target antigens within the tumor. For example, some leukemia patients showed emergence of CD19– leukemic cells after adoptive transfer of CD19-specific CAR-Ts due to
selection of alternatively spliced CD19 isoforms (133). Similarly, tumor escape due to antigen loss has been observed in patients with glioblastoma treated with EGFRvIII-specific CAR-Ts (134). Bi-specific CAR-Ts which target two antigens simultaneously (135;136) can reduce tumor escape, but my also increase the risk of toxicities in normal tissues due to on-target off-tumor effects, especially in solid tumors, which frequently share antigens with normal tissues. Here we show that the observed Fas-FasL interaction between ECs and CD30.CAR-Ts may represent a novel way to overcome tumor escape associated with antigen heterogeneity. Specifically, we observed that CD30.CAR-Ts can target CD30– EC
cells in a contact-dependent manner via Fas/FasL interaction. While eradicating CD30+ EC cells via
perforin/granzyme B-mediated mechanisms, CD30.CAR-Ts also upregulate FasL and eliminate surrounding CD30– tumor cells, if they express the CD95 molecule, via caspase 3 activation.
The Fas/FasL pathway is highly relevant in tumor immunology (137;138), and Fas agonist mAbs have been developed to activate the apoptotic cascade in tumor cells (139). However, this strategy was not clinically developed due to the systemic toxicities caused by the nonselective targeting of CD95 expressing cells in normal tissues, such as hepatocytes (140;141). In this regard, the FasL mechanism exploited by CAR-Ts, which is cell-cell contact dependent, is more regulated than systemic Fas targeting by mAbs, since upregulation of FasL by CAR-Ts only occurs at the tumor site after antigen-specific engagement. Nevertheless, while our data indicate that the Fas/FasL pathway is critical for CD30.CAR-Ts to eliminate surrounding antigen-negative tumor cells, tumor cells can downregulate Fas (137;142;143) or develop non-functional Fas mutations as in EC (144) to escape immune cell targeting. The EC cell line NCCIT is a typical example of Fas– tumor cell line, and we observed that this cell line is indeed more
25
Fas/FasL pathway in adoptive T cell immunotherapy and specifically in CAR-T-based therapies. We have previously reported that oncolytic viruses that specifically infect and replicate within tumor cells can be armed to attract CAR-Ts at the tumor site and sustain their proliferation by releasing RANTES and IL-15, respectively (145). In light of our novel results, we can speculate that oncolytic viruses further engineered to cause high expression of functional Fas selectively in tumor cells will be valuable when combined with CAR-T therapy to promote both antigen-dependent CAR-mediated and antigen-independent Fas/FasL mediated elimination of tumor cells.
Although effective in targeting CD30+, CD30– EC cells and EC stem-like EC cells in vitro,
CD30.CAR-Ts did not completely eradicate EC tumors in vivo in our aggressive EC model in which the tumor is engrafted within the kidney. CD30.CAR-Ts upon i.v. inoculation localized at the tumor and showed some level of expansion within the tumor. However, the observed localization, expansion and persistence of CD30.CAR-Ts in our model remained suboptimal to fully eradicate the tumor. Several strategies have been proposed to further enhance CAR-T migration, infiltration and persistence within the tumor, such as engineering CAR-Ts to express heparanase to degrade tumor extracellular matrix (118) or constitutive expression of cytokines (146;147). In addition, combination with other agents may also improve the anti-tumor activity of CAR-Ts. For instance, PD-L1 is highly expressed in some EC tumors (148). While PD1/PD-L1 blockades as single agents may not be effective in TGCTs due to its low mutation rates (149), these inhibitors may prevent the exhaustion of CD30.CAR-Ts that express PD1 upon activation (150).
In summary, we found that CD30.CAR-Ts represent a clinically applicable strategy in patients with ECs. We have demonstrated that CD30.CAR-Ts are effective against ECs targeting both
differentiated and stem cell-like EC cells. We also highlighted the relevance of the Fas/FasL pathway in CAR-T function and how this pathway can be exploited to counter tumor escape due to the
26
that still have dismal outcomes (151), CD30.CAR-Ts represent a novel and promising treatment for other CD30+ non-lymphomatous malignancies.
2.5 Authorship Contributions
27 2.6 Figures
28
(MFI) are indicated. (B) Representative IHC for CD30 expression with nuclear counterstain in human tissue microarray (TMA) including normal testes, seminoma (stage I T1N0M0), and ECs (stage I
29
Figure 2.2: CD30.CAR-Ts exhibit cytotoxic activity against EC cell lines in vitro. (A) 51Cr release
assay of control T cells (Ctr.T), CD30.28-Ts and CD30.BB-Ts against tumor cell lines indicated (mean ± SEM, n = 4 donors). ns=not significant, *=p<0.05, **=p<0.01, ***=p<0.001, repeated measures one-way ANOVA comparing individual effector:target (E:T) ratios. (B-D) Ctr.T or CD30.CAR-Ts were co-cultured with the EC cell line Tera-1 (B), Tera-2 (C) or NCCIT (D). By day 5 remaining EC cells
(CD30+) and T cells (CD3+) were collected and analyzed by flow cytometry. Representative flow plots at
1:1 (B,C) or 5:1 (D) E:T ratios (left panels) and cumulative data for remaining frequency of CD30+ cells
30
Figure 2.3: EC-derived SP cells are targeted by CD30.CAR-Ts. (A) Flow cytometry plots of Hoechst 33342-stained tumor cell lines in which percentages of SP and non-SP cells are shown for each tumor cell line (upper panels). Histograms of CD30 expression and MFI on pre-gated SP and non-SP cells are shown (lower panels). Raji cells were used as CD30– control cells. (B) Tera-1 SP and non-SP cells were
31
line and cultured in vitro for 6 weeks. SP-sorted cells regenerated both SP and non-SP cells. (D) Ctr.T or CD30.CAR-Ts were co-cultured with SP-sorted Tera-1 cells at a 1:1 E:T ratio for 5 days, followed by flow cytometry analysis to detect remaining CD3+ T cells and CD30+ tumor cells. Flow cytometry plots
32
Figure 2.4: CD30.CAR-Ts localize to EC tumors and exhibit anti-tumor activity in vivo. (A)
33
eGFP-FFLuc into the left testis. (B) Representative hematoxylin/eosin (H&E) and human CD30 IHC staining of EC tumors growing in the testis are shown at 4X magnification, scale bar=250 μm. (C) NSG mice were inoculated with Tera-2 cells under the left kidney capsule and, 21 days later, infused i.v. with 1 × 10⁷ eGFP-FFLuc-labeled CD30.CAR-Ts or CD19.CAR-Ts (Ctr.T). Representative IVIS images
indicating CAR-T localization and expansion (left panel) and cumulative BLI (right panel) are shown (mean ± SEM, n=3–4 per group, 2 independent experiments). **=p<0.001, one-way ANOVA at day 12. (D) T cell-treated mice were sacrificed at day 30–45 post tumor inoculation and tumors were stained with anti-human CD3 mAb to detect tumor-infiltrating T lymphocytes. CD3+ T cells were counted at 400x
magnification with the tumor covering at least 80% of the field of view in a blinded fashion. Cumulative quantification of CD3+ T cell counts are shown (mean ± SEM, n=1–3 per group, 4 independent
experiments). ns=not significant, one-way ANOVA. (E) NSG mice were inoculated with Tera-2 cells labeled with eGFP-FFLuc under the left kidney capsule and received 1 × 10⁷ CD30.CAR-Ts or
CD19.CAR-Ts (Ctr.T) i.v. by day 15. Representative IVIS images indicating tumor growth (left panel) and cumulative BLI (right panel) are illustrated (mean ± SEM, n = 4–5 per group, 2 independent
34
Figure 2.5: CD30.CAR-Ts eliminate Tera-1 CD30– cells in a cell contact-dependent but
antigen-independent manner. (A) Tera-1 cells were FACS-sorted to obtain CD30+ and CD30– cells. Histogram
shows CD30 expression on sorted cells. (B) Sorted Tera-1 CD30+ and CD30– cells were labeled with
CFSE and co-cultured with either Ctr.Ts or CD30.28-Ts for 5 days. Cells were then collected and evaluated by flow cytometry to quantify T cells (CD3+) and tumor cells (CFSE+). Representative flow
35
SEM, n = 4 donors) are shown. ns = not significant, **=p<0.01, two-sided, paired Student’s T test. (C) Tera-1 cells were labeled with CFSE and co-cultured for 5 days with CD30.28-Ts at decreasing E:T ratios ranging from 1:1 to 1:15. Representative plots (left columns) and CD30 histograms (right columns) of CFSE+ Tera-1 cells with cumulative data (right graph) for remaining tumor cells calculated with flow
cytometry-based counting beads are shown (mean ± SEM, n = 5 donors). *=p<0.05, **=p<0.01, two-sided, paired Student’s T test. (D) Tera-1 cells were co-cultured with CD19.CAR-Ts in the presence of either K562/WT or K562/CD19+ cells at 1:1:1 ratio for 5 days. Cells were then collected and evaluated by
flow cytometry to quantify T cells (CD3+) and tumor cells (CD30+). Shown are representative flow
cytometry plots of CD3+ T cells and CD30+ EC cells pre-gated to exclude CD33+ K562 cells (left panels)
and cumulative data summarizing tumor cell numbers (right panels). Dashed line represents the initial Tera-1 cell number (mean ± SEM, n=5 donors). *=p<0.05, two-sided, paired Student’s T test. (E) Tera-1 cells were plated in the lower chamber of a 0.4μm transwell-plate 24 hours prior to plating CD19.CAR-Ts and either K562/WT or K562/CD19+ cells in the upper chamber at 1:1:1 ratio for 5 days. Tera-1 cells in
36
Figure 2.6: Functional Fas-FasL interaction is critical for the elimination of CD30– EC cells and
37
expression and MFI in EC cell lines. T cells stimulated with anti-CD3/CD28 mAbs were used as positive control for CD95 expression. (B) CD95 expression on pre-gated CD30+ or CD30– Tera-1 cells. (C)
RT-qPCR cumulative data for FasL mRNA expression among Ctr.T or CD30.28-Ts cultured alone or with EC cells at a 5:1 E:T ratio for 4 hours at 37°C (mean ± SEM, n = 6 donors). FasL mRNA expression was normalized to β-actin mRNA. ns = not significant, ***=p<0.0001, two-sided paired Student’s T test. (D-E) Active caspase 3 and cleaved caspase 7 were assessed by flow cytometry in Tera-1 cells co-cultured with Ctr.T or CD30.28-Ts at 1:2 or 1:5 E:T ratio for 18 hours, respectively. Representative flow plots (left panels) and cumulative data (right panels) of active caspase 3 frequency (D) or cleaved caspase 7 MFI (E) among Tera-1 CD30– and CD30+ cells, respectively are shown (mean ± SEM, n = 5 donors). *=p<0.05,
**=p<0.01, two-sided, paired Student’s T test. (F) CD95 expression on pre-gated CD30– cells for
Tera-1/WT or Tera-1 cells transduced with CD95 shRNA and FACS-sorted based on CD95– expression
(1/CD95 KO) is shown. CD95 frequency and MFI for (1/CD95 KO cells are indicated. (G) Tera-1/WT or Tera-1/CD95 KO cells were co-cultured with Ctr.Ts or CD30.28-Ts at 1:5 E:T ratio for 18 hours. Representative flow plots (left panels) and cumulative data (right panels) for active caspase 3 among Tera-1 CD30– cells are shown (mean ± SEM, n = 4 donors). ns = not significant, ***=p<0.001,
two-sided, paired Student’s T test. (H) CD95 expression on NCCIT/WT cells and NCCIT cells transduced to express CD95 (NCCIT/CD95+). CD95 frequency and MFI for NCCIT/CD95+cells are
indicated. (I) NCCIT/WT or NCCIT/CD95+ cells were co-cultured with Ctr.Ts or CD30.28-Ts at 1:2 E:T
38
Figure 2.S1: CD30.CAR-T characteristics. (A) Schematic of CD30.CARs encoding either the CD28 (CD30.28-T) or the 4-1BB (CD30.BB-T) endodomains. The anti-CD30 scFv domain (aCD30 scFv) was cloned in frame with CD8α hinge and transmembrane domain (TM) and either CD28 or 4-1BB
endodomains with CD3z. (B) CAR transduction efficiency was detected by flow cytometry using an anti-mouse Alexa Fluor 647-conjugated F(ab’)2 antibody. Representative histograms (top panels) and
39
(mean ± SEM, n=5 donors). *=p<0.05, repeated-measures ANOVA. (D) CAR-T immunophenotype by day 7 post-transduction. Representative plots pre-gated on CD3+ T cells (top panels) and cumulative data
for CCR7+CD45RA+ stem cell-like memory T cells (top graph) (23) and CD45RA–CD45RO+ central and
40
Figure 2.S2: Co-culture of CD30.CAR-Ts and tumor cells. (A) Representative flow plots (left panels) and cumulative data (right panels) of 5-day co-culture assays of CD30.CAR-Ts with Lan-1/WT (CD30–)
or Lan-1/CD30 (CD30+) tumor cells labeled with anti-GD2 mAb (mean ± SEM, n=4 donors). ns=not
41
42
Figure 2.S3: CD30.CAR-Ts proliferate and secrete pro-inflammatory cytokines in response to EC
cell lines. (A) Representative histograms (left panels) and cumulative data (right panels) of CFSE dilution of CFSE-labeled CD3+ Ctr.Ts, CD30.28-Ts and CD30.4-1BB-Ts after 5 days alone or in co-culture with
tumor cells (mean ± SEM of CFSE MFI, n=5 donors). ns=not significant, *=p<0.05, **=p<0.01,
***=p<0.001, two-sided, paired Student’s T test. (B-C) Cumulative quantification by ELISA of IFNγ (B) and IL-2 (C) released in co-culture supernatant after 24 hours by Ctr.Ts, CD30.28-Ts and CD30.4-1BB-Ts with either CD30+ or CD30- tumor cells at 1:1 E:T ratio (mean ± SEM, n=5 donors). ns= not
43
Figure 2.S4: CD30.CAR-T expansion and anti-tumor activity in vivo. (A) NSG mice were inoculated
with Tera-2 cells under the left kidney capsule and, 21 days later, infused i.v. with 1 × 10⁷
eGFP-FFLuc-labeled CD30.CAR-Ts or CD19.CAR-Ts (Ctr.T). BLI from individual mice are shown (n=3-4 per group, 2 independent experiments). **=p<0.001, one-way ANOVA at day 12. (B-C) T cell-treated mice were sacrificed at day 30-45 post tumor inoculation, and blood samples (B) and spleens (C) were collected to detect human CD45+CD3+ T cells. Blood samples were normalized to 100μL total volume. Cumulative
quantification of %CD45+CD3+ T cells are shown (mean ± SEM; n=1-5 per group, 4 independent
experiments). (D) Tumors were harvested at day 30-45 post tumor inoculation and stained for
44
labeled with eGFP-FFLuc under the left kidney capsule and received 1 × 10⁷ CD30.CAR-Ts or
45
Figure 2.S5: Tera-1 CD30– cells are eliminated by CAR-Ts in a cell contact-dependent but
antigen-independent manner. (A) Sorted Tera-1 CD30+ and CD30– cells were labeled with CFSE and
46
CD30.4-1BB-Ts in the supernatant of co-culture with Tera-1 CD30+ or CD30– cells at 1:1 E:T ratio are
shown (mean ± SEM, n=4 donors). ns= not significant, *=p<0.05, **=p<0.01, ***=p<0.001, two-sided paired Student’s T test. (C) Representative plots (left columns) and CD30 histograms (right columns) of CFSE+ Tera-1 cells co-cultured for 5 days with CD30.BB-Ts at decreasing E:T ratios and cumulative data
47
Figure 2.S6: Functional Fas-FasL interaction is critical for the elimination of CD30– EC cells by
CD30.CAR-Ts. (A) FasL mRNA expression measured by RT-qPCR of CD30.BB-Ts cultured alone or with EC cells at a 5:1 E:T ratio for 4 hours at 37°C. Expression is normalized to housekeeping gene β-actin. n=6 independent experiments; **=p<0.001 by two-sided, paired Student’s T test. (B-C)
Representative flow plots (left panels) of active caspase 3 (B) or cleaved caspase 7 (C) staining pre-gated on Tera-1 CD30– or CD30+ cells after co-culture with Ctr.Ts or CD30.BBTs for 18 hours at 37°C and
cumulative data (right panels) are shown (mean ± SEM, n=5 donors). *=p<0.05, **=p<0.001, two-sided, paired Student’s T test. (D) Tera-1/WT or Tera-1/CD95 KO cells were co-cultured with Ctr.Ts or CD30.BB-Ts at 1:5 E:T ratio for 18 hours. Representative flow plots (left panels) and cumulative data (right panels) for active caspase 3 among Tera-1 CD30– cells are shown (mean ± SEM, n=4 donors).
48
Figure 2.S7: Tera-2 cells are susceptible to antigen-independent killing by CD30.CAR-Ts, while
NCCIT cells are resistant to CD30.CAR-T targeting. (A-B) Tera-2 (A) and NCCIT (B) cells were co-cultured with CD19.CAR-Ts in the presence of either K562/WT or K562/CD19+ cells at 1:1:1 ratio for 5
days, and then analyzed by flow cytometry to detect T cells (CD3+) and CD30+ EC cells after excluding
CD33+ K562 cells. Cell numbers were calculated using flow cytometry-based counting beads.
49
numbers with the dashed lines indicating initial tumor cell numbers are shown (mean ± SEM, n=5
donors). ns=not significant, *=p<0.05, two-sided, paired Student’s T test. (C) 51Cr release assay of control
50 2.7 Tables
51
XIAP|331 0.770535 0.276607 0.41901 0.38724984 Apoptosis BIRC2|329 0.766289 0.208297 0.340916 0.307668139 Apoptosis EXOG|9941 0.724237 0.131974 0.24121 0.226040525 Apoptosis PRKACB|5567 0.710461 0.086467 0.173997 0.165727821 Apoptosis PPP3CA|5530 0.709012 0.123004 0.228765 0.215256376 Apoptosis PIK3R5|23533 0.707977 0.484233 0.624358 0.613869995 Apoptosis BID|637 0.670072 0.129262 0.23739 0.223776637 Apoptosis APAF1|317 0.658307 0.192457 0.321262 0.292317493 Apoptosis AKT1|207 0.654074 0.345873 0.493318 0.460211132 Apoptosis PRKACA|5566 0.640399 0.101728 0.196749 0.190444849 Apoptosis IRAK4|51135 0.633398 0.034364 0.082561 0.070032373 Apoptosis PPP3R1|5534 0.621044 0.021057 0.055439 0.048373518 Apoptosis ATM|472 0.581319 0.003016 0.010653 0.008841803 Apoptosis CAPN2|824 0.530359 0.168805 0.290604 0.269084695 Apoptosis CASP10|843 0.526998 0.010096 0.029869 0.025007758 Apoptosis AIFM1|9131 0.475969 0.004981 0.016386 0.013593319 Apoptosis BIRC3|330 0.416065 0.021559 0.056554 0.048373518 Apoptosis RIPK1|8737 0.398919 0.000319 0.001513 0.001167646 Apoptosis BCL2|596 0.364738 0.001288 0.005128 0.004065303 Apoptosis CHP1|11261 0.347499 1.14E-09 1.56E-08 1.15E-08 Apoptosis PIK3R3|8503 0.336943 0.006932 0.021745 0.017999576 Apoptosis PIK3CA|5290 0.323849 2.39E-07 2.21E-06 1.48E-06 Apoptosis PIK3R2|5296 0.306998 0.001256 0.005016 0.004065303 Apoptosis CASP9|842 0.286904 4.46E-06 3.25E-05 2.48E-05 Apoptosis DFFA|1676 0.247858 1.84E-11 3.10E-10 2.28E-10 Apoptosis IRAK2|3656 0.146757 3.30E-05 0.000199 0.000143559 Apoptosis MYD88|4615 0.133165 1.97E-10 2.96E-09 2.11E-09 Apoptosis CDKN1A|1026 8.847523 1.43E-08 1.66E-07 9.59E-08 p53 CCND1|595 7.818912 1.51E-13 3.19E-12 2.43E-12 p53 MDM2|4193 3.123406 2.75E-09 3.52E-08 2.22E-08 p53 GADD45A|1647 2.848898 0.000169 0.000859 0.000648183 p53 CCNE1|898 1.060314 0.782151 0.85696 0.877994922 p53 RB1|5925 0.957767 0.838439 0.8948 0.9182901 p53 CDK4|1019 0.627865 0.243399 0.382387 0.347747843 p53 PCNA|5111 0.563811 0.029333 0.072814 0.062967477 p53 CDK2|1017 0.484808 0.003511 0.012149 0.009918345 p53 E2F1|1869 0.427421 0.07504 0.155499 0.145558697 p53
52
Name Fold_Change pValue FDR FDR_pValue Pathway
53
PRKACA|5566 0.871280349 0.592732623 0.700628567 0.654049791 Apoptosis CASP8|841 0.858989207 0.406247061 0.53514454 0.501077521 Apoptosis PRKACB|5567 0.836574947 0.324255818 0.452074501 0.421796186 Apoptosis PRKAR1A|5573 0.80816873 0.247267191 0.366744683 0.339931928 Apoptosis CHUK|1147 0.787157479 0.164941721 0.266674437 0.244358105 Apoptosis PPP3CB|5532 0.784398382 0.257719604 0.378223507 0.346513754 Apoptosis PIK3CD|5293 0.781382066 0.456540662 0.582409349 0.530074239 Apoptosis PIK3R2|5296 0.778369745 0.413874247 0.542293105 0.501077521 Apoptosis AKT1|207 0.772623031 0.512768653 0.631871396 0.581865138 Apoptosis RIPK1|8737 0.759618272 0.260286316 0.381221849 0.347048421 Apoptosis PIK3R3|8503 0.741552067 0.157724857 0.257426211 0.238075256 Apoptosis PPP3R1|5534 0.674137699 0.044818057 0.091308429 0.079315613 Apoptosis TNFSF10|8743 0.595871863 0.416520689 0.544577064 0.501077521 Apoptosis PIK3R1|5295 0.588467302 0.011804416 0.029296413 0.024851401 Apoptosis IRAK2|3656 0.549876835 0.101224801 0.180052911 0.163595638 Apoptosis IRAK4|51135 0.544756549 0.001662357 0.005256548 0.004432951 Apoptosis DFFA|1676 0.506572856 0.000402698 0.001473188 0.001201955 Apoptosis XIAP|331 0.4424645 0.0006659 0.002316421 0.001869194 Apoptosis CHP1|11261 0.409030306 2.26E-09 1.97E-08 1.39E-08 Apoptosis AIFM1|9131 0.323699451 2.23E-06 1.24E-05 8.71E-06 Apoptosis PIK3CA|5290 0.31678786 6.53E-08 4.68E-07 3.26E-07 Apoptosis DFFB|1677 0.309244044 1.13E-06 6.69E-06 4.65E-06 Apoptosis CASP10|843 0.18763365 5.21E-11 5.48E-10 4.17E-10 Apoptosis CASP9|842 0.17407903 6.57E-11 6.85E-10 5.00E-10 Apoptosis PIK3R5|23533 0.149417544 0.000101385 0.000422166 0.000337952 Apoptosis CDKN1A|1026 11.77883444 3.35E-13 4.40E-12 3.83E-12 p53 CCND1|595 7.939426569 2.68E-16 4.70E-15 3.57E-15 p53 MDM2|4193 3.044055534 4.40E-09 3.69E-08 2.52E-08 p53 GADD45A|1647 1.834063727 0.002200594 0.006773922 0.00577205 p53 PCNA|5111 1.255117695 0.114926298 0.199813481 0.182061462 p53 RB1|5925 1.182573312 0.41089585 0.539300803 0.501077521 p53 CDK2|1017 1.143256088 0.372636685 0.501122645 0.471782586 p53 CCNE1|898 0.883146498 0.388482809 0.517008684 0.485603511 p53 CDK4|1019 0.677339083 0.338303354 0.467656132 0.436520457 p53 E2F1|1869 0.346079916 0.013166234 0.032194502 0.027358409 p53
54
Name Fold_Change pValue FDR FDR_pValue Pathway
55
TNFRSF10B|8795 0.928498048 0.722229128 0.807584899 0.845447955 Apoptosis IRAK4|51135 0.850964937 0.407953414 0.542393434 0.576507065 Apoptosis AKT2|208 0.811729236 0.442267579 0.57384549 0.594253966 Apoptosis TP53|7157 0.781983264 0.317621325 0.451899412 0.488133505 Apoptosis TNFSF10|8743 0.781293076 0.702638858 0.794403205 0.838971771 Apoptosis CHUK|1147 0.761538351 0.19503154 0.31242497 0.325052566 Apoptosis CASP3|836 0.72174756 0.217893286 0.340947844 0.35574414 Apoptosis PPP3CB|5532 0.712740614 0.078592894 0.152898592 0.163309909 Apoptosis AIFM1|9131 0.675718708 0.088548547 0.167690744 0.170695994 Apoptosis CYCS|54205 0.668468007 0.083788996 0.160664505 0.165509128 Apoptosis RELA|5970 0.660513234 0.28637487 0.418594833 0.444854167 Apoptosis TNFRSF1A|7132 0.6303822 0.03826975 0.085839801 0.088741449 Apoptosis CASP9|842 0.615013855 0.214045046 0.336346338 0.353063994 Apoptosis PIK3R1|5295 0.614513493 0.041206331 0.091154035 0.092859337 Apoptosis PRKAR1A|5573 0.609609401 0.011095633 0.030716563 0.034650673 Apoptosis XIAP|331 0.56685483 0.005973984 0.018414361 0.021240833 Apoptosis IRAK1|3654 0.463666898 0.009453425 0.026885244 0.030250961 Apoptosis PIK3CD|5293 0.381720587 0.003158346 0.010777138 0.012325253 Apoptosis DFFB|1677 0.379813205 0.000668203 0.002853953 0.003144485 Apoptosis BCL2L1|598 0.363098051 0.001435298 0.005506771 0.006379102 Apoptosis CASP10|843 0.360988629 0.001282598 0.005015545 0.005863306 Apoptosis IL1A|3552 0.327784688 1.17E-06 1.04E-05 1.17E-05 Apoptosis CASP8|841 0.302178695 9.55E-09 1.33E-07 1.39E-07 Apoptosis PIK3R5|23533 0.251195017 0.0203725 0.050986098 0.056199999 Apoptosis BAX|581 0.233032518 5.87E-06 4.50E-05 4.70E-05 Apoptosis TIMP3|7078 3.807469864 4.97E-05 0.000297352 0.00032103 p53 CDK2|1017 2.320657916 0.000397915 0.001825975 0.001989575 p53 PCNA|5111 2.187994451 0.001682802 0.006313055 0.007047907 p53 CDKN1A|1026 1.242686496 0.466095373 0.595617163 0.606302925 p53 RB1|5925 1.216359365 0.320337612 0.454773083 0.488133505 p53 CDK4|1019 1.068061553 0.867546058 0.912416713 0.942241932 p53 CCND1|595 0.979846591 0.935851731 0.958009472 0.977464002 p53 MDM2|4193 0.956158011 0.821050083 0.881830963 0.899780913 p53 E2F1|1869 0.847764335 0.781888716 0.853935864 0.882594738 p53 CCNE1|898 0.822984104 0.360058513 0.496061983 0.543484548 p53 GADD45A|1647 0.626866347 0.083653584 0.160475787 0.165509128 p53