Sharif University of Technology
Scientia IranicaTransactions A: Civil Engineering www.scientiairanica.com
Bed form characteristics in a live bed alluvial channel
H. Heydari, A.R. Zarrati
and M. Karimaee Tabarestani
Department of Civil and Environmental Engineering, Amirkabir University of Technology, No. 424, Hafez Ave., Tehran, P.O. Box 15914, Iran.
Received 30 January 2013; received in revised form 15 June 2013; accepted 15 April 2014
KEYWORDS Bed form;
Live bed condition; Flow intensity; Dune celerity; Bed roughness.
Abstract.Bed forms are generated in alluvial streams due to mutual interaction between ow and erodible bed material. Among the variety of possible bed forms, dunes are the most important feature and much attention has been paid to them in the literature. In the present study, an experimental approach was carried out to investigate the geometry of dunes and their celerity in an erodible sand bed. The tests were conducted under live bed conditions in an experimental ume capable of re-circulating both water and sediment. Present experiments showed that the Shields number had a considerable eect on dune height and celerity, while the eect of this parameter on the dune length was not signicant. Furthermore, dimensional analysis is used to present the relationships between dune height and length, as well as celerity. These relationships were also compared with previous empirical equations and experimental data, which showed their acceptable accuracy. Bed roughness related to bed forms was also analyzed based on all available experimental and eld data. Results demonstrated that by increasing the Shields number, the ratio of Manning coecient, related to bed forms, to total Manning coecient increased with a logarithmic trend.
© 2014 Sharif University of Technology. All rights reserved.
1. Introduction
In an alluvial stream, the mobile bed formed by sand is seldom at, and the streambed is usually covered by periodic bed deformations, known as bed forms. These bed forms change in type and size depending on ow conditions. Bed forms initiate with ripples at low shear stress, with progressive development of dunes, washed-out dunes (transition), at bed, anti-dunes, and standing waves, with increasing shear stress or velocity [1]. The prediction of bed form geometry is an essential component for estimating overall ow resistance and water levels during oods in rivers. The Einstein and Barbarossa [2] relationship was the rst to consider the rule of bed forms in total bed friction *. Corresponding author. Tel.: +98 21 64543002;
Fax: +98 21 66414213
E-mail addresses: H. Heydari@gmail.com (H. Heydari); Zarrati@aut.ac.ir (A.R. Zarrati); M.Karimaee@aut.ac.ir (M. Karimaee Tabarestani)
directly by dividing the hydraulic radius into two parts; one due to grain roughness, and the other due to bed forms.
Among the variety of possible bed forms in an alluvial stream, dunes are the most important feature and much attention has been paid to them in the litera-ture [1,3-6] This fealitera-ture is more frequently encountered in alluvial streams, which have large dimensions and, consequently, resistance to ow (Figure 1). The ow over a dune is characterized by a circulating zone, whose length depends on dune height, and a long fetch of attached ow up to the dune crest [7]. The triangular sections of the dunes are not symmetric. The upstream face is inclined at about 10 to 20 degrees and the downstream face is at an angle of about 30 to 40 degrees to the horizontal. These bed forms are not static and gradually move forward with time, of course at a very slow and creeping velocity much less than that of the ow (Figure 1).
Extensive research has been undertaken in the past by various investigators into the prediction of bed
Table 1. Empirical equation for predicting dune dimensions. Equation
No. Reference Dune length Dune height
1 Allen (1978)
For < 0:15 Log() = 1:0517 Log()
+1:1534
Log() = 1:2091 Log(h) 1:0762 For 0:15
Log() = 1:3543 Log() +1:4553
2 Yalin (1964) = 5h n
h =16
0 c
0
3 Van Rijn (1984) = 7:3h h= 0:11(d50=h)0:3(1
e 0:5T)(25 T )
4 Julien and Klaassen (1995) = 6:25h
h= 2:5 dh50
0:3
Note: is dune length; is dune height; h is ow depth; 0and care available and criticcal
shear stress, respectively, and T is transport stage parameter dened as (0 c)=c.
Figure 1. Schematic view of dune characteristics and migration.
form geometry, specically, dunes in alluvial channels, using eld [6] or experimental data [8,9,10], or both [5]. Table 1 summarizes some dierent equations for esti-mation of dune dimensions. Each of these contributions is applicable to problems similar to the specic physical conditions under which the empirical equations were developed. Signicant early contributions, in this respect, were made by Yalin [3], Ranga Raju and Soni [4], and Allen [11] who developed dune height relationships as a function of bed shear stress and other variables. Van Rijn [5] analyzed a large number of ex-perimental and eld data to develop a relationship for dune dimensions as a function of ow depth, sediment size and a transport stage parameter (function of shear stress and critical shear stress). However, Julien and Klaassen [6] suggested that the Van Rijn [5] approach underestimates the dune height in large rivers. They found that dune characteristics are independent of transport stage parameters for large rivers and are
only a function of relative particle diameter. They also modied the Van Rijn [5] method and presented new relationships for dune characteristics. Karim [1] proposed a new method for predicting relative dune height in a sand-bed stream based on the concept of relating energy loss due to form drag to the head loss across a sudden expansion in open channel ows. There is no study in the literature on dune celerity.
Basically, two approaches are suggested to esti-mate the bed roughness in alluvial streams: 1) methods based on bed forms and grain related parameters, such as bed form length and height and material size [5], and 2) methods based on integral parameters, such as mean ow depth and velocity and bed-material size [12]. However, since the rst method conforms to the physics of the phenomenon, it is more universal and popular. According to this method, the bed shear stress () in an alluvial stream can be divided into two parts: i) shear stress due to grain roughness or skin friction (0), and ii) form related bed shear stress (00) [13]. The latter is related to the dierence in pressure distribution between upstream and downstream of the bed form crest.
Results of previous relationships for dune char-acteristics and bed resistance related to bed forms dier drastically from each other. This may be due to the complexity of the underlying physical process, which can be attributed to several factors, e.g., a large number of governing variables and interaction between them, the 3D nature of bed form development and the lag in bed form adjustment in response to changing ow conditions [1]. Therefore, additional research is needed and more data is required for the accurate formulation of this complex process. The main scope of the present work is to study, experimentally, dune characteristics and their eect on ow resistance. In addition, the celerity of dunes, which had not been addressed by
previous studies, is also investigated and a relationship is suggested for it. An approach for estimating bed roughness is also presented.
2. Experimental setup
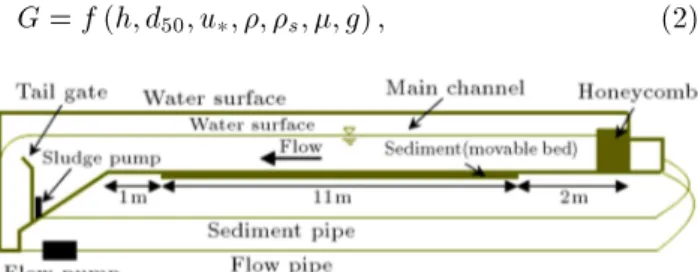
Experiments were conducted in a horizontal ume, with an erodible bed 14 m long, 0.75 m wide and 0.6 m deep, at the hydraulic laboratory of Amirkabir University of Technology, Iran. Water and sediment were circulated in the channel by a centrifugal pump with maximum capacity of 120 (Lit/s) and a sludge pump with maximum capacity of 5 (Lit/s), respec-tively. The ow rate in the ume was controlled and preset by a speed control unit attached to the pump system. An electrical ow-meter was installed in the supply conduit to measure the water discharge through the channel. Figure 1 shows the longitudinal prole of the laboratory ume and its dierent components. The channel bed was lled with uniform sand about 20 cm thick, with d10 = 0:65 mm, d50 = 0:85 mm, as median bed material size, d90 = 1:05 mm, and a density of 2650 (kg/m3), starting at a distance 2 m downstream of the entrance. The geometric standard deviation of sediment grading, g = pd84=d16, was 1.22, where da is the size of sediment for which a percentage of material by weight is ner, implying that the sample is uniform. In order to reduce the ow disturbance and turbulence, a honeycomb (ow straightener) was used at the upstream section of the channel). Velocity proles measured by ADV (Acoustic Doppler Velocitimeter), when the ume bed was xed, showed that the ow was fully developed after 5 m from the ume intake.
All experiments were conducted under live bed conditions (u =uc > 1; where u is bed shear velocity and uc is critical shear velocity for the bed material). The range of ow intensity (u =uc) was between 1.2 to 4.7. The ow regime in all experiments was subcritical with maximum Froude number of 0.8. Shear velocity (u) in the channel was determined by calculating the water surface prole and the slope of the energy line. Thereby, the water depth at upstream and downstream of the channel was measured by a point gage with accuracy of 0:1 mm after the bed form characteristics in the channel were developed, and similar with time. To calculate water surface prole, a value for Chezy coecient was initially assumed. Then, the calculated water surface elevation upstream of the ume was compared with the measurement results and, if dierent, the bed roughness coecient was slightly modied. However, at higher ow intensities (u =uc 2:35), with large dunes, the water surface was undulated and accurate measurements were not possible. From experiments in ow intensity lower than 2 (u =uc < 2), it was concluded that the measured
Chezy coecient for the ow conforms well to the empirical equation presented by Van Rijn [13], which is:
C = 18Log
12Rh
3d90+ 1:1(1 e=)
; (1)
where C is Chezy coecient, Rh is hydraulic radius, is dune length, is dune height and d90 is the size of sediment for which 90% of the material by weight is ner. Therefore, at higher ow intensities, the Van Rijn [13] equation was used for the estimation of the Chezy coecient. Shear velocity was then calculated from the Chezy coecient. In addition, critical shear velocity (uc) was found by the Shields' diagram, knowing the bed shear velocity.
In each experiment, after lling the channel with water and adjusting the downstream tailgate for the desired ow depth, the ow and sludge pumps were turned on. The ow discharge was gradually increased to the considered value. Initially, the bed was in a non-equilibrium condition and was degraded by the ow. The transported sediment was then deposited in the reservoir at the downstream end of the channel and was pumped continuously by the sludge pump to the channel inlet (Figure 2). Gradually the bed forms were developed in the channel and migrated downstream with increasing dimensions, temporally. However, after a couple of hours, the bed forms (dune wave) reached equilibrium condition, where their length and height were similar along the channel.
The longest time for development of dunes was about 5 hours for the smallest ow intensity, which was decreased by increasing ow intensity. After the equilibrium state was reached, the dimensions of dunes and their celerity were measured by plastic rulers attached to the ume side walls, both horizontally and vertically. Each experiment was repeated at least twice for verication. Figure 3 shows the dune under equilibrium condition.
3. Dimensional analysis
Important parameters that aect dune dimensions, including its length, height, and also dune celerity in a steady and quasi-uniform ow, can be expressed as [5,10]:
G = f (h; d50; u; ; s; ; g) ; (2)
Figure 2. Side view of laboratory ume and its dierent components.
Table 2. Results of experiments. Exp. number Flow depth (m) Discharge
(m3/s) (mm)d50 (m/s)u u =uc
Shields number () Sediment Reynolds number (Re*) Dune height (cm) Dune length (cm) Dune celerity (cm/s) Investigation 1 0.20 0.05 0.85 0.025 1.20 0.045 19.86 2.5 98 0.014
Present study 2 0.20 0.06 0.85 0.032 1.52 0.074 25.42 3 95 0.051
3 0.20 0.07 0.85 0.039 1.85 0.111 30.98 3.5 93 0.064 4 0.20 0.08 0.85 0.049 2.35 0.175 38.93 5 95.5 0.108 5 0.20 0.10 0.85 0.068 3.28 0.336 54.02 7 94 0.192 6 0.17 0.05 0.85 0.033 1.56 0.079 26.21 3 81 0.092 7 0.17 0.06 0.85 0.041 1.95 0.122 32.57 3.5 84 0.108 8 0.17 0.07 0.85 0.053 2.54 0.204 42.10 5 84.5 0.151 9 0.17 0.08 0.85 0.063 3.01 0.288 50.05 5.5 82 0.238 10 0.17 0.10 0.85 0.085 4.07 0.525 67.52 7 80 0.277 11 0.15 0.05 0.85 0.037 1.75 0.100 29.39 2.5 70 0.128 12 0.15 0.06 0.85 0.052 2.52 0.197 41.31 4.5 68 0.121 13 0.15 0.07 0.85 0.065 3.12 0.307 51.64 5.5 70 0.178 14 0.15 0.08 0.85 0.076 3.65 0.420 60.37 6 73.5 0.277 15 0.15 0.10 0.85 0.097 4.67 0.684 77.06 6.5 79 0.5 16-30 0.085
0.017 0.01 0.21 0.23 0.82 0.025 0.073 1.28 5.02 0.053 1.159 8.17 55.56 1.1 4.3 10.5 71.8 | Colman et al.(2005) [14] 31 84 0.108 0.272 0.08 0.14 0.4 1 0.052 0.112 2.38 6.04 0.188 1.157 19.55 104.91 1.5 6.8 44.7 121 | Tallebbydokhti et al. (2006) [10] 85 0.305 | 0.28 0.043 0.03 0.416 11.36 1.8 36.6 | (1966) fromGuy et al.
Karim (1999) [1]
Figure 3. Dune waves in equilibrium condition.
where h is ow depth, d50 is the median diameter of the bed sediment, u is friction velocity, and s are uid and sediment density, is uid dynamic viscosity, and g is gravitational acceleration. The parameter, G, in the above equation stands for dune length (), its height () or its celerity (Vd). By applying Buckingham theory with repeatable variables of , d50and g, Eq. (2) can be written as:
G = f
h d50;
ud50
;
u2 d50g
; (3)
where G is a dimensionless parameter and is dened as dune eective length (=d50) or dune eective height (=h) or dune eective celerity, Vs= Vd=pg:d50:=, where is the dierence between sediment and ow densities. The rst parameter in the right hand side of Eq. (3) is relative bed roughness. The second and third parameters are dened as particles
Reynolds number (Re*) and Shields parameter (), respectively.
4. Results
4.1. Dune characteristics
Experiments were conducted with dierent ow depths and discharge, so that the Shields number was in-creased up to 0.68. Table 2 summarizes all experiments conducted in the present study, and the measurement results. In addition to the present work, experimental and eld data for dune dimensions under a wide range of ow conditions and sediment sizes presented by previous investigations are also shown in Table 2. Figure 4 shows the variations of dune dierent char-acteristics with Shields number, and no correlation can be observed between the dune eective length (=d50) and . Nevertheless, present experiments show that Shields number is important on dune height (=h). For example, by increasing about 15 times, the dune eective height (=h) is increased 3.5 times (Figure 4(b)). An interesting conclusion from this gure is that the increasing rate of dune relative height decreased at higher Shields number (), i.e. > 0:4. This may be due to the change in the ow regime, as the height of dunes in the low ow regime decreased in the high ow regime, where the dune crest is washed away towards transition.
Finally, as shown in Figure 4(c), by increasing the Shields number, dunes eective celerity (Vs) increased
Figure 4. Variations of dune dimensions and celerity with Shields number: a) Dune relative length; b) dune relative height; and c) dimensionless celerity of dunes.
considerably. From experiments, by increasing from 0.045 to 0.68 (for about 15 times), parameter Vs increased about 35.7 times. This shows the substantial eect of ow velocity and bed shear stress on the celerity of the dunes.
Based on the present experimental data and Eq. (2), the following equations were derived for dune characteristics:
h=0:05
d50 h
0:15
ud50
0:7
u2 d50g
0:1 ; (4)
= 4:8 h; (5)
Vs=0:05
d50 h
0:95
ud50
1:1
u2 d50g
0:3 : (6) The regression coecients for Eqs. (4) and (5) are about R2= 0:96, and, for Eq. (6), is about R2= 0:93.
Figure 5. Comparison of measured and calculated relative dune height.
Figure 6. Comparison of measured and calculated dune length.
Eq. (5) shows that the most eective parameter on dune length is the ow depth. This is in agreement with previous studies (see Table 1). Figures 5 to 7 show a comparison of Eqs. (4) to (6) predictions with the present experimental data. The 45 line and the dashed lines in these gures show complete agreement and error bounds of prediction, respectively.
Furthermore, Figures 8 and 9 show the com-parison of Eqs. (3) and (4) with previous empirical equations using all existing data presented in Table 2. As shown in Figure 8, nearly all clouds of experimental data for dune length are between the two lines of empirical equations presented by Allen [11] and Van Rijn [5]. However, the results of Eq. (4) are nearly in the middle of the regions between these two lines.
Figure 9 compares the prediction of dierent empirical equations for dune eective height with all available experimental data. The line of best agreement is also shown in this gure. The range of each equation prediction is shown by a polygon in this gure.
Obviously, the closer this polygon is to the line of perfect agreement, the more accurate the equation is. As shown in this gure, the lowest and highest polygons (under prediction and over prediction) are related to the empirical equations presented by Allen [11] and
Figure 7. Comparison of measured and calculated dune celerity.
Figure 8. Comparison of dierent equations in predicting dune length.
Figure 9. Comparison of dierent equations in predicting relative dune height considering all available data.
Julien and Klaassen [6], respectively. However, the data region of Eq. (4) is between them and encompasses data regions for the equations presented by Julien and Klaassen [6], VanRijn [5] and Yalin [3].
4.2. Bed roughness
In a uniform ow, the bed shear stress () can be correlated to the square of the mean velocity with the following relationship:
= 18fV2; (7)
where f is the Darcy-Weisbach roughness coecient. The following relationship can be written for total roughness coecient in a live bed alluvial stream [13]:
f = f0+ f00; (8)
where f0 and f00 are roughness coecients related to grains and bed forms, respectively. Based on the relationship between the Darcy-Weisbach roughness coecient and the Manning roughness coecient, ne-glecting the eect of hydraulic radius on Manning coecient, one can write:
n2= n02+ n002: (9)
The Manning coecient related to grains in a plane bed (n0) can be estimated from [13]:
n0= R
1 6 h 18Log 12Rh
d50+3:3u
; (10)
where Rh is hydraulic radius and is the kinematic viscosity of water. By estimating total Manning coecient (n) from the Manning equation and also the Manning coecient related to grains (n0) from Eq. (10), one can predict the Manning coecient related to bed forms (n00) from Eq. (9). Analyzing experimental data showed that the ratio of n00=n is between 0.5 and 0.92
Figure 10. Variation of n00=n calculated by log. law with
for Shields number between 0.045 to 1.16, equivalent to Froude number (F ) between 0.24 and 0.76 (Figure 10). By regression analysis, including all data in Table 2, the following logarithmic relationship was developed for the relative Manning coecient related to the bed form as:
n00
n = 0:11Ln + 0:88: (11)
5. Conclusion
An experimental study was carried out to investigate dune characteristics in sand beds. The experiments were conducted in a water and sediment recirculating ume. The ow and deposited sediment in the reservoir at the downstream of the ume were pumped to its upstream inlet. Experiments were performed under live bed conditions, with a ow intensity parameter (u =uc) range of 1.2 to 4.7. Each test was continued until equilibrium condition was achieved, where the bed features (dune wave) were similar in length and height along the channel. Under this condition, dune dimensions, including height and length, as well as celerity, were recorded. Present experiments showed that the Shields number has a considerable eect on dune height and celerity. For example, by increasing the Shields number from 0.045 to 0.68, the dune eective height and its eective celerity increased by 3.5 and 35.7 times, respectively. However, the eect of this parameter on dune length was negligible. Based on dimensional analysis and experimental data, empirical equations were developed for dune characteristics by regression analysis. Comparison of the present re-lationship with the available experimental and eld data, as well as empirical equations presented by previous investigations, showed an acceptable accu-racy.
Furthermore, in addition to dune characteristics, bed roughness related to bed forms was analyzed based on all available experimental and eld data. Results of this part showed that by increasing the Shields number from 0.045 to 1.16, the ratio of Manning coecient, related to dune height, to total Manning coecient increased from 0.5 to 0.92. An empirical equation was also developed for the Manning coecient related to bed forms.
Abbreviations
Dune length
Dune height
Vd Dune celerity
Vs Dimensionless dune celerity
h Flow depth
0 Available shear stress c Critical shear stress T Transport stage parameter g Geometric standard deviation of
sediment grading
da Size of sediment for which a percent of material by weight are ner
u Bed shear velocity
uc Critical shear velocity for the bed material
C Chezy coecient
Rh Hydraulic radius
Fluid density
s Sediment density
Fluid dynamic viscosity
Kinematic viscosity of water g Gravitational acceleration Re Sediment Reynolds number
Shields parameter
f Darcy-Weisbach roughness coecient f0 Darcy-Weisbach roughness coecient
related to grains
f00 Darcy-Weisbach roughness related to bed forms
n Manning roughness coecient
n0 Manning roughness coecient related to grains
n00 Manning roughness coecient related to bed forms
F Froude number
References
1. Karim, F. \Bed-form geometry in sand-bed ows", J. of Hyd. Eng., 125(12), pp. 1253-1261 (1999).
2. Einstein, H.A. and Barbarossa, N.L. \River channel roughness", Trans. ASCE, 117, pp. 1121-1132 (1952).
3. Yalin, M.S. \Geometrical properties of sand waves", J. of Hyd. Div., 90(5), pp. 105-120 (1964).
4. RangaRaju, K.G. and Soni, J.P. \Geometry of ripples and dunes in alluvial channels", J. of Hyd. Res., 14(3), pp. 241-249 (1976).
5. Van Rijn, L.C. \Sediment transport, Part III: Bed forms and alluvial toughness", J. of Hyd. Eng., 110(12), pp. 1733-1754 (1984).
6. Julien, P.Y. and Klaassen, G.J. \Sand-dune geometry of largerivers during oods", J. of Hyd. Eng., 121(9), pp. 657-663 (1995).
7. Yoon, J.Y. and Patel, V.C. \Numerical model of turbulent ow over sand dune", J. of Hyd. Eng., 122(1), pp. 10-18 (1996).
8. Kennedy, J.F. and Odgaard, A.J., An Informal Mono-graph on Riverine Sand Dunes, IIHR Ltd. Distribution Rep. No. 169, Iowa Institute of Hydraulic Research, University of Iowa, Iowa City, Iowa (1990).
9. Shen, H.W., Fehlman, H.M. and Mendoza, C. \Bed form resistancein open channel ows", J. of Hyd. Eng., 116(6), pp. 799-815 (1990).
10. Talebbydokhty, N., Hekmatzadeh, A.A. and Rakhshandehroo, G.R. \Experimental modeling of dune bed form in a sand-bed channel", Iranian J. of Sci. & Tech., 30(B4), pp. 503-516 (2006).
11. Allen, J.R.L. \Computational methods for dune time-lag: Calculations using Stein's rule for dune height", Sed. Geo., 20(3), pp. 165-216 (1978).
12. White, W., Paris, E. and Bettess, R. \A new general method for predicting the frictional characteristics of alluvial streams", H.R.S. Wallingford, Report No. IT 187, England (1979).
13. Van Rijn, L.C., Principles of Sediment Transport in Rivers, Estuaries and Coastal Seas, Aqua publication, The Netherlands (1993).
14. Coleman, S.E., Zhang, M.H. and Clune, T.M. \Sediment-wave development in subcritical water ow", J. of Hyd. Eng., 131(2), pp. 106-111 (2005).
Biographies
Hossein Heydari received his BS degree in Water Engineering from Mazandaran University, Sary, Iran, and his MS degree in Hydraulic Engineering from Amirkabir University of Technology, Tehran, Iran. He is currently working as a consulting engineer.
Amir R. Zarrati obtained a BS degree in Civil Engineering from Amirkabir University of Technology, Tehran, Iran, an MS degree in Hydraulic Engineering from the University of Newcastle upon Tyne, UK, and a PhD degree from Imperial College of Science and Technology, London, UK, in 1991. Dr Zarrati is currently Faculty Member and Professor of Hydraulic Engineering at Amirkabir University of Technology, Iran, and is involved in teaching and research in various elds of Hydraulic Engineering.
Mojtaba Karimaee Tabarestani received his BS de-gree in Civil Engineering from Mazandaran University, Babol, Iran (Noshirvani Institute of Technology) and his MS degree in Hydraulic Engineering from Amirk-abir University of Technology, Tehran, Iran, where he is currently a PhD degree student of Hydraulic Engineering.