Sharif University of Technology
Scientia IranicaTransactions D: Computer Science & Engineering and Electrical Engineering www.scientiairanica.com
A multi-objective framework for enhancing the
reliability and minimizing the cost of PMU deployment
in power systems
F. Aminifar
a, A. Safdarian
b;, M. Fotuhi-Firuzabad
band M. Shahidehpour
c a. School of Electrical and Computer Engineering, College of Engineering, University of Tehran, Tehran, 14395-515, Iran. b. Department of Electrical Engineering, Sharif University of Technology, Tehran, 11155-9363, Iran.c. Robert W. Galvin Center, Illinois Institute of Technology, Chicago, IL 60616, USA. Received 7 November 2015; received in revised form 6 April 2016; accepted 28 June 2016
KEYWORDS Multi-objective optimization; Non-dominated sorting genetic algorithm II; Phasor measurement unit;
Optimal PMU placement.
Abstract.Wide-Area Monitoring, Protection, And Control (WAMPAC) is a key factor in the implementation of smart transmission grids. WAMPAC has a crucial role in detection and prevention of widespread events with an ultimate goal of improving the electricity service reliability. Several mathematical techniques were proposed for the Optimal Phasor Measurement Units (PMU) Placement (OPP) problem which represents the rst step toward the development of WAMPAC. These techniques consider either the solution to the network observability or realization of specic PMU applications. This paper proposes a multi-objective framework for OPP which emphasizes the reliability of power systems. The objective functions minimize the investment cost and maximize the system reliability. Since the objectives are in conict, the non-dominated sorting genetic algorithm II approach is adopted as an intelligent state sampling tool to nd non-dominated solutions (Pareto front). The nal placement scheme among Pareto points is chosen by a fuzzy decision making approach.
© 2016 Sharif University of Technology. All rights reserved.
1. Introduction
The emergent Wide-Area Monitoring, Protection, And Control (WAMPAC) structure oers a precise and near real-time overview of power grids to control centers. The main building block of WAMPAC is Phasor Measurement Units (PMUs) which are dispersed over the grid. WAMPAC oers unprecedented dynamic information representing the power system status for decision making in critical circumstances.
The number and installation sites of PMUs along with their operational availabilities are the main factors
*. Corresponding author.
E-mail addresses: [email protected] (F. Aminifar); [email protected] (A. Safdarian); [email protected] (M. Fotuhi-Firuzabad); [email protected] (M. Shahidehpour)
aecting the WAMPAC performance. In the literature, a vast range of studies has focused on the Optimal PMU Placement (OPP) problem. The preliminary objective in the majority of those works is to install a minimal set of PMUs so as to make the network completely observable [1-12]. Apart from satisfying the observability criterion, a few application-based objec-tives were also considered. In [13], the OPP problem intended the identication of fault locations. In [14], the objective was to maximize the detection capability of system topology errors. A fuzzy clustering approach in [15] was devised to reduce the number of installed PMUs required for dynamic vulnerability assessment. In [16], a strategic PMU placement algorithm was to improve the bad data processing capability.
The OPP problem with observability require-ments as its objective was successfully solved by a
variety of optimization techniques including classical optimization methods such as integer linear program-ming [1-3] and integer quadratic programprogram-ming [4], as well as heuristic methods such as Non-dominated Sort-ing Genetic Algorithm (NSGA) [5], canonical genetic algorithm [6], simulated annealing [7], Tabu search [8], simulated annealing combined with Tabu search [9], particle swarm optimization [10], and immunity ge-netic algorithm [11]. Moreover, since OPP problem could oer multiple solutions for a given number of PMUs, deterministic and probabilistic observability indices were introduced to identify the dominant so-lution [3].
In [3-5] the OPP problem was considered for satisfying the system observability when considering contingencies of PMU and/or transmission line out-ages. Such considerations are technically sensible as the solution of the OPP problem is highly dependent on the network topology and the availability of PMU devices and their communication links.
The WAMPAC infrastructure receives data from PMUs through their fast communication links dispread over the power grid. So, any failures in PMUs and their accessories may degrade operators' situational awareness. That is, grid operators would not be able to monitor the system performance, take actions, or oer remedies if severe power system contingencies occur. The lack of situational awareness on August 14, 2003 prevented any early identication of the Northeast blackout and timely action [17]. The sit-uational awareness could be more prevalent in power system operations, particularly when WAMPAC fail-ures are among contributing factors in system-wide disturbances. Therefore, power system reliability is aected by the monitoring system performance, though few studies to date have focused on this issue.
The impact of SCADA failures on power system load curtailments was analyzed in [18]. A qualitative framework was considered in [19] to measure the impact of failures in the information infrastructure on the electricity supply reliability. The impact of WAMPAC malfunctions on power system reliability was assessed in [20]; however, the number and location of PMUs have been assumed to be xed in this study. A multi-state model was proposed in [21] for assessing the impact of insucient situation awareness on the probability of power system blackouts. In [21], the optimal solution of the OPP problem was oered using a greedy search method. A cost/benet analysis of OPP problem was conducted in [22]. In [23], a multi-objective PMU placement framework was proposed to simultaneously maximize system reliability and mini-mize implementation cost while power system is fully observable.
A probabilistic multi-objective model for the OPP problem is introduced in this paper in which the impact
of WAMPAC malfunctions on power system reliability is incorporated in the OPP problem. The objective functions consider investment costs and reliability met-rics. It is worthwhile to mention that it would make much more sense to formulate the PMU placement problem with explicit reliability constraints while leav-ing the observability of the network to be adapted, consequently. A linearized optimization of the load ow model is used for reliability assessment. The Non-dominated Sorting Genetic Algorithm II (NSGAII) is adopted as an intelligent state sampling tool to nd a set of non-dominated solutions which constitute the Pareto front. Finally, a fuzzy decision making method is employed to determine the best PMU placement scheme among non-dominated solutions. Numerical studies are carried out on a 9-bus system and the IEEE 57-bus test system. Sensitivity analyses are additionally conducted to investigate the impact of some important parameters on the problem solution. The current paper has three major contributions as follows:
The rst contribution of this paper is the consid-eration of power system reliability indices among objectives of the OPP problem. This is a signicant extension to the existing literature where observabil-ity indices and either the number or installation cost of deployed PMUs were mostly considered;
In order to evaluate impacts of WAMPAC mal-functions on the system performance, the paper utilizes a two-layer power system model and an extended optimal power ow analysis which have been developed by the same authors recently. The model intelligently considers impacts of operators' insight on the system when remedial actions are chosen following the emergence of faults in power system components;
The paper's last but not least contribution is to provide a very comprehensive investigation on the impact of taking reliability criterion as an objective on the OPP problem. This is done by simulating several case studies on two standard systems.
The paper is outlined as follows. In Section 2, the joint model of WAMPAC and power system is reviewed. The optimization method applied to the multi-objective OPP problem is described in Section 3. Section 4 presents the proposed algorithm. Numerical analyses and the obtained results are discussed in Section 5. Finally, concluding remarks are drawn in Section 6.
2. Statement of the problem
In this section, two main characteristics of the OPP problem are discussed. A joint reliability model is
adopted for WAMPAC and power system components, and the demand of considering various objectives in the OPP problem is explored.
2.1. Joint WAMPAC and power system model The WAMPAC infrastructure relies on accurate and quickly updated information of power system sta-tus which is intended to enable eective operational tools for making quicker and more targeted corrective actions. To do so, the information communicated to control centers is compiled and graphically pre-sented to the personnel on dynamic mimic diagrams. This process is demonstrated schematically in Fig-ure 1, where the lower and upper layers represent the power system schematic and its mimic diagram in a control center, respectively. The WAMPAC in Figure 1 is responsible for transmitting measurements, monitoring signals, and/or controlling actions owing between power system and its control center. The WAMPAC consists of a chain of components such as instrumentation transformers, PMUs as measuring devices, and communication links. If these elements lack any redundancy, their single failure degrades the WAMPAC performance missing the observability in a portion of the power network. In such cases, the operator would not receive the pertinent information necessary for taking remedial actions in unobservable regions. Such cases could trigger cascading out-ages that would potentially lead to a large black-out.
2.2. Objective functions of the OPP problem In the majority of existing models, the aim of OPP problem is to determine the minimum number of PMUs and installation locations subjected to the power network observability constraints in the base case and contingencies. The minimum set of PMUs is
syn-Figure 1. Schematic for a joint WAMPAC and power system model [20].
onymous with the least cost solution when a uniform cost is associated with PMU installations at various locations. The proposed solutions can be extended to cases in which PMU installation costs are specic to locations in power grids. However, other merits of PMU deployments, in addition to the minimizing costs, should be taken into account to determine an optimal scheme for PMU placements.
Based on the previous discussions, higher system reliability is an aspect inuenced by the WAMPAC development which is adopted here as another objective function for the OPP problem. It should be noted that system observability and reliability are strongly but indirectly coupled to each other. In dispatching centers, it is highly intended to have an observable power network so as to be able to preserve the system operational reliability. In other words, when the system is suciently observable and controllable, the severe events threatening the reliability of electricity service can be detected and tackled in a timely and eective fashion. From the opposite perspective, a high reliability power system calls for an acceptable level of observability and controllability over the power system and components. In terms of the number of PMUs in a typical power system, Figure 2 shows a typical variation of WAMPAC development cost with the system reliability index and the Expected Energy Not Supplied (EENS). Here, more PMU devices correspond to a greater investment cost and a higher reliability level (i.e., lower EENS). In Figure 2, we considered a uniform cost for PMU installations at dierent locations. So, the investment cost increases monotonically. However, there would be a limit on lowering the reliability index as we increase the number of PMUs. This observation is regularly referred to as reliability improvement saturation, and it is in accord with the reliability concepts for attaining an optimal level of PMUs. To identify the optimal point, the reliability enhancement is converted to a monetary value which is often a challenging task. The multi-objective optimization method may otherwise be considered in which the two objective functions are in conict. The multi-objective method oers a set of optimal solutions to decision-makers for specifying the nal plan.
Figure 2. The investment cost and reliability index versus the number of PMUs.
3. Multi-objective optimization technique This section discusses the multi-objective optimization and NSGAII method applied to the proposed OPP problem.
3.1. Multi-objective optimization
There are two approaches to a multi-objective opti-mization problem. In the rst approach, the weighted-sum of objectives is introduced which would require a prior knowledge of the solution in order to properly determine the weights [24]. The second approach is based on the non-dominance concept [25].
Among various methods applied to the non-dominance concept, NSGAII has shown its superiority and robustness for handling non-convex and mixed integer-programming [25].
3.2. NSGAII method
NSGAII optimization technique, which is used fre-quently, is an enhanced version of NSGA in solving multi-objective optimization problems. NSGAII uses the crowding distance method instead of sharing pa-rameters which seems to be more ecient in terms of yielding an appropriate diversity of nal solutions. NSGAII is based on an elite selection method in which ospring and parents are composed in a set and the selection and recombination are accomplished [25,26].
The rst population in NGSAII is initialized and sorted into the fronts regarding the objective func-tion and eectively based on non-dominance concept. Accordingly, each Pareto front and its individuals are assigned with a rank, e.g. the rst front and its individuals dominate the others and thereby attributed to rank 1. The second front dominates the others except the rst front, and consequently possesses rank 2, and so on. Every member of each Pareto front with the same non-dominance rank is then assigned a distance which is calculated based on the crowding distance approach and in accordance with the other members in the same Pareto front.
The crowding distance parameter indicates how close two individuals are. So, individuals with a large average crowding distance parameter are selected and a better diversity of solutions is achieved. Meanwhile, the individuals in the boundary are always selected since they have innite distance assignments.
The binary tournament algorithm is then utilized to select the present populations by which the lower ranked in non-dominance and higher ranked in distance values are considered in the parents' selection process. The ospring populations are generated using the tra-ditional crossover and mutation. Parents and ospring are ultimately combined to form a collection and the next generation. This process will continue until the criterion is satised, i.e. the number of iterations or
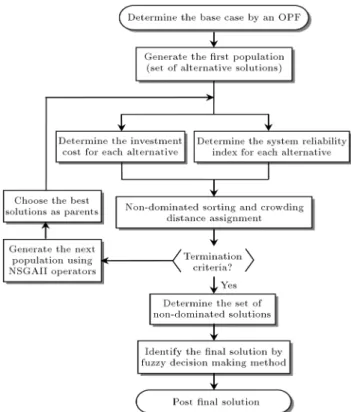
Figure 3. Flowchart of the proposed method for multi-objective OPP problem.
trivial improvements in the objective functions are satised.
4. Proposed methodology
In this section, the proposed OPP methodology is presented which considers WAMPAC malfunctions in power system reliability evaluations. The nal decision procedure considering several OPP schemes is also discussed.
4.1. Outline of the methodology
Figure 3 shows block diagram of the proposed solution for the OPP problem. The candidate buses for PMU placements are initially determined by the rst popu-lation creation. The investment cost and the reliability index associated with each solution are then calculated. Mathematical formulations of these objective functions would be presented in the following subsections. The NSGAII examines the non-dominance concept for the created population according to the objective value of individual placement schemes.
It also sorts the plans in Pareto fronts. The termination criteria are checked next, and the opti-mization procedure is terminated if one of the criteria is met. Otherwise, a new population is built using the NSGAII operators. The termination criteria are checked again once the values of objectives for the new population are computed and Pareto fronts are updated. Usually, either or both the numbers in
the Pareto front and the iterations are considered as termination criteria. Subsequent to the termination of the iterative procedure, the fuzzy decision making method is implemented to select the nal solution in the non-dominated set. This process would be further discussed in the following section.
4.2. Total investment cost of WAMPAC The total investment cost of WAMPAC is divided into two parts. The rst part is known as the xed cost which mainly refers to the control center hardware/software facilities. For a given system, this cost is usually deemed independent of the number of PMUs to be installed in the power network. Note that this term does not have any eect on the solution of optimization problem since it is independent of the decision variables, i.e. PMU locations. The second part, generally known as the PMU cost, depends on the number of installed PMUs and their locations. The cost associated with PMUs at a given bus includes PMU procurement expense, cost of PMU installation panel, power supply provision, GPS installation and wiring, other auxiliary equipment, and labor fees.
The cost associated with communication link could be taken into account by updating the PMU installation cost. However, the resulting model might be impractical because the communication system expansion often depends on other factors which sur-pass PMU requirements. In essence, communication system functionalities encompassing SCADA, control, voice, teleprotection, etc. could exceed those of PMUs. Accordingly, the cost associated with communication systems would not be included in the objective func-tion.
For each solution, the investment cost is [22]: IC = F C +X
i2I
uici; (1)
where IC denotes the investment cost of WAMPAC infrastructure, F C is the xed cost term of IC, ui is
a binary decision variable that is equal to 1 if bus i is equipped with PMU and 0 otherwise, ci stands for
the installation cost of PMU at bus i, and I represents the set of system buses. It should be mentioned that F C in Eq. (1) has no impact on the nal solution since it is independent of the number of PMUs. Generally speaking, the cost of WAMS center software/hardware facilities can, however, be a function of the number of PMUs supported in some real cases. This means that F C can be a function of the number of PMUs. In this paper, without loss of generality, F C is deemed to be independent of the number of PMUs, but it is incorporated in the objective function in order to compute the whole implementation cost as well as to keep generality of the model.
It is worth noting that presently, the PMUs on the
shelf have a limited number of channels due to technical limitations. Accordingly, it might be technically and nancially justiable to have more than one PMU in a substation with many connections. In such a case, ui
should be an integer variable instead of binary. In [27], the placement problem of limited-channel PMUs has been thoroughly discussed.
4.3. Joint reliability assessment of power systems with WAMPAC infrastructure In the following, the impact of WAMPAC malfunctions on the power system reliability evaluation is discussed briey [20]. The assessment of power system reliability consists of three steps including state selection, state analysis, and index calculation. In the rst step, credible states of the system under study are dened. The conventional reliability assessment method speci-es the system state as the combination of status of power system components such as transmission lines, generating units, and transformers. In addition to these components, the framework of joint reliability evaluation of power system and WAMPAC infrastruc-ture determines the status of WAMPAC equipment in the state generation process. Additional components could also be considered in the state generation which would increase the required computation time for the reliability assessment. Intelligent sampling techniques and scenario reduction methods are the two eective alternatives to overcome the computation issues [28].
In the second step, the state analysis is intended. We would label the sampled state as healthy if the system load can be supplied without any violations of line ows or bus voltages. In the case of any violations, an observability assessment is conducted considering the state of power system and WAMPAC components. The results would identify unobservable regions of the system. The unobservable regions cannot be observed centrally by system operators (lack of sit-uational awareness); consequently, no remedial control action is operative. In these regions, only the local protection system monitors the component and acts in the case of violation or fault. The operator would take appropriate remedial actions if any violations occur in observable regions.
The last step is to calculate reliability indices based on the results in the last two steps. Here, Loss Of Load Probability (LOLP), Expected Demand Not Served (EDNS), and EENS are calculated as follows:
LOLP = X
s2Sc
s; (2)
EDNS = X
s2Sc
X
i2IL
s:LSi;s; (3)
where s is the occurrence probability of scenario
s, LSi;s represents the load shedding at bus i and
associated with scenario s, Sc denotes the set of
scenarios with load curtailment, and IL stands for
the set of system load buses. It should be noted that, in Eq. (3), EDNS has no time nature. However, multiplying EDNS with a specic time period, a day or a year, leads to EENS index which reects the expected energy not supplied in the associated time period. Here in Eq. (4), 8760 is selected to calculate the expected energy not supplied in a year. Other reliability indices may similarly be incorporated in the proposed approach [29,30].
4.4. Final solution
The NSGAII method could result in several Pareto optimal solutions. Among these non-dominated solu-tions, a realistic and desirable solution is to be adopted which can meet the decision maker's goals. In other words, since the above described method tackles the OPP problem in a multi-objective framework, a non-dominated solution pool is nally produced. However, the system analyst should adopt a single solution among the pool to be implemented in the system. This process can be totally fullled by engineering judgment. However, more systematic decision making methods have been also proposed [31]. Among them, this paper uses fuzzy satisfying decision making method where the engineering judgment can be incorporated as well [32-34]. The fuzzy satisfying method is an ecient and simple option which mimics the human interpretation and would handle our decision problem through mem-bership functions. For each objective, a rigorous and monotonically declining and continuous membership function is assigned. In the minimization method, the assigned membership function is descending with a value equal to 1 at the desired value and 0 at the maximum of the objective. Figure 4 shows a typical membership function for a minimization case. In this gure, fi and fi denote objective function i and the
relevant membership degree. It is worth mentioning that a1 and a2 are, respectively, associated with the
best solution (a desired one or logically the minimum in most cases) and the worst solution (the maximum) of fi. They can readily be set based on the solution pool
members or even engineering judgment. Function fi,
dened by the decision maker, represents the extent
Figure 4. A typical descending fuzzy membership function.
by which an optimal solution satises each objective fulllment.
The next step for adopting the optimal OPP solu-tion is performed by dening the following optimizasolu-tion problem:
minX
j2J
jd
j fjjk; (5)
where fj is the membership degree associated with the nal value of the objective function j, d
j denotes
the desired level of membership degree of the objective function j, k is a constant exponent greater than unity, and J represents the set of objective functions. This optimization problem would minimize the total deviation of membership functions from desired levels. 5. Case studies
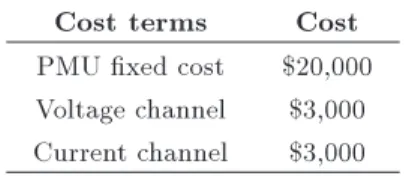
In this section, performance of the proposed approach is examined on a 9-bus system and the IEEE 57-bus test system. These systems have already been studied in [20] for the reliability assessment considering WAMPAC malfunctions. As discussed in Eq. (1), the cost of WAMPAC implementation has a xed term for the control center development, and it is assumed here to be $400,000. In practice, the PMU cost of WAMPAC infrastructure is assumed to be a function of the number and the location of PMUs. The PMU installation has a xed cost term for items such as panel and GPS installation and a channel-dependent term. At a given bus, one PMU channel is assigned to the bus voltage measurement, and other channels are allocated to current measurements for the associated transmission lines, loads, and generating units.
The associated costs of PMU are given in Table 1. If a PMU located at a specic bus is connected to three transmission lines and a generating unit, the cost of PMU installation would be $35k which includes $20k for the xed cost, $9k for three current channels of transmission lines, $3k for a current channel of generating unit, and $3k for the bus voltage channel. Note that if among connections associated with a given bus the currents of all except one are measured, the remaining one could be computationally observable too by applying Kirchho current law. Hence, one can reduce current channel requirements. However, this feature is excluded here. For reliability assessment, EDNS is adopted and objective functions include the
Table 1. PMU installation cost terms. Cost terms Cost PMU xed cost $20,000 Voltage channel $3,000 Current channel $3,000
minimization of reliability index and cost. Simulations are executed in the MATLAB environment. It should be noted that no comparison with the exiting research is provided since the literature either accommodated the network observability as the problem constraint or used very dierent assumptions in the reliability modeling. In order to ll up this gap and demonstrate the performance and eectiveness of the proposed method, various case studies and sensitivity analyses have been performed and discussed.
5.1. The 9-bus system
The 9-bus system has 3 generator buses, 3 load buses, and 9 transmission lines. The single-line diagram of this system is depicted in Figure 5. If we use the data in Table 1, depending on the number of required channels, the cost of PMU installation for the 9-bus system is presented in Table 2. The required data for power ow study and reliability assessment are provided in [20].
Figure 5. Single-line diagram of the 9-bus system. Table 2. PMU installation cost at the 9-bus system.
Bus # Installation cost
1-3 $29,000
4-9 $32,000
The proposed OPP algorithm is applied to the 9-bus system with a population size of 100 individuals. The following cases are studied:
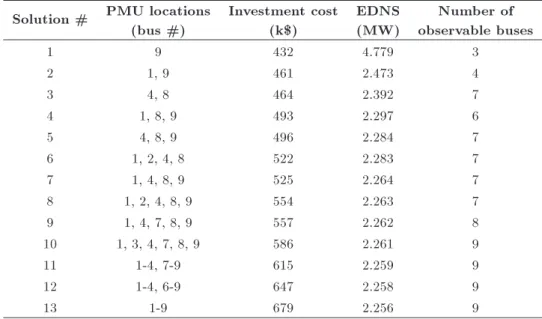
- Case I. (base case): In this case, failures of both power system and WAMPAC components are incor-porated. 13 non-dominated solutions are obtained after 50 iterations which are presented in Table 3 and depicted in Figure 6. According to Figure 6, the optimal investment cost ranges between $432k and $679k which correspond to an EDNS between 4.779 and 2.256 MW, respectively. Solution 1 has only one PMU located at bus 9 which is the major load point [20]. In the next plan, EDNS is reduced by 50% when the investment cost is increased from $432k to $461k. In Solution 2, the added PMU is assigned to bus 1 which corresponds to the largest generating unit [20]. The higher priorities of buses associated with large generating units and major loads would match the empirical PMU placement criteria. The next optimal solution allocates two PMUs at buses 4 and 8. The perceived reliability limit is apparent in Figure 6 where the additional
Figure 6. Pareto optimal solutions of the 9-bus system (Case I).
Table 3. Non-dominated solutions of the 9-bus system: Case I. Solution # PMU locations
(bus #)
Investment cost (k$)
EDNS (MW)
Number of observable buses
1 9 432 4.779 3
2 1, 9 461 2.473 4
3 4, 8 464 2.392 7
4 1, 8, 9 493 2.297 6
5 4, 8, 9 496 2.284 7
6 1, 2, 4, 8 522 2.283 7
7 1, 4, 8, 9 525 2.264 7
8 1, 2, 4, 8, 9 554 2.263 7
9 1, 4, 7, 8, 9 557 2.262 8
10 1, 3, 4, 7, 8, 9 586 2.261 9
11 1-4, 7-9 615 2.259 9
12 1-4, 6-9 647 2.258 9
investment in PMU placement has a minute impact on reliability improvements.
Among several non-dominated optimal solu-tions, only one OPP should be implemented. The fuzzy decision making approach is employed here to select the most appropriate plan. The nal solution depends on the desired levels of objectives which represent the decision maker's preferences. Here, the desired values of investment cost and reliability index are considered to be $450k and 2.256 MW, respectively. Here, Solution 2 with PMUs at buses 1 and 9 signies the most appropriate OPP plan for the 9-bus system subject to a set of desired levels. As expected, the nal solution would be dierent if desired levels of objective functions vary. The impact of desired level of investment cost is given in Table 4 for a given desired level of reliability index (i.e., 2.256 MW).
- Case II. In this case, the WAMPAC is assumed to be fully reliable, while power system components are exposed to random failures. Table 5 shows 6 non-dominated optimal solutions when applying the proposed multi-objective methodology to the
OPP problem. As expected, comparing Solutions 1 and 3 in Table 5 with those presented in Table 3 conrms that when the WAMPAC infrastructure is free from failures, the power system reliability improves and the EDNS index drops. However, more realistic assumptions for reliability assessment would correspond to OPP solutions that match the real-world experiences.
5.2. The IEEE 57-bus system
In this section, the proposed multi-objective OPP methodology is applied to the IEEE 57-bus system. This system, shown in Figure 7, has 80 transmission lines, 7 generating units with 1975 MW generation capacity, and 42 bulk loads with 1250 MW demand [35]. The base case power ow solution and generating unit data are available in [32]. The failures of both power system and WAMPAC elements are taken into consideration, and the reliability and power system data are provided in [20]. The simulation is conducted with a population size of 100 individuals.
We use the data given in Table 1 to calculate the cost associated with PMU installation at each bus of the system. The results, given in Table 6,
Table 4. IMPACT of various desired levels of investment cost given a xed desired level of reliability index. Desired level of
investment cost (k$)
PMU locations (bus #)
Investment cost (k$)
EDNS (MW)
Number of observable buses
450 1, 9 461 2.473 4
475 4, 8 464 2.392 7
500 4, 8, 9 496 2.284 7
525 1, 4, 8, 9 525 2.264 7
550 1, 4, 8, 9 525 2.264 7
575 1, 4, 7, 8, 9 557 2.262 8
Table 5. Non-dominated solutions of the 9-bus system: Case II. Solution # PMU locations
(bus #)
Investment cost (k$)
EDNS (MW)
Number of observable buses
1 9 432 4.740 3
2 1, 9 461 2.386 4
3 4, 8 464 2.265 7
4 1, 7, 9 493 2.264 6
5 4, 7, 9 496 2.263 7
6 1, 3, 7, 9 522 2.262 7
Table 6. Cost of PMU installation at buses of the IEEE 57-bus test system.
Bus # Installation
cost ($) Bus #
Installation cost ($) 21, 26, 33, 34, 39, 40, 45, 46 29,000 5, 7, 16-20, 22-25, 27, 28, 30, 31,
35-37, 42-44, 47, 48, 50-55, 57 32,000 2, 4, 10, 11, 14, 29, 32 35,000
1, 6, 13, 38 41,000 3, 8, 15, 41, 49, 56 38,000
Figure 7. The IEEE 57-bus network.
depend on the number of transmission lines, generating units, and load connections associated with each bus. The simulation leads to 105 non-dominated solutions forming the problem Pareto front which is shown in Figure 8. Table 7 shows the solutions with considerable dierence in the reliability index (those in the left hand
Figure 8. Pareto optimal solutions of the IEEE 57-bus system.
side of Figure 8) and the most reliable solution (the last Pareto point in the right hand side of Figure 8).
Given that the desired levels of the investment cost and the reliability index are $600k and 5 MW, the nal OPP scheme would be Solution 8 in which 4 PMUs are allocated to buses 9, 12, 13, and 15. Figure 7 de-picts this solution. Here, buses with the most number of connections are selected for OPP. Additionally, the power ow data show that the major loads of 150, 121, and 377 MW demands are located at buses 8, 9, and 12, respectively. The OPP corresponding to Solution 8 will make the listed buses observable either directly (buses 9 and 12) or indirectly (bus 8). On the other hand, the proposed OPP scheme will lead to the observability of all buses hosting system generations save bus 6 which includes a 100 MW generating unit. So, the heuristic rules considered in some real practices for allocating PMUs to buses with major generations and demands are endorsed in this case as well.
6. Conclusion
The rst consideration in the development of WAM-PAC is to decide on the number and location of PMUs.
Table 7. Some non-dominated solutions of the IEEE 57-bus system. Solution # PMU locations
(bus #)
Investment cost (k$)
EDNS (MW)
Number of observable buses
1 15 438 211.9 6
2 15, 34 467 211.8 9
3 13, 15 479 150.6 10
4 9, 13 488 112.3 10
5 7, 13, 15 511 62.2 14
6 12, 13, 15 523 8.98 13
7 11, 12, 13, 15 558 8.96 15
8 9, 12, 13, 15 570 5.95 15
9 9, 11, 12, 13, 15 605 5.94 17
10 4, 7, 11, 12, 13, 15 625 3.12 22
..
. ... ... ... ...
Since the objective in the deployment of WAMPAC is the enhancement of power system reliability, relia-bility metrics were explicitly incorporated in the OPP algorithm proposed here. The algorithm has a multi-objective framework to keep the investment cost rather low along with maximizing the system reliability. As demonstrated by the numerical results, the cost of WAMPAC development and the enhancement in power system reliability are two conicting objective func-tions which result in a set of non-dominated solufunc-tions. So, a compromised solution conducted by the fuzzy decision satisfying technique is adopted. Numerical results show that buses with large generating units and bulk loads would be candidates for OPP. The monitoring and control infrastructures have a proven and indispensable role in managing large power system disturbances and the ultimate blackouts. Thus, the probabilistic evaluation of these infrastructures and their failure impacts on the power system vulnerability are to be scrutinized in our future studies.
References
1. Gou, B. \Optimal placement of PMUs by integer linear programming", IEEE Trans. Power Syst., 23(3), pp. 1525-1526 (2008).
2. Gou, B. \Generalized integer linear programming for-mulation for optimal PMU placement", IEEE Trans. Power Syst., 23(3), pp. 1099-1104 (2008).
3. Dua, D., Dambhare, S., Gajbhiye, R.K. and Soman, S.A. \Optimal multistage scheduling of PMU place-ment: An ILP approach", IEEE Trans. Power Del., 23(4), pp. 1812-1820 (2006).
4. Chakrabarti, S., Kyriakides, E. and Eliades, D.G. \Placement of synchronized measurements for power system observability", IEEE Trans. Power Del., 24(1), pp. 12-19 (2009).
5. Milosevic, B. and Begovic, M. \Non-dominated sorting genetic algorithm for optimal phasor measurement placement", IEEE Trans. Power Syst., 18(1), pp. 69-75 (2003).
6. Marn, F.J., Garcia-Lagos, F., Joya, G. and Sandoval, F. \Genetic algorithms for optimal placement of phasor measurement units in electric networks", Electron. Lett., 39(19), pp. 1403-1405 (2003).
7. Baldwin, T.L., Mili, L., Boisen, M.B. and Adapa, R. \Power system observability with minimal phasor measurement placement", IEEE Trans. Power Syst., 8(2), pp. 707-715 (1993).
8. Peng, J., Sun, Y. and Wang, H.F. \Optimal PMU placement for full network observability using Tabu search algorithm", Elect. Power Syst. Res., 28(4), pp. 223-231 (2006).
9. Cho, K.S., Shin, J.R. and Hyun, S.H. \Optimal place-ment of phasor measureplace-ment units with GPS receiver", Proc. IEEE Power Eng. Soc. Winter Meeting, pp. 258-262 (2001).
10. Hajian, M., Ranjbar, A.M., Amraee, T. and Shi-rani, A.R. \Optimal placement of phasor measurement units: Particle swarm optimization approach", Proc. Int. Conf. Intelligent Systems Application Power Sys-tems, pp. 1-6 (2007).
11. Aminifar, F., Lucas, C., Khodaei, A. and Fotuhi-Firuzabad, M. \Optimal placement of phasor measure-ment units using immunity genetic algorithm", IEEE Trans. Power Del., 24(3), pp. 1014-1020 (2009).
12. Abbasy, N.H. and Ismail, H.M. \A unied approach for the optimal PMU location for power system state estimation", IEEE Trans. Power Syst., 24(2), pp. 806-813 (2009).
13. Lien, K.P., Liu, C.W., Yu, C.S. and Jiang, J.A. \Transmission network fault location observability with minimal PMU placement", IEEE Trans. Power Del., 21(3), pp. 1128-1136 (2006).
14. Chen, J. and Abur, A. \Enhanced topology error processing via optimal measurement design", IEEE Trans. Power Syst., 23(3), pp. 845-852 (2008).
15. Kamwa, I., Pradhan, A.K., Joos, G. and Samantaray S.R. \Fuzzy partitioning of a real power system for dy-namic vulnerability assessment", IEEE Trans. Power Syst., 24(3), pp. 1356-1365 (2009).
16. Chen, J. and Abur, A. \Placement of PMUs to enable bad data detection in state estimation", IEEE Trans. Power Syst., 21(4), pp. 1608-1615 (2006).
17. NERC, Real-Time Application of Synchrophasors for Improving Reliability, North American Electric Relia-bility Corporation (2010).
18. Bruce, A.G. \Reliability analysis of electric utility SCADA systems", IEEE Trans. Power Syst., 13(3), pp. 844-849 (1998).
19. Kirschen, D. and Bouard, F. \Keep the lights on and the information owing", IEEE Power and Energy Magazine, 7(1), pp. 55-60 (2009).
20. Aminifar, F., Fotuhi-Firuzabad, M., Shahidehpour, M. and Safdarian, A. \Impact of WAMS malfunction on power system reliability assessment", IEEE Trans. Smart Grid, 3(3), pp. 1302-1309 (2012).
21. Panteli, M., Crossley, P.A., Kirschen, D.S. and Sobajic, D.J. \Assessing the impact of insucient situation awareness on power system operation", IEEE Trans. Power Syst., 28(3), pp. 2967-2977 (2013).
22. Aminifar, F., Fotuhi-Firuzabad, M. and Safdarian, A. \Optimal PMU placement based on probabilis-tic cost/benet analysis", IEEE Trans. Power Syst., 28(1), pp. 566-567 (2013).
23. Khiabani, V.H., Hamidi, M., Farahmand, K. and Aghatehrani, R. \A goal programming approach for optimal PMU placement", International Review on Modelling and Simulations, 6(2), pp. 490-497 (2013).
24. Coello, C.A.C. and Christiansen, A.D. \MOSES: A multi-objective optimization tool for engineering de-sign", Eng. Opt., 31(3), pp. 337-368 (1999).
25. Srinivas, N. and Deb, K. \Multi-objective function optimization using non-dominated sorting genetic al-gorithms", IEEE Trans. Evolutionary Computation, 2(3), pp. 221-248 (1994).
26. Srinivas, N. and Deb, K. \Multiobjective optimization using non-dominated sorting in genetic algorithms", Proc. Tech. Rep., Dept. Mechanical Engineering, Kan-put, India (1993).
27. Aminifar, F., Fotuhi-Firuzabad, M., Safdarian, A. and Shahidehpour, M. \Observability of hybrid AC/DC power systems with variable-cost PMUs", IEEE Trans. Power Del., 29(1), pp. 345-352 (2014).
28. Billinton, R. and Li, W., Reliability Assessment of Electric Power Systems Using Monte Carlo Methods, New York: Plenum Press (1994).
29. Billinton, R. and Allan, R.N., Reliability Evaluation of Power Systems New York and London: Plenum Press (1996)
30. Dupacova, J., Growe-Kuska, N. and Romisch, W. \Scenario reduction in stochastic programming: An approach using probability metrics", Math. Program., Ser. A, 95, pp. 493-511 (2003).
31. Deb, K., Multi-Objective Optimization Using Evolu-tionary Algorithms, New York: Wiley (2003).
32. Hipel, K.W., Kilgour, D.M. and Abul Bashar, M. \Fuzzy preferences in multiple participant decision making", Scientia Iranica, 18(3), pp. 627-638 (2011).
33. Liu, P.D. and Jin, F. \The trapezoid fuzzy linguistic Bonferroni mean operators and their application to multiple attribute decision making", Scientia Iranica, 19(6), pp. 1947-1959 (2012).
34. Wei, G.W. and Merigo, J.M. \Methods for strategic decision-making problems with immediate probabili-ties in intuitionistic fuzzy setting", Scientia Iranica, 19(6), pp. 1936-1946 (2012).
35. MATPOWER: A MATLAB Power System Simulation Package, http://www.pserc.cornell.edu/matpower, ac-cessed (November 2013).
Biographies
Farrokh Aminifar is currently an Assistant Professor in the School of Electrical and Computer Engineering, University of Tehran, Tehran, Iran. He has been collaborating with the Robert W. Galvin Center for Electricity Innovation, Illinois Institute of Technology, Chicago, IL, USA, since 2009. Dr. Aminifar is serving the IEEE Transactions on Sustainable Energy as the Editor and has served the IEEE Transactions on Smart Grid as the Guest Editor-In-Chief and Guest Editor of four special issues. He was the recipient of the 2011 IEEE Iran Section Best PhD Dissertation Award, the 2013 IEEE/PSO Transactions Prize Paper Award, and the 2015 IEEE Iran Section Young Investigator Award. His current research interests include
wide-area measurement systems, reliability modeling and assessment, and smart-grid technologies.
Amir Safdarian received the BSc degree from Tehran University, Tehran, Iran, in 2008, and the MSc and PhD degrees from Sharif University of Technology, Tehran in 2010 and 2014, respectively, where he is currently an Assistant Professor. He has been col-laborating with the Power Systems and High Voltage Engineering Research Group, Department of Electrical Engineering and Automation, Aalto University, Espoo, Finland. Dr. Safdarian was the recipient of the 2013 IEEE Power System Operation Transactions Prize Paper Award and 2016 IEEE Iran Section Best PhD Dissertation Award. His research interests include power system reliability and resilience, distribution system operation and planning, and smart grid issues. Mahmud Fotuhi-Firuzabad received the BS degree from the Sharif University of Technology, Tehran, Iran in 1986, the MS degree from Tehran University, Tehran in 1989, and the MS and PhD degrees from the Univer-sity of Saskatchewan, Saskatoon, SK, Canada, in 1993 and 1997, respectively, all in Electrical Engineering. He joined the Department of Electrical Engineering, Sharif University of Technology, in 2002, where he is currently a Professor and the President. He is a member of the Center of Excellence in Power System Management and Control with the Sharif University of Technology. His research interests include reliability evaluation of power system and components, smart grid initiatives, and analysis of renewable energy integrated power systems. Mohammad Shahidehpour is currently the Bodine Chair Professor and Director of the Robert W. Galvin Center for Electricity Innovation with the Illinois Institute of Technology, Chicago, IL, USA. He is a Research Professor with King Abdulaziz University, Jeddah, Saudi Arabia, North China Electric Power University, Beijing, China, and the Sharif University of Technology, Tehran, Iran. He was a recipient of the Honorary Doctorate from the Polytechnic University of Bucharest, Bucharest, Romania, in 2009. He is the IEEE Distinguished Lecturer, the Chair of the IEEE Innovative Smart Grid Technologies Conference and the Great Lakes Symposium on Smart Grid and the New Energy Economy in 2012. He is the founder and ex-Editor-in-Chief of the IEEE Transactions on Smart Grid. He was also a recipient of the IEEE PES Outstanding Power Engineering Educator Award in 2012. Dr. Shahidehpour is an IEEE fellow and a mem-ber of the US National Academy of Engineering. His research interests include power system restructuring and optimization, smart grid solutions, and microgrid technologies.
![Figure 1. Schematic for a joint WAMPAC and power system model [20].](https://thumb-us.123doks.com/thumbv2/123dok_us/8380241.2226286/3.892.96.433.821.1107/figure-schematic-joint-wampac-power-model.webp)