Vol.:(0123456789)
https://doi.org/10.1007/s12283-018-0290-1 TECHNICAL NOTE
Three-dimensional batted ball in baseball: effect of ball spin
on the flight distance
Hirotaka Nakashima1 · Gen Horiuchi2 · Shinji Sakurai3
© International Sports Engineering Association 2018
Abstract
In this study, three-dimensional baseball kinematics are described including spin characteristics batted toward the left field (same field), center field, and right field (opposite field) in baseball. The study also discusses the effects of these kinematics on the flight distance. Six collegiate male baseball players performed free-batting and were instructed to hit the ball as far as possible. The balls just before, at, and after bat–ball impact were recorded with three high-speed video cameras. Eighty-one trials (same field: 25 trials, center field: 30 trials, and opposite field: 26 trials) were analyzed, and the ball kinematics among the three hitting directions were compared. Although there were no significant differences in the initial velocities and launch angles along the vertical plane of batted balls for the three hitting directions, the flight distance for the opposite field was significantly shorter than that for the other fields. The magnitude of the side spin components for the opposite field was significantly greater than that for the other fields. We conjecture that the balls batted toward the opposite field experienced a larger Magnus force along the horizontal direction; moreover, the trajectories were relatively more curved than in the cases towards the other fields. Therefore, a straight-line distance to the batted ball landing point in the opposite field tended to be shorter despite the similar initial velocity and launch angle. The results demonstrated that the spin characteristics, especially the side spin component, were different for different batting directions, and indicated that these characteristics affected the ball trajectory and flight distance.
Keywords Aerodynamics · Magnus force · Spin axis · Spin rate · Trajectory
1 Introduction
To win the baseball games, batters must score more than their counterparts in the opponent team. Therefore, batters dedicate significant time and effort towards improving their batting skills. Although there are a variety of batting strate-gies, the ability to make a long hit, including a home run, is one of the most sought after abilities.
Several factors are responsible for the distance traveled by a baseball. First, the batted ball velocity primarily affects the flight distance; moreover, the ball spin has a consider-able effect on the flight distance. The previous studies have examined the effects of the ball spin on the flight distance in baseball. It was found that, with increasing back spin, the flight distance increased for a given velocity and launch angle of the batted balls [1]. On the other hand, a trade-off was observed between ball velocity and spin rate in batted balls. Therefore, the batters must hit the balls with an opti-mum combination of velocity and spin to achieve maxiopti-mum range. The optimum bat swing and the position of bat–ball impact required to achieve maximum range were investi-gated [2]. It was found that swinging upward and undercut-ting the ball are imperative. This notion was supported by the research results, which investigated the measurements of actual batted balls [3].
Most previous studies only focused on batting toward center field, wherein the effects of top spin and back spin on the flight distance were investigated. It is also common to
* Hirotaka Nakashima
nakashima.hirotaka@hotmail.com
1 Graduate School of Health and Sport Sciences, Chukyo University, 101 Tokodachi, Kaizu-cho, Toyota-shi, Aichi 470-0393, Japan
2 Department of Health and Well-Being, Kansai University, 1-11-1 Kaorigaoka-cho, Sakai-ku, Sakai-shi, Osaka 590-8515, Japan
3 School of Health and Sport Sciences, Chukyo University, 101 Tokodachi, Kaizu-cho, Toyota-shi, Aichi 470-0393, Japan
hit a ball along the same-field and opposite-field directions, which means the left field and right field in case of right-handed batter, as well as the center-field direction because of a variety of in-game situations. Moreover, the course of pitched balls, which denotes whether the ball is pitched inside or outside, is also different. In [4], researchers studied opposite-field hitting and found that the batted balls toward the opposite field were susceptible to slicing towards the foul territory; this could be attributed to the difference between the actual landing points and expected landing points from the launch angle. This result implied that the balls batted toward the opposite field contained side spin components and experienced Magnus force along the horizontal direc-tion. In [3], researchers studied the balls batted toward the center field, and reported that the balls batted toward the center field rotated mainly with back spin components. Therefore, it is conjectured that the characteristics of the balls batted toward the same field or opposite field may be different from those toward the center field. Although stud-ies have investigated how to hit a ball towards the same field and opposite field [5], very few studies have attempted to quantify the three-dimensional ball kinematics, including side spin and spiral spin, of the batted balls along various directions. In baseball pitching, several studies have been conducted to understand the three-dimensional ball kinemat-ics, including ball spin [6, 7]. Moreover, another study has investigated the biomechanical factors that determine the spin directions of the pitched balls [8]. As regards the other sports, the three-dimensional ball spin in a tennis serve was also investigated [9]. This study not only helped understand the ball trajectory characteristics; it also suggested how to impart a suitable spin in various occasions. An improved understanding of the three-dimensional kinematics of the balls batted toward the same-field, center-field, and opposite-field directions will enable players and coaches to determine the optimum swing and ball–bat impact position for real-izing maximum range.
The objective of this study was twofold. First, it investi-gates the three-dimensional ball kinematics with attention on the ball spin batted toward the same-field, center-field, and opposite-field directions; second, it considers the effect of these kinematics on the flight distance of the ball.
2 Experiment methodology
2.1 Participants
Six collegiate male baseball players (age 20.5 ± 0.3 years, body height: 1.78 ± 0.02 m, and body weight: 75.7 ± 3.7 kg) participated in this study. All the participants were right-handed batters. The ethics committee of Chukyo Univer-sity approved the study protocols. Prior to conducting the
experiment, the participants were apprised about the purpose of the study and experimental protocols. Written informed consent was obtained from each participant.
2.2 Procedure
All experiments were conducted in an outdoor baseball field (left and right field: 91.4 m, center field: 120 m). After suf-ficient warm-up, the participants were asked to hit fastballs launched by a two-wheel ball pitching machine, which was placed about 1.5 m in front of pitcher’s rubber. A wooden bat (1CJWH11184; length = 0.84 m; mass = 0.90 kg; Miz-uno, Japan) and official Japan amateur league baseballs (2CH11000; Mizuno, Japan) with approximately 100 small marks on the surface were used. The batters were instructed to hit the ball as far away as possible. For the completion of a successful trial, the following two pre-requisites were sought; (1) batted ball must land in the fair territory; (2) the flight distance is more than 60 m. The experiment was con-ducted until at least five successful trials were recorded in all the three directions of fair territories. As shown in Fig. 1, the fair territories were divided into three sections (same field, center field, and opposite field for 30° each).
2.3 Data collection
The movements of the balls before, at, and after bat–ball impact were recorded using three high-speed video cameras (Phantom Miro, Vision Research, USA). To calculate the linear kinematics such as the position, direction, and velocity of the ball, Camera 1 and Camera 2 were used with a frame
Center-field Pitching machine Camera1 Camera2 Camera3 Gx Gy Gz Same-field Opposite-field 45㼻 -45㼻 15㼻 -15㼻 0㼻 Gy
Fig. 1 Experimental setup and the definition of the global coordinate system
rate of 500 Hz and an exposure time of 1/20,000 s. The placement of these cameras is illustrated in Fig. 1. To con-struct the three-dimensional space around the batters, a cam-era calibration was conducted prior to the experiments. A 2.4-m pole with seven equally spaced markers was erected at six places and photographed successively. To calculate angu-lar kinematics of batted balls such as the spin rate, axis, and spin components, Camera 3, with a frame rate of 1000 Hz and an exposure time of 1/20,000 s, was used. The camera was placed near the first base, and the optical axis of the camera lens was aligned, such that it was collinear with the line of pitcher’s side of the batter’s box, as shown in Fig. 1. The configuration was designed, such that the balls’ images were magnified after bat–ball impact. The flight distance was determined using a measuring tape; the distance from the tip of the home plate to the landing points was regarded as the flight distance. To remove the effect of the wind on the flight distance, the wind velocity was measured for each trial. The trials in which the wind velocity was more than 1.5 m/s were eliminated from the study target.
2.4 Data acquisition
The positional coordinates were acquired from the video images recorded by cameras through the help of a motion analysis software (Frame DIAS V, DKH Co., Japan). The center of the balls before, at, and after bat–ball impact in the video images recorded by Camera 1 and Camera 2 was manually digitized. The three-dimensional coordinates of the center of the balls were obtained using the direct lin-ear transformation (DLT) method. The global coordination system was constructed using Gy as the horizontal direc-tion from the home plate to the pitcher’s plate, Gz as the vertically upward, and Gx as the cross product of Gy and
Gz (Fig. 1). The pitched ball velocity and initial velocity
of batted ball were calculated based on the displacements of the coordinate immediately before and after the bat–ball impact, respectively. The impact height was defined as the
z coordinate at the bat–ball impact. The launch angle in the vertical plane was formed by the initial velocity vector and horizontal plane. To quantify the ball trajectory in the hori-zontal plane, the slice angle, which is defined as the angle between the line from the home plate to the landing point and the initial velocity vector in the horizontal plane, was calculated. In case the direction of the line from the home plate to the landing point was counterclockwise compared with that of the initial velocity vector, the slice angle was positive.
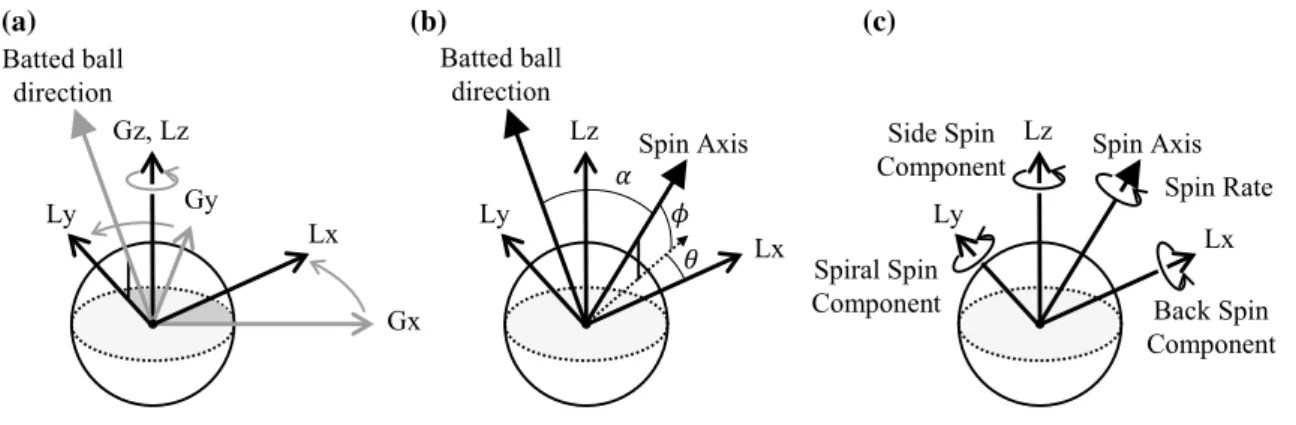
From the video images recorded by Camera 3, the spin rate and the axis were determined using the method pro-posed by Jinji and Sakurai [6]. The spin components were obtained from the spin-axis vector. These variables were calculated after converting the coordinates into the local coordinate system. For this task, we used the methods pro-posed by Winter [10]. The local coordination system was a right-handed coordinate system; it was constructed using Ly as the ball launching velocity vector in horizontal plane, Lz along the vertically upward, and Lx as the cross product of
Ly and Lz with the origin at the center of the ball, as shown in Fig. 2a. The angle of the spin axes ( 𝛼 ), ( 𝜃 ), and ( 𝜑 ) was defined as the angle between the spin-axis vector and the batted ball direction, between the spin-axis vector in hori-zontal plane and Lx, and between the spin-axis vector and horizontal plane, respectively (Fig. 2b). The spin rate, back spin component, spiral spin component, and side spin com-ponent were defined as spin rotation per second around the spin axis, Lx, Ly, and Lz, respectively (Fig. 2c).
2.5 Statistical analysis
One-way analysis of variance (ANOVA) and Bonferroni post hoc test were used to examine the kinematic differences of the batted balls along each direction. The significance level was set at p < 0.05. The statistical analyses were conducted on the SPSS software (v23.0, IBM, USA).
Batted ball direction Ly Lx Gx Gy Gz, Lz Spin Axis Ly Lx Lz Spin Rate Back Spin Component Side Spin Component Spiral Spin Component Spin Axis Ly Lx Lz Batted ball direction (a) (b) (c)
3 Results
Eighty-one trials (same field: 25 trials, center field: 30 trials, and opposite field: 26 trials), fulfilling all three requirements—(1) the wind velocity below 1.5 m/s, (2) the batted ball perfectly inside the camera frame, and (3) marks on ball clearly identified for digitization—were ana-lyzed. There were two over-the-fence home runs in trials, the landing points of which were not identified and the flight distance which was assumed to be 125 m. The slice angle for these two trials could not be calculated. Table 1 shows the average and standard deviation of the pitched
ball velocity, impact height, and wind velocity for the three conditions. No significant difference was observed among the three hitting directions. Table 2 shows the average and standard deviation of the flight distance, initial velocity, launch angle in the vertical plane, and the slice angle of the batted balls for the three conditions. The mean flight distance for the opposite field was significantly shorter than that for the other fields. However, no significant dif-ferences were observed among the three hitting directions for the mean initial velocity and launch angle along the vertical plane. The mean slice angle was observed to be significantly different along the three hitting directions. Table 3 shows the average and standard deviation of the spin-axis angles of the batted balls for the three condi-tions. The angle ( 𝛼 ) was almost perpendicular in all the three directions. The mean angle ( 𝜃 ) for the same field and opposite field was the significantly different. The mean angle ( 𝜑 ) was significantly different for all three hitting directions. Table 4 shows the average and standard deviation of the spin rate and spin components for the three conditions. The mean spin rate for opposite-field hit-ting was significantly larger than that for the other fields. Moreover, significant differences were not observed for the Table 1 Comparison of the experimental conditions
Pitched ball velocity (m/s)
Impact height (m) Wind speed (m/s) Same-field 23.9 ± 1.7 0.84 ± 0.13 0.0 ± 0.7 Center-field 24.3 ± 1.3 0.87 ± 0.13 0.1 ± 0.6 Opposite-field 23.7 ± 1.4 0.81 ± 0.13 − 0.2 ± 0.6
ANOVA N.S N.S N.S
Table 2 Comparison of the kinematic parameters of batted ball
Flight Distance[m] Initial Velocity[m/s] Launch Angle[deg.] Slice Angle[deg.]
Same-field 88.8 ± 14.1 37.7 ± 3.5 33.2 ± 11.8 3.2 ± 5.1 Center-field 89.1 ± 17.1 38.2 ± 3.9 30.4 ± 12.3 -3.2 ± 3.4 Opposite-field 79.2 ± 6.9 36.5 ± 2.3 28.6 ± 10.4 -9.5 ± 2.5 ** ** ** * *
*, ** show statistically significant difference (p < 0.05, p < 0.01)
Table 3 Comparison of the angle of spin axis of batted ball
α[deg.] θ[deg. ] ϕ[deg. ]
Same-field 92.9 ± 14.7 15.4 ± 29.6 13.3 ± 27.0 Center-field 95.0 ± 6.0 6.1 ± 24.1 -17.2 ± 21.8 Opposite-field 98.7 ± 10.3 -1.6 ± 15.5 -46.8 ± 12.6 ** ** ** *
*, ** show statistically significant difference (p < 0.05, p < 0.01)
Table 4 Comparison of the spin rate and components of batted ball
Spin Rate[rps] Back Spin[rps] Spiral Spin[rps] Side Spin[rps] Same-field 35.8 ± 12.7 29.6 ± 17.0 7.9 ± 9.1 5.3 ± 11.1 Center-field 32.9 ± 14.2 29.1 ± 14.2 5.7 ± 5.3 -10.1 ± 9.1 Opposite-field 46.0 ± 11.2 31.1 ± 13.9 0.8 ± 6.3 -31.7 ± 6.4 ** ** ** * ** * **
mean back spin component for the three hitting directions. Although there were significant differences in the mean spiral spin component between the opposite field and the other fields, this component was comparatively small. The mean side spin component was significantly different for all the three hitting directions.
4 Discussion
Initially, to determine the influence of environmental con-ditions on the experiments along the three directions, a comparison of the pitched ball velocity, impact height, and wind velocity was performed. The results showed that there was no significant difference in these variables for the three directions. Therefore, the kinematic differences observed in the batted ball were not attributed to the environmental con-ditions during the experiments.
Although there were no significant differences in the ini-tial velocity and launch angle along the vertical plane of the batted balls for the three hitting directions, the flight distance for the opposite field was significantly shorter than that for the other fields. Therefore, this difference may be attributed to the ball spin.
As regards the ball spin, the angle of spin axis ( 𝛼 ), which
was defined as the angle between the spin-axis vector and the batted ball direction, was almost perpendicular. These results were almost identical to those observed in a tennis serve [9]. According to the research on baseball pitching [6], the angle of spin axis ( 𝛼 ) of the pitched balls was expected to be in
the range between 50° and 80°. The spin axis being nearly perpendicular is considered to be a characteristic of the hit-ting of balls in implement sports such as in tennis, or in the batting phase in baseball, and the batted balls experienced
a Magnus force that was larger than that experienced by the pitched balls.
To understand the magnitude and direction of Magnus force, we must focus on the spin rate and spin components. There were no significant differences observed for the back spin component among the three hitting directions. This result implies that the upward Magnus force was almost identical for all the three hitting directions. The spiral spin component for the opposite field was significantly smaller compared to that for the other fields. However, the spiral spin does not contribute to the Magnus effect, and the contribu-tion of this component was relatively limited when com-pared to the other components. Therefore, it is unlikely that the difference in the spiral spin contributes to the difference in the flight distance. As regards the side spin component, significant differences were observed for all the three hitting directions. As illustrated in Fig. 3, the balls hit toward the same field and opposite field rotated in a counterclockwise and clockwise direction around the Lz axis, respectively. This spin component was caused by the non-zero angle of incidence to the normal vector of the bat’s long axis in the horizontal plane. Although the mean value for the same-field hitting was positive, the mean values for the other fields were negative, and hence, comparisons were made using absolute values. The mean absolute values of the side spin compo-nents were 9.4 ± 7.7 rps, 11.0 ± 7.9 rps, and 31.7 ± 6.4 rps for the same field, center field, and opposite field, respec-tively. The absolute value of the side spin component for the opposite field was significantly greater. The side spin component could have affected the ball trajectory along the horizontal plane owing to the Magnus effect. Therefore, the Magnus force acting along the horizontal plane was esti-mated using the lift coefficient proposed by Sawicki et al. [2]. The mean absolute values of the Magnus force acting
Same-field Center-field Opposite-field
Gx Gy Slice angle (+) Slice angle (-) Initial Velocity Vector
Initial Velocity Vector Landing point
Landing point
along the horizontal plane were 0.36 ± 0.27 N, 0.37 ± 0.23 N, and 0.83 ± 0.19 N for the same field, center field, and oppo-site field, respectively. The Magnus force acting along the horizontal plane for the opposite field was significantly greater. Figure 4 illustrates the relationship between the Magnus force acting along the horizontal plane and slice angle, which confirms the effect of the Magnus force on the ball trajectory along the horizontal plane. Moreover, a significant correlation was observed between these vari-ables (r = 0.813, p < 0.01). The mean absolute values of the slice angle were 5.3° ± 2.9°, 4.1° ± 2.2°, and 9.5° ± 2.5° for same field, center field, and opposite field, respectively. The mean absolute value for opposite field was also significantly greater than that for the other fields. In summary, the balls batted toward the opposite field had a significant quantity of side spin components, and the ball trajectory in horizontal plane was largely influenced by the Magnus force. This can explain the shorter straight-line distance from the home plate to the ball landing point in the opposite field despite the distances measured along the curved path being thought to be similar among the three hitting directions.
To elucidate the relationship between the batted ball directions and the side spin component, the correlations between the two variables were investigated. The batted ball directions were defined as the angle between the initial velocity vector and Gy. In case the initial velocity vector was in the direction of the same field compared with that of Gy, the batted ball direction had positive values. Figure 5 shows the relationship between the batted ball directions
and the side spin components. A significant correlation was observed between these variables (r = 0.869, p < 0.01); moreover, the farther the batted balls were from the border between the same field and the center field, the greater was the side spin component. This implied that the balls batted toward the neighborhood of the foul line in the same field were also curved and flight distance tended to be shorter. Although the regression line should have passed through the origin according to Fig. 3, it did not. It was indicated that the side spin components were also affected by the other factors such as the movement of the bat during impact along with the non-zero angle of incident. First, let us take a look at the bat swing in the horizontal plane; the bat head rotates with the bat grip as an axis. Next, let us take a look at the three-dimensional bat swing; the bat head is lower than the bat grip during impact. Thus, the batters generally hit the lower and inner side of the ball in case of hitting a fly ball. Moreo-ver, the bat rotates in a counterclockwise direction around the bat’s long axis when viewed from the batter’s direction during impact [3]. These two rotations of the bat during impact might have made the ball spin in a clockwise direc-tion around Lz owing to the frictional force. For this reason, it was thought that the regression line did not pass through the origin. The results of this study show that the ball spin characteristics, especially the side spin component, are dif-ferent due to the batted ball directions. Moreover, the results indicate that the ball spin has an effect on the ball trajec-tory and flight distance. To hit a long ball along each direc-tion, especially along the opposite field or neighborhood of
y = 15.38x - 2.2615 -30 -15 0 15 30 -1 -0.5 0 0.5 1 Slice An gle [d eg.] Magnus Force [N] Same-field Center-field Opposite-field r=0.813 p<0.01 n=79
Fig. 4 Relationship between the magnitude of Magnus force in hori-zontal direction and the slice angle of the batted ball
y = 0.8031x - 14.423 -60 -30 0 30 60 -45 -30 -15 0 15 30 45 Side spin co mp one nt [r ps ]
Batted ball direction [deg.] Same-Field Center-field Opposite-field r=0.869 p<0.01 n=81
Fig. 5 Relationship between the batted ball direction in horizontal plane and the magnitude of side spin components
the foul line in the same field, the batters must give less side spin components, and instead must provide large back spin components along with high linear velocity to the ball. Therefore, in our future work, we intend to investigate the factors, swing or bat–ball impact, that determine the spin components of batted balls. However, it is difficult to reveal the factors responsible by analyzing the data acquired from hitting a live pitched ball, because a variety of factors would be complicated. Thus, it might be easier to interpret the data from hitting off a tee. In a similar study, the mechani-cal limb, whose movement can be controlled, was used to investigate the relationship between the impact of kicking a football and ball flight characteristics [11]. The mechanical batting machine, whose swing can be controlled, would also be able to solve this problem.
5 Conclusion
This study set out to examine the three-dimensional ball characteristics, including spin, when batted toward the same-field, center-field, and opposite-field directions, and to discuss the effect of these kinematics on the flight dis-tance of the ball. It was shown that the magnitude of the side spin component of the batted ball was different for differ-ent hitting directions. Moreover, the magnitude of the side spin components for the ball hit along the opposite field was greater than that for the other fields. Thus, the results indicated that the balls batted toward the opposite field expe-rienced a larger Magnus force along the horizontal direction. Moreover, the ball trajectories were relatively more curved. As a result, the flight distance for the opposite field was shorter than that for the other fields. This study indicated that it is important for batters to give the balls back spin
components instead of side spin component along with a high linear velocity to maximize the flight distance along various directions.
References
1. Nathan AM (2008) The effect of spin on the flight of a baseball. Am J Phys 76(2):119–124
2. Sawicki GS, Hubbard M, Stronge WJ (2003) How to hit home runs: optimum baseball bat swing parameters for maximum range trajectories. Am J Phys 71(11):1152–1162
3. Kidokoro S, Wakahara T, Yanai T (2011) Characteristics of swing affecting flight distance and kinetic energy of the ball immedi-ately after impact in baseball batting. Jpn J Biomech Sports Exerc 15(3):78–86 (in Japanese)
4. Kidokoro S, Yanai T (2015) An additional impact mechanism for hitting the ball toward the opposite field in baseball. Jpn J Phys Educ Health Sport Sci 60:103–115 (in Japanese)
5. McIntyre DR, Pfautsch EW (1982) A kinematic analysis of the baseball batting swings involved in opposite-field and same-field hitting. Res Q Exerc Sport 53(3):206–213
6. Jinji T, Sakurai S (2006) Direction of spin axis and spin rate of the pitched baseball. Sports Biomech 5(2):197–214
7. Nagami T, Morohoshi J, Higuchi T, Nakata H, Naito S, Kanosue K (2011) Spin on fastballs thrown by elite baseball pitchers. Med Sci Sports Exerc 43(12):2321–2327
8. Jinji T, Sakurai S, Hirano Y (2011) Factors determining the spin axis of a pitched fastball in baseball. J Sports Sci 29(7):761–767 9. Sakurai S, Reid M, Elliott B (2013) Ball spin in the tennis serve:
spin rate and axis of rotation. Sports Biomech 12(1):23–29 10. Winter DA (2009) Biomechanics and motor control of human
movement. In: Winter DA (ed) Three-dimensional kinematics and kinetics. Wiley, Hoboken, pp 176–199
11. Peacock JCA, Ball K (2017) The relationship between foot-ball impact and flight characteristics in punt kicking. Sports Eng 20(3):221–230