Electricity Generation Costs
2013
Contents
Introduction ... 4
How Levelised Costs are calculated ... 5
Definition of ‘Levelised Costs of Electricity Generation’ ... 5
Data Sources and Assumptions ... 7
Data Sources ... 7
Further Assumptions ... 10
Future Cost Projections ... 10
Load factors ... 11
Financing and Hurdle Rates ... 11
Changes from 2012 published estimates ... 12
Limitations of ‘Levelised Costs’ ... 13
Levelised Costs are uncertain ... 13
Levelised Costs are not Strike Prices ... 13
Timing ... 14
Sensitivities ... 14
Generation Cost Estimates at a 10% discount rate ... 16
Case 1: Projects starting in 2013, FOAK/ NOAK, 10% discount rate ... 16
Case 2: Projects starting in 2019, FOAK/ NOAK, 10% discount rate ... 19
Case 3: Commissioning in 2014, 2016, 2020, 2025, 2030, FOAK/ NOAK, 10% discount rate ... 21
DECC Electricity Market Modelling, Levelised Costs and Uncertainty ... 24
Case 4: Commissioning in 2014, 2016, 2020, 2025, 2030, FOAK/ NOAK, technology specific hurdle rates ... 25
Case 1: Projects starting in 2013, NOAK, 10% discount rate ... 27
Case 2: Projects starting in 2019, NOAK, 10% discount rate ... 30
Case 3: Commissioning in 2014, 2016, 2020, 2025, 2030, NOAK, 10% discount rate ... 33
Case 4: Commissioning in 2014, 2016, 2020, 2025, 2030, NOAK, tech specific hurdle rates ... 37
Annex 2: Data Sources Considered for Renewable Technologies ... 42
Future Offshore Wind Costs ... 45
Annex 3: Key Data and Assumptions ... 48
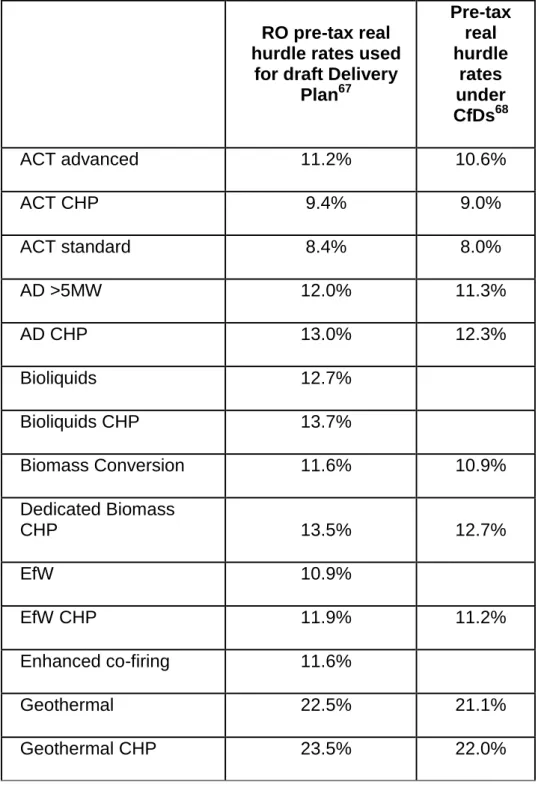
Hurdle Rates ... 48
Effective Tax Rates ... 51
Load factors for selected technologies ... 54
Project timings for selected technologies ... 55
OCGT costs used in draft Delivery Plan Modelling ... 56
Introduction
Electricity generation costs are a fundamental part of energy market analysis, and a good understanding of these costs is important when analysing and designing policy.
DECC regularly updates estimates of the costs and technical specifications for different generation technologies used in its analysis. Cost data is broken down into detailed expenditure per MW capacity or MWh generation for the full lifetime1 of a plant including planning costs, construction costs, operating costs and eventual decommissioning costs.
These detailed data are used by DECC to calculate a ‘levelised cost’ for each technology. A ‘levelised cost’ is the average cost over the lifetime of the plant per MWh of electricity generated. They reflect the cost of building, operating and decommissioning a generic plant for each technology. Potential revenue streams are not considered2.
There a number of reasons why strike prices for the Feed-in Tariff with Contracts for Difference (CfD) being introduced as part of Electricity Market Reform will be different to the estimates of levelised costs in this report. While the cost assumptions, summarised in this report, form an input to the calculation of strike prices, levelised costs are not the same as strike prices. Other inputs to strike prices include CfD contract terms, including length and risk allocation as well as revenue assumptions. For further details, please see ‘Limitations of Levelised Costs’ below. This report is structured as follows:
1) The first section details the methodology, data and assumptions used to generate the levelised cost estimates. This section also includes a discussion of some of the limitations of these estimates.
2) The second section presents selected ‘levelised cost’ estimates generated using DECC’s Levelised Cost Model and a standardised 10% hurdle rate for investors. 3) The final section discusses how cost information is used in DECC electricity market
modelling, illustrating some of the cost estimates at technology specific hurdle rates, and further uncertainties.
4) The report has several annexes showing more detail about the levelised cost calculation, additional estimates for technologies not included in the main report and details of some further scenarios and sensitivities considered.
It is important to note there is a large amount of uncertainty when estimating current and future costs of electricity generation. This report has attempted to capture some of this uncertainty by portraying ranges. However, not all sensitivities and sources of uncertainty are captured. All estimates are in 2012 real prices.
1
Including pre-development, construction, operation and de-commissioning costs
2
How Levelised Costs are calculated
Definition of ‘Levelised Costs of Electricity Generation’
The Levelised Cost of Electricity Generation is the discounted lifetime cost of ownership and use of a generation asset, converted into an equivalent unit of cost of generation in £/MWh. The levelised cost of a particular generation technology is the ratio of the total costs of a generic plant (including both capital and operating costs), to the total amount of electricity expected to be generated over the plant’s lifetime. Both are expressed in net present value terms. This means that future costs and outputs are discounted, when compared to costs and outputs today.
This is sometimes called a life cycle cost, which emphasises the “cradle to grave” aspect of the definition. The levelised cost estimates do not consider revenue streams available to generators (e.g. from sale of electricity or revenues from other sources), with the exception of heat revenues for CHP plant which are included so that the estimates reflect the cost of electricity generation only.
As the definition of levelised costs relates only to those costs accruing to the owner/operator of the generation asset, it does not cover wider costs that may in part fall to others, such as the full cost of system balancing and network investment, or air quality impacts.
Step 2: Sum the net present value of total expected costs for each year
NPV of Total
Costs =∑n total capex and opex costs(1 + discount rate) n n
n = timeperiod
Step 3: Sum the net present value of expected generation for each year
NPV of Electricity Generation
∑n net electricity generationn
(1 + discount rate) n
=
n = time period
Step 4: Divide total costs by net generation
Levelised Cost of Electricity Generation Estimate
NPV of Total Costs NPV of Electricity Generation
=
Step 1: Gather Plant Data and Assumptions Capex Costs: -Pre-development costs -Construction costs* -Infrastructure cost* (*adjusted over time for learning) Opex Costs: -Fixed opex* -Variable opex -Insurance -Connection costs
-Carbon transport and storage costs -Decommissioning fund costs -Heat revenues -Fuel Prices -Carbon Costs Expected Generation Data: -Capacity of plant -Expected Availability -Expected Efficiency -Expected Load Factor ( all assumed baseload)
For further information on how levelised costs are calculated and DECC’s Levelised Cost Model please refer to section 4.2 Mott MacDonald (2010)3.
3
Data Sources and Assumptions
Data Sources
The following data sources and assumptions were used to calculate the levelised costs estimates presented in this report. Table 1 shows the data source for each technology. Annex 2 provides further explanation on the data used to inform renewable electricity generation cost estimates.
The full list of capital costs and operating costs used in DECC electricity market modelling is shown at Annex 3. This Annex also lists hurdle rate and effective tax assumptions
Non – Renewable Technologies:
Fuel and decommissioning costs, carbon prices and hurdle rates were derived by DECC as described below under Further Assumptions. The rest of the underlying data on non-renewable technologies were provided by Parsons Brinckerhoff (PB). The underlying data and assumptions can be found in the PB (2013) report4.
Renewable Technologies:
Nine data sources for various renewable technologies were used and/or considered by DECC. These are:
1. Government Response to the Banding Review (GRBR) - data and evidence underpinning the ‘Government response to the consultation on proposals for the levels of banded support under the Renewables Obligation for the period 2013-17 and the Renewables Obligation Order 2012’ for renewable technologies5
.
2. Large scale ground mounted solar PV data (>5MW)6 - data and evidence on the costs and performance of large-scale solar PV underpinning ‘Government response to further
4 Unless referenced specifically, all documentation can be found on the ‘Energy generation cost projections’ page of the DECC website:
https://www.gov.uk/government/organisations/department-of-energy-climate-change/series/energy-generation-cost-projections
5
http://www.decc.gov.uk/assets/decc/11/consultation/ro-banding/5936-renewables-obligation-consultation-the-government.pdf. This is referred to as the ‘Government Response to the Banding Review (GRBR)’ throughout this
report. Please note that the data has been inflated from 2010 to 2012 prices and heat revenues have been updated to reflect DECC’s 2013 fuel and carbon prices when compared to those published as part of the Government Response to Banding Review.
6
The Draft Delivery plan analysis for Large scale solar PV is based on the cost and performance assumptions for large-scale ground mounted solar PV developed as part of the consultation on RO support rates for solar PV. These assumptions can be viewed at:
https://www.gov.uk/government/uploads/system/uploads/attachment_data/file/66516/7328-renewables-obligation-banding-review-for-the-perio.pdf.
consultations on solar PV support, biomass affordability and retaining the minimum calorific value requirement in the RO’7
3. Small-scale Feed in Tarff (FiTs) data (PV, wind, hydro and AD below 5MW): Data and evidence from Parsons Brinckerhoff (PB) (2012) published as part of the government response to Phase 2A and 2B comprehensive review of feed in tariffs89.
4. Onshore Wind Call for Evidence - Data received in response to DECC’s Onshore Wind Call for Evidence and published in June 201310
5. National Grid (NG) Call for Evidence - Data received as part of National Grid’s Call for Evidence11 (2013)
6. PB 2013 - a DECC commissioned report from Parsons Brinckerhoff (2013) on renewable technology costs12.
7. TNEI 2013 Offshore Wind Generation Cost Variations Review13 8. The Crown Estate Offshore wind cost reduction pathways study14. 9. Offshore Wind Cost Reduction Task Force Report June 201215.
Table 1 identifies the data sources used for each technology. A high-level description of the process undertaken and rationale for the data used for renewable technologies is included in Annex 2. 7 https://www.gov.uk/government/uploads/system/uploads/attachment_data/file/66516/7328-renewables-obligation-banding-review-for-the-perio.pdf 8 http://www.decc.gov.uk/assets/decc/11/meeting-energy-demand/renewable-energy/5381-solar-pv-cost-update.pdf. 9 http://www.decc.gov.uk/assets/decc/Consultations/fits-review/5900-update-of-nonpv-data-for-feed-in-tariff-.pdf 10 https://www.gov.uk/government/uploads/system/uploads/attachment_data/file/205423/onshore_wind_call_for_evid ence_response.pdf
11 Unless referenced specifically, all documentation can be found on the ‘Energy generation cost projections’ page of the DECC website:
https://www.gov.uk/government/organisations/department-of-energy-climate-change/series/energy-generation-cost-projections
12 Unless referenced specifically, all documentation can be found on the ‘Energy generation cost projections’ page of the DECC website:
https://www.gov.uk/government/organisations/department-of-energy-climate-change/series/energy-generation-cost-projections
13 Unless referenced specifically, all documentation can be found on the ‘Energy generation cost projections’ page of the DECC website:
https://www.gov.uk/government/organisations/department-of-energy-climate-change/series/energy-generation-cost-projections
14
http://www.thecrownestate.co.uk/media/305094/Offshore%20wind%20cost%20reduction%20pathways%20study.p df. This is referred to as the ‘Crown Estate Study’ throughout this report.
15
https://www.gov.uk/government/uploads/system/uploads/attachment_data/file/66776/5584-offshore-wind-cost-reduction-task-force-report.pdf. This is referred to as the ‘Offshore Wind CRTF report’ throughout this report.
Table 1: Data Sources for Individual Technologies
Non-Renewables Technologies: Data Source
CCGT with/without CHP PB 2013
OCGT PB 2013
Coal Plant with 300MW of CCS PB 2013 Gas and Coal with CCS PB 2013
Nuclear PB 2013
Renewable Technologies: Data Source
Onshore Wind Onshore Wind Call for Evidence
Offshore Wind GRBR, Crown Estate Study, Offshore Wind CRTF report
Biomass Conversion GRBR Dedicated biomass with/without CHP GRBR Cofiring conventional/Cofiring enhanced GRBR Co-firing standard CHP GRBR
Hydropower GRBR
Wave NG Call for Evidence
Tidal Stream – shallow GRBR (load factor updated in line with evidence from the NG Call for Evidence) Tidal Stream – deep GRBR
Tidal Range GRBR
AD power with/without CHP GRBR
ACT CHP GRBR
Energy from Waste w/without CHP GRBR
Landfill gas GRBR Sewage gas GRBR ACT advanced GRBR ACT standard GRBR Bioliquids with/without CHP GRBR Geothermal with/without CHP GRBR
Large scale solar PV (>5MW)16 Large scale solar PV data
AD 0-5MW FiTs data
Onshore wind under 5MW FiTs data Solar PV under 5MW FiTs data Hydro under 5MW FiTs data Biomass with CCS PB 2013
The cost assumptions presented in this report are those used in National Grid’s modelling for the draft Delivery Plan, with the exception of OCGT costs. National Grid’s modelling used draft
16
PB (2013) OCGT cost assumptions whereas those presented here are the final costs presented in PB (2013). Further details are given in Annex 3.
Further Assumptions
The following assumptions have also been used:
Fuel and Carbon Prices: DECC’s 2013 projected fossil fuel prices and Carbon Price Support17
Technology Specific Hurdle Rates: Where used, technology specific hurdle rates are the same as those used in DECC’s Dynamic Dispatch Model. These are presented in Annex 3. All estimates are in 2012 real prices.
Future Cost Projections
There is significant uncertainty about how the costs of technologies will evolve over time. In general, estimates of the capital and operating costs of different electricity generating technologies in the future are driven by expectations and assumptions of technology specific learning rates and by global and UK deployment levels.
The data sources referenced above provide detailed information about learning and deployment scenarios used in our analysis. IEA18 projections are the main source for global deployment and learning rates for most technologies. However, for ACT, marine and renewable technologies under 5MW learning rates are driven by scenarios of technical potential for UK deployment19. A further exception is offshore wind where costs follow the cost reduction profiles used in the draft Delivery Plan analysis (July 2013) (please see Annex 2 for further details).
All estimates presented are for established plants - called Nth of a Kind (NOAK), unless stated otherwise. The exceptions are estimates for Carbon Capture and Storage CCS and Nuclear, which are shown on both a First of a Kind (‘FOAK’) and Nth of a Kind (‘NOAK’) basis. For these technologies with no commercial experience in the UK, FOAK was defined as the first plant
17
Please note that the Carbon Price Floor does not apply in Northern Ireland.
18
Estimates for renewable technologies are based on IEA Bluemap (see ARUP 2011 for details), and non-renewable technologies are IEA Energy Technology Perspectives (2012). Future deployment scenarios are not based on year-on-year data and therefore there is uncertainty about how costs will evolve overtime. This approach is intended to capture trends in cost reduction rather than precise year-on-year changes.
19
within the UK, not including demonstration projects. For these technologies, FOAK costs assume experience has been gained from international and demonstration projects2021.
All levelised costs for marine technologies (wave and tidal stream) in this report illustrate the costs of commercial projects commissioning from the early 2020s onwards. Where technology-specific hurdle rates are used in this report, these are the hurdle rates for commercial projects.
Load factors
Levelised costs are sensitive to assumptions on load factor. For non-renewable technologies, with the exception of OCGTs, plants are assumed to operate at baseload with high load
factors. OCGTs are assumed to operate as peaking plants (operating at times of higher system stress). The load factors for wind and marine technologies reflect that they operate as
intermittent electricity generation technologies. Assumed load factors for key technologies are listed in Annex 3.
Financing and Hurdle Rates
The levelised cost measure does not explicitly include the financing costs attached to new generating stations22. In most cases, this report includes estimates using a standard 10% discount rate across all technologies, in line with the ‘tradition’ used in reports produced by other organisations. These estimates allow estimates to be viewed as neutral in financing and risk terms when comparison is made across technologies.
In practice, financing costs of individual projects will vary depending on a range of factors, including financing type, project developer, conditions in financial markets, maturity of technology, and risk and political factors. We have included some levelised cost estimates using technology specific hurdle rates in the section ‘DECC Electricity Market Modelling’. Further details on the technology specific hurdle rates used can be found in Annex 3.
20
All estimates for Carbon Capture and Storage (CCS) presented in this document are intended to illustrate the cost of CCS for a commercial plant. In practice CCS would have be successfully demonstrated first. We have not included estimates for the costs for initial CCS demonstration projects.
21
The period in which the cost moves from FOAK to NOAK is entirely dependent on the assumed learning rate and the assumed build rate. For nuclear we have assumed a move to NOAK for plants starting development in 2018 onwards. In practice this may occur later than we have assumed. The movement between FOAK and NOAK for CCS is even more uncertain and as such we have only used FOAK estimates in this report.
22
While financing costs are included implicitly through the choice of discount rate used to produce the levelised cost this is an approximation.
Changes from 2012 published estimates
There have been several changes in data and assumptions to selected technologies when comparing against previously published estimates23. These are summarised below:
Data: The source data has been updated for the following technologies: CCGTs, all CCS technologies, Nuclear, Onshore Wind > 5MW, Wave, Tidal Stream Shallow24 and large scale ground-mounted solar PV. Data sources are listed in Table 1.
Hurdle Rates: where technology specific hurdle rates have been used, these have been updated to match those used in the draft Delivery Plan analysis (July 2013). Further details can be found in Annex 3.
Fuel Prices: DECC 2013 fossil fuel price projections have been used. Biomass conversion fuel price assumptions have been updated to reflect 100% imports25.
Heat Revenues: heat revenues for all CHP technologies have been updated to reflect the latest published fuel and carbon price assumptions.
The following changes have also been made:
The load factor for onshore wind > 5MW has been updated to reflect a UK average load factor of 28% from 1998 to 2011 in line with DECC’S electricity market modelling
assumptions. Please note that the capital and operating costs, connection and insurance charges are in line with those published in response to the Onshore Wind Call for
Evidence26.
Learning profiles have been updated for offshore wind to match the cost reduction profiles in the draft Delivery Plan analysis. Please see Annex 3 for more details.
Load factors for biomass conversion, sewage gas and landfill have been updated to match the load factor assumption of a conversion plant in the draft Delivery Plan analysis (July 2013)27
Learning profiles have been updated for wave to reflect its stage of development and potential for cost reductions.
Estimate for coal-fired power station now include 300MW of CCS in line with Government policy which states that new coal-fired power stations are required to be constructed with a full CCS chain fitted on at least 300MW (net) of their generating capacity.
23
https://www.gov.uk/government/uploads/system/uploads/attachment_data/file/65713/6883-electricity-generation-costs.pdf
24
Load factor only
25
This adds £1/MWh to the input fuel price used in the Government Response to the RO Banding Review.
26
https://www.gov.uk/government/uploads/system/uploads/attachment_data/file/205423/onshore_wind_call_for_ev idence_response.pdf
27
A net load factor of 65% was used for biomass conversion, 44% for sewage gas and 57% for landfill. Please note that this is a generic estimate, and load factors by plant are expected to vary.
Please note Annex 3 contains further information about cost data and assumptions for all technologies.
Limitations of ‘Levelised Costs’
Levelised Costs are uncertain
Levelised cost estimates are highly sensitive to the underlying data and assumptions including those on capital costs, fuel and carbon costs, operating costs, operating profile, load factor and discount rates. Future levelised cost estimates are significantly driven by assumptions of global and UK deployment and assumed learning rates.
This report captures some of these uncertainties through ranges presented around key estimates. A range of costs is presented for capex and fuel, depending on the estimates. However, not all uncertainties are captured in these ranges and estimates should be viewed in this context. It is often more appropriate to consider a range of costs rather than point estimates.
It should also be noted that levelised costs are generic, rather than site specific.
Levelised Costs are not Strike Prices
The levelised cost estimates in this report do not provide an indication of potential future strike prices for a particular technology or plant under the Feed-in Tariff with Contracts for Difference (CfD) being introduced as part of Electricity Market Reform.
A CfD stabilises revenues for a particular generating station at a fixed price level known as the ‘strike price’ over a specified term. Generation costs data, summarised here in the form of levelised costs, are one input into setting strike prices. Other inputs may include:
Revenue assumptions;
Other costs not included in DECC’s definition of levelised cost;
CfD contract terms including length and risk allocation;
Financing costs (reflected in the levelised costs calculated at technology-specific hurdle rates but not in those calculated at 10% discount rate); and
Wider policy considerations.
The generation costs data used here will, in some cases, be different from that used as part of the strike price setting process. This is particularly where project-specific cost discovery processes are undertaken. These reflect a site-specific, highly granular assessment of costs, whereas the estimates here are more high-level and generic.
For all these reasons, the levelised costs presented here may be quite different from the strike prices that are set for CfDs.
Timing
When looking at levelised cost estimates it is important to consider how they have been reported in terms of project timing and what sensitivities (if any) are included. These are discussed in more detail below.
Levelised cost estimates can be reported for different milestones associated with a project including ‘Project Start’, ‘Financial Close’ and ‘Commissioning’. These are illustrated in Chart 1 below for an illustrative technology which has a 5 year pre-development period and a 5 year construction period.
For instance, if the levelised cost of this technology was £50/MWh for a project starting in 2012, this would be the same as saying £50/MWh for a project reaching financial close in 2017, or £50/MWh for a project commissioning in 2022. This is illustrated in Chart 1 below.
Pre-development and construction timings will vary by technology and therefore estimates reported for ‘project start’ or ‘financial close’28
for different technologies may not be commissioning in the same year as each other. Central estimates for pre-development and construction timings are presented for key technologies in Annex 3.
Chart 1: Illustrative Timings
Sensitivities
Levelised cost estimates are highly sensitive to the underlying data and assumptions used including those on capital costs, fuel prices, carbon costs, operating costs, load factor and discount rates. As such it is often more appropriate to consider a range of cost estimates rather than point estimates.
28
In order to illustrate some of these sensitivities, ranges of estimates have been shown. The key sensitivities explored are:
High and Low capital costs (including pre-development)
Unless specified, all ‘high’ and ‘low’ estimates in this report incorporate ‘high’ and ‘low’ capital costs including ‘high’ and ‘low’ pre-development costs.
It should also be noted that the ranges across different capital cost estimates for technologies have different interpretations between the renewable and non-renewable technologies. For renewable technologies, the ranges represent variability across potential sites, i.e. the range of levelised costs represents a supply curve of potential projects at different costs within the technology in a given year. For non-renewable technologies, the capital cost range represents uncertainty for any given project.
High and Low fuel and capital costs
For some technologies (e.g CCGT, CCS, biomass and waste technologies), fuel costs are a major driver of the levelised cost. In order to demonstrate this some sensitivities which explore uncertainty over both fuel costs and capex costs are provided. These are shown in charts like Chart 2 below. In these cases the thick blocks represent ‘high/low’ sensitivities around capex (including pre-development) costs and the thin lines represent ‘high/low’ sensitivities around fuel prices on top of the uncertainty around capex (including pre-development) costs.
Chart 2: Illustrative Sensitivities
0 20 40 60 80 100 120 Technology 1 Technology 2 £ /MW h
Generation Cost Estimates at a 10%
discount rate
This section summarises the analysis of the levelised cost of electricity generation at a 10% discount rate.
Comparing levelised cost estimates across technologies at a 10% discount rate allows estimates to be viewed as neutral in terms of financing and risk. This approach is in line with the ‘tradition’ used in reports produced by other organisations. As noted above, these estimates do not reflect differentials in financing costs between technologies. Where flexible technologies such as CCGTs operate at lower load factors, their levelised costs will be higher than those presented here.
This section focuses primarily on the main technologies likely to be deployed in the UK over the next decade and a half29. A full set of estimates for those renewable and CCS technologies not covered in the main report can be found in Annex 1
Levelised cost estimates for all cases have been calculated using the DECC Levelised Cost Model. The following ‘cases’ are considered in this section of the report:
Case No.
1 Projects Starting in 2013
All at 10% discount rate. Technologies are mixture of FOAK
and NOAK 2 Projects Starting in 2019
3 Projects Commissioning in 2014, 2016, 2020, 2025, 2030
Case 1: Projects starting in 2013, FOAK/ NOAK, 10% discount rate30
Case 1 shows the levelised costs for projects starting pre-development in 2013. A 10%
discount rate has been applied. Chart 3 shows the breakdown of central cost estimates, while Chart 4 shows the sensitivities of these estimates to capital costs31, and to capital and fuel costs. As noted above, the range of capital costs for renewable technologies represents site/project variability, whereas the range of capital costs for non-renewable technologies represents uncertainty for any given site/project.
The ranges for renewable technologies generally show a large range of variability across different sites/projects, whilst the ranges for non-renewable technologies show there is a large
29
Please note for carbon capture and storage we have illustrated three of the types of fossil fuel plant and the three main types of capture process in the main report rather than illustrate which types we expect most deployment to come from.
30
Please note these estimates should be viewed in the context of the sensitivities and uncertainties highlighted in the text of this report.
31
amount of uncertainty over these costs for any given project, without necessarily illustrating all the uncertainty as discussed in preceding sections.
It should also be noted that all the estimates for non-renewable technologies reflect generic cost data from PB (2013) and do not reflect site-specific considerations which may become apparent through detailed cost discovery process for strike-price setting. The estimates at a 10% discount rate also do not reflect financing costs. Furthermore, as explained above, these levelised costs should not be seen as a guide to potential strike prices.
The figures used in these charts can be found in Tables 2 and 3. The load factor assumptions used to calculate these levelised cost assumptions are summarised in Annex 332.
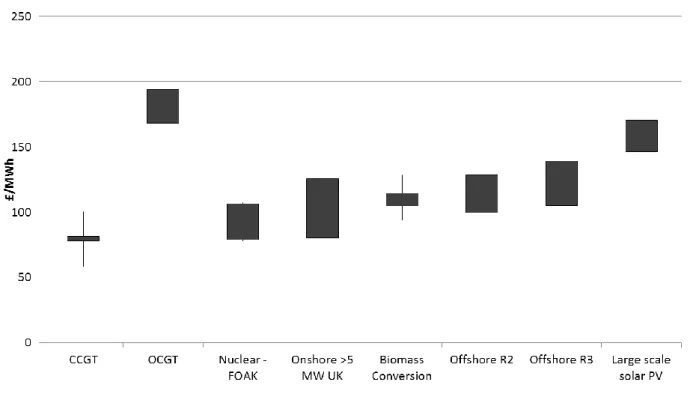
Chart 3: Levelised Cost Estimates for Projects Starting in 2013, 10% discount rate
32
OCGT levelised costs have been calculated at a low load factor to reflect the fact that it tends to operate as a peaking plant. This low load factor results in a higher levelised cost for OCGT.
Chart 4: Levelised Cost Estimates for Projects Starting in 2013, 10% discount rate, sensitivities33
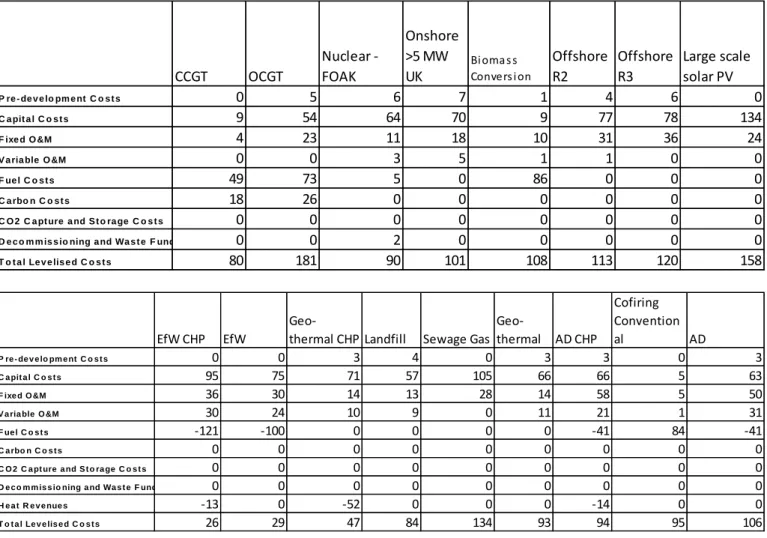
Table 2: Levelised Cost Estimates for Projects Starting in 2013, 10% discount rate, £/MWh
CCGT OCGT Nuclear - FOAK Onshore >5 MW UK Bi oma s s Convers i on Offshore R2 Offshore R3 Large scale solar PV P re - de v e lo pm e nt C o s t s 0 5 6 7 1 4 6 0 C a pit a l C o s t s 9 54 64 70 9 77 78 134 F ixe d O &M 4 23 11 18 10 31 36 24
V a ria ble O &M 0 0 3 5 1 1 0 0
F ue l C o s t s 49 73 5 0 86 0 0 0 C a rbo n C o s t s 18 26 0 0 0 0 0 0 C O 2 C a pt ure a nd S t o ra ge C o s t s 0 0 0 0 0 0 0 0 D e c o m m is s io ning a nd Wa s t e F und 0 0 2 0 0 0 0 0 T o t a l Le v e lis e d C o s t s 80 181 90 101 108 113 120 158
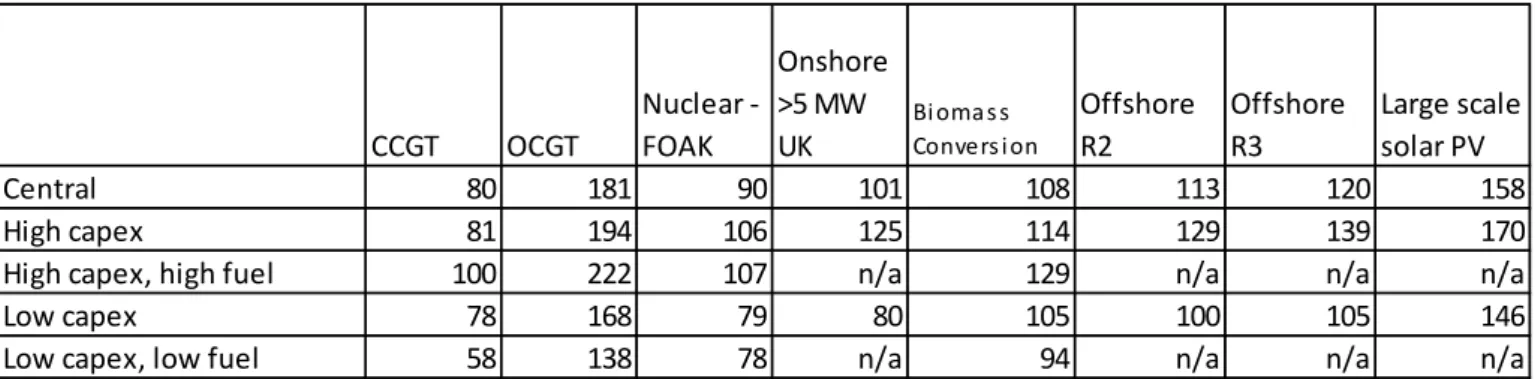
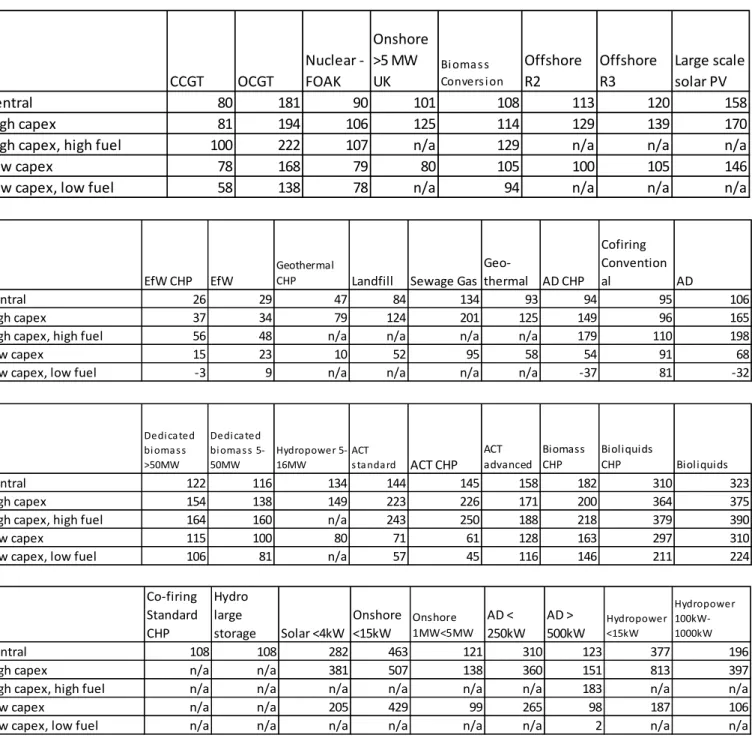
Table 3: Levelised Cost Estimates for Projects Starting in 2013, 10% discount rate, sensitivities (£/MWh) CCGT OCGT Nuclear - FOAK Onshore >5 MW UK Bi oma s s Convers i on Offshore R2 Offshore R3 Large scale solar PV Central 80 181 90 101 108 113 120 158 High capex 81 194 106 125 114 129 139 170
High capex, high fuel 100 222 107 n/a 129 n/a n/a n/a
Low capex 78 168 79 80 105 100 105 146
Low capex, low fuel 58 138 78 n/a 94 n/a n/a n/a
Case 2: Projects starting in 2019, FOAK/ NOAK, 10% discount rate34
Case 2 shows the levelised costs for projects starting pre-development in 2019. A 10%
discount rate has been applied. Chart 5 shows the breakdown of central cost estimates, while Chart 6 shows the sensitivities of these estimates to capital costs35, and to capital and fuel costs.
As noted above, the range of capital costs for renewable technologies represents site/project variability, whereas the range of capital costs for non-renewable technologies represents uncertainty for any given site/project.
The ranges for renewable technologies generally show a large range of variability across different sites/projects, whilst the ranges for non-renewable technologies show there is a large amount of uncertainty over these costs for any given project, without necessarily illustrating all the uncertainty as discussed in preceding sections.
It should also be noted that all the estimates for non-renewable technologies reflect generic cost data from PB (2013) and do not reflect site-specific considerations which may become apparent through detailed cost discovery process for strike-price setting. The estimates at a 10% discount rate also do not reflect financing costs. Furthermore, as explained on above, these levelised costs should not be seen as a guide to potential strike prices.
The figures used in these charts can be found in Tables 4 and 5. The load factor assumptions used to calculate these levelised cost assumptions are summarised in Annex 336.
34
Please note these estimates should be viewed in the context of the sensitivities and uncertainties highlighted in the text of this report.
35
Including pre-development
36
OCGT levelised costs have been calculated at a low load factor to reflect the fact that it tends to operate as a peaking plant. This low load factor results in a higher levelised cost for OCGT.
Chart 5: Levelised Cost Estimates for Projects Starting in 2019, 10% discount rate
Chart 6: Levelised Cost Estimates for Projects Starting in 2019, 10% discount rate, sensitivities37
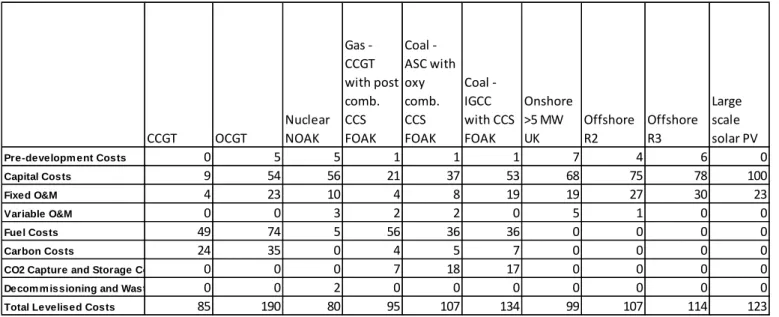
Table 4: Levelised Cost Estimates for Projects Starting in 2019, 10% discount rate, £/MWh CCGT OCGT Nuclear NOAK Gas - CCGT with post comb. CCS FOAK Coal - ASC with oxy comb. CCS FOAK Coal - IGCC with CCS FOAK Onshore >5 MW UK Offshore R2 Offshore R3 Large scale solar PV
Pre-developm ent Costs 0 5 5 1 1 1 7 4 6 0
Capital Costs 9 54 56 21 37 53 68 75 78 100
Fixed O&M 4 23 10 4 8 19 19 27 30 23
Variable O&M 0 0 3 2 2 0 5 1 0 0
Fuel Costs 49 74 5 56 36 36 0 0 0 0
Carbon Costs 24 35 0 4 5 7 0 0 0 0
CO2 Capture and Storage Costs 0 0 0 7 18 17 0 0 0 0
Decom m issioning and Waste Fund 0 0 2 0 0 0 0 0 0 0
Total Levelised Costs 85 190 80 95 107 134 99 107 114 123
Table 5: Levelised Cost Estimates for Projects Starting in 2019, 10% discount rate, sensitivities (£/MWh) CCGT OCGT Nuclear NOAK Gas - CCGT with post comb. CCS FOAK Coal - ASC with oxy comb. CCS FOAK Coal - IGCC with CCS FOAK Onshore >5 MW UK Offs hore R2 Offs hore R3 Large scale solar PV Central 85 190 80 95 107 134 99 107 114 123 High capex 87 205 93 105 132 172 123 122 134 132
High capex, high fuel 107 235 94 128 143 183 n/a n/a n/a n/a
Low capex 84 176 71 87 88 104 79 94 99 115
Low capex, low fuel 64 146 70 64 80 96 n/a n/a n/a n/a
Case 3: Commissioning in 2014, 2016, 2020, 2025, 2030, FOAK/ NOAK, 10%
discount rate38
In order to allow the comparison of the costs across different energy technologies
commissioning, or starting operation, in the same year Case 3 illustrates the levelised costs for projects commissioning in 2014, 2016, 2020, 2025 and 2030. A 10% discount rate has been applied. ‘High’ and ‘Low’ estimates represent sensitivities around capex costs only.
As noted above, the range of capital costs for renewable technologies represents site/project variability, whereas the range of capital costs for non-renewable technologies represents uncertainty for any given site/project. The estimates at a 10% discount rate also do not reflect
38
Please note these estimates should be viewed in the context of the sensitivities and uncertainties highlighted in the text of this report.
financing costs. Furthermore, as explained above, these levelised costs should not be seen as a guide to potential strike prices.
The ranges for renewable technologies generally show a large range of variability across different sites/projects, whilst the ranges for non-renewable technologies show there is a large amount of uncertainty over these costs for any given project, without necessarily illustrating all the uncertainty as discussed in preceding sections.
It should also be noted that all the estimates for non-renewable technologies reflect generic cost data from PB (2013) and do not reflect site-specific considerations which may become apparent through detailed cost discovery process for strike-price setting.
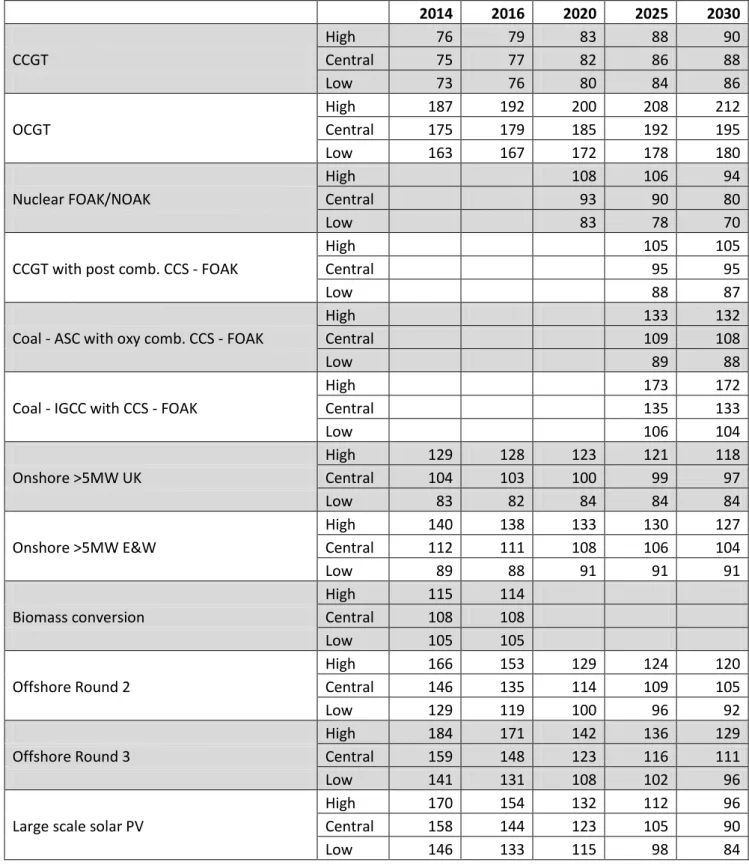
Table 6: Levelised Cost Estimates for Projects Commissioning in 2014, 2016, 2020, 2025 and 2030, 10% discount rate, £/MWh, highs and lows reflect high and low capital cost estimates
2014 2016 2020 2025 2030 High 76 79 83 88 90 CCGT Central 75 77 82 86 88 Low 73 76 80 84 86 High 187 192 200 208 212 OCGT Central 175 179 185 192 195 Low 163 167 172 178 180 High 108 106 94
Nuclear FOAK/NOAK Central 93 90 80
Low 83 78 70
High 105 105
CCGT with post comb. CCS - FOAK Central 95 95
Low 88 87
High 133 132
Coal - ASC with oxy comb. CCS - FOAK Central 109 108
Low 89 88
High 173 172
Coal - IGCC with CCS - FOAK Central 135 133
Low 106 104
High 129 128 123 121 118
Onshore >5MW UK Central 104 103 100 99 97
Low 83 82 84 84 84
High 140 138 133 130 127
Onshore >5MW E&W Central 112 111 108 106 104
Low 89 88 91 91 91
High 115 114
Biomass conversion Central 108 108
Low 105 105
High 166 153 129 124 120
Offshore Round 2 Central 146 135 114 109 105
Low 129 119 100 96 92
High 184 171 142 136 129
Offshore Round 3 Central 159 148 123 116 111
Low 141 131 108 102 96
High 170 154 132 112 96
Large scale solar PV Central 158 144 123 105 90
DECC Electricity Market Modelling,
Levelised Costs and Uncertainty
The estimates outlined in the above sections are intended to provide a high-level view on the costs of different generating technologies.
In practice, DECC’s electricity market modelling, including modelling for the Updated Energy & Emissions Projections and DECC’s Dynamic Dispatch Model (DDM), does not use ‘levelised cost estimates’ per se. Instead it models private investment decisions, at the financial close for a project, using the same Capex and Opex assumptions incorporated in the levelised cost estimates reported above; assumptions on investors’ foresight over fossil fuel, carbon and wholesale electricity prices; and the financial incentives from policies e.g. the RO or CfDs.
In order to model the investment decision, the internal rate of return of a potential plant is compared to a technology specific hurdle rate. The technology specific hurdle rates reflect different financing costs for different technologies and the estimated impact of policy interventions (e.g. Electricity Market Reform) on these costs.
This section shows illustrative levelised cost estimates using technology-specific ‘hurdle’ rates39, in line with those used in DECC electricity market modelling40.
These estimates at technology-specific hurdle rates reflect differentials in financing costs between technologies. Where flexible technologies such as CCGT operate at lower load factors, their levelised costs will be higher than those presented here.
39
Please note that hurdle rates are themselves uncertain and likely to vary between projects and financing structures/providers.
40
Table showing the hurdle rates used can be found in Annex 2. Please note that while we have aligned this methodology as far as possible with the Dynamic Dispatch Model (DDM) modelling there are some differences including that heat revenues for CHP technologies are modelled endogenously in the DDM but we have applied an exogenous profile..
Case 4: Commissioning in 2014, 2016, 2020, 2025, 2030, FOAK/ NOAK,
technology specific hurdle rates41
As noted above, the range of capital costs for renewable technologies represents site/project variability, whereas the range of capital costs for non-renewable technologies represents uncertainty for any given site/project.
The ranges for renewable technologies generally show a large range of variability across different sites/projects, whilst the ranges for non-renewable technologies show there is a large amount of uncertainty over these costs for any given project, without necessarily illustrating all the uncertainty as discussed in preceding sections.
Furthermore, as explained above, these levelised costs should not be seen as a guide to potential strike prices. It should be noted that all the estimates for non-renewable technologies reflect generic cost data from PB (2013) and do not reflect site-specific considerations which may become apparent through detailed cost discovery process for strike-price setting.
Table 7: Levelised Cost Estimates for Projects Commissioning in 2014, 2016, 2020, 2025 and 2030, technology specific hurdle rates, £/MWh, highs and lows reflect high and low capital cost estimates 2014 2016 2020 2025 2030 High 75 78 82 86 88 CCGT Central 74 77 81 84 86 Low 73 75 79 83 85 High 175 179 186 194 197 OCGT Central 165 169 175 181 184 Low 155 159 164 170 172 High 102 101 89
Nuclear FOAK/NOAK Central 89 86 77
Low 79 75 67
High 118 118
CCGT with post comb. CCS - FOAK Central 105 104
Low 94 93
High 159 157
Coal - ASC with oxy comb. CCS - FOAK Central 125 123
Low 97 95
High 209 206
Coal - IGCC with CCS - FOAK Central 156 154
Low 116 114
41
Please note these estimates should be viewed in the context of the sensitivities and uncertainties highlighted in the text of this report.
2014 2016 2020 2025 2030
High 115 110 108 106 104
Onshore >5MW UK Central 93 90 88 86 85
Low 75 72 71 70 69
High 124 119 116 114 112
Onshore >5MW E&W Central 100 96 94 93 91
Low 81 78 76 75 74
High 117 115
Biomass conversion Central 110 109
Low 106 105
High 168 149 126 121 117
Offshore Round 2 Central 148 132 111 106 102
Low 131 116 98 93 90
High 208 186 154 148 141
Offshore Round 3 Central 179 160 133 126 120
Low 157 141 116 110 104
High 131 116 100 86 74
Large scale solar PV Central 122 108 94 80 70
Low 114 101 87 75 66
Further key uncertainties accounted for in DECC’s electricity market modelling
Load factors
For non-renewable technologies, with the exception of OCGT, plants are assumed to operate at baseload with high load factors. OCGT is assumed to operate as a peaking plant. The load factors for some renewable technologies reflect that they operate as intermittent electricity generation technologies. Load factors for key technologies are listed in Annex 3
It should be noted that in DECC’s electricity market modelling, it is not only OCGT but also other flexible technologies such as CCGT which may operate at lower load factors than baseload. Where this is the case, the levelised costs will be higher than those presented above.
Carbon price
The carbon price assumed in the levelised costs presented is at the level of the Carbon Price Floor, which is assumed to stay flat in real terms beyond 2030 at £76/t in 2012 prices. An alternative carbon price scenario, considered in DECC’s electricity market modelling, assumes that up to 2030 the Carbon Price Floor gives the level of the carbon price, but that after 2030 a global carbon market emerges under the auspices of a global deal on climate change action, leading to a rising global traded carbon market price after 2030 as cheaper
abatement options are used up.42 Use of this second carbon price scenario would increase levelised costs for fossil fuel technologies.
Annex 1: Additional Estimates for
Renewable and CCS Technologies
Case 1: Projects starting in 2013, NOAK, 10% discount rate43
Table 8: Central Levelised Cost Estimates for Projects Starting in 2013, 10% discount rate, £/MWh CCGT OCGT Nuclear - FOAK Onshore >5 MW UK Bi oma s s Convers i on Offshore R2 Offshore R3 Large scale solar PV P re - de v e lo pm e nt C o s t s 0 5 6 7 1 4 6 0 C a pit a l C o s t s 9 54 64 70 9 77 78 134 F ixe d O &M 4 23 11 18 10 31 36 24
V a ria ble O &M 0 0 3 5 1 1 0 0
F ue l C o s t s 49 73 5 0 86 0 0 0 C a rbo n C o s t s 18 26 0 0 0 0 0 0 C O 2 C a pt ure a nd S t o ra ge C o s t s 0 0 0 0 0 0 0 0 D e c o m m is s io ning a nd Wa s t e F und 0 0 2 0 0 0 0 0 T o t a l Le v e lis e d C o s t s 80 181 90 101 108 113 120 158 EfW CHP EfW
Geo-thermal CHP Landfill Sewage Gas Geo-thermal AD CHP Cofiring Convention al AD P re - de v e lo pm e nt C o s t s 0 0 3 4 0 3 3 0 3 C a pit a l C o s t s 95 75 71 57 105 66 66 5 63 F ixe d O &M 36 30 14 13 28 14 58 5 50
V a ria ble O &M 30 24 10 9 0 11 21 1 31
F ue l C o s t s -121 -100 0 0 0 0 -41 84 -41 C a rbo n C o s t s 0 0 0 0 0 0 0 0 0 C O 2 C a pt ure a nd S t o ra ge C o s t s 0 0 0 0 0 0 0 0 0 D e c o m m is s io ning a nd Wa s t e F und 0 0 0 0 0 0 0 0 0 H e a t R e v e nue s -13 0 -52 0 0 0 -14 0 0 T o t a l Le v e lis e d C o s t s 26 29 47 84 134 93 94 95 106 42
The carbon price values for this scenario are sourced from modelling by DECC using the GLOCAF model. They are also used as the Government’s carbon price values for policy appraisal purposes. See the appraisal guidance for further details at: https://www.gov.uk/government/policies/using-evidence-and-analysis-to-inform-energy-and-climate-change-policies/supporting-pages/policy-appraisal
43
Please note these estimates should be viewed in the context of the sensitivities and uncertainties highlighted in the text of this report
Dedicated biomass >50MW Dedicated biomass 5-50MW Hydropower 5-16MW ACT standard ACT CHP ACT advanced Biomass CHP Bioliquids CHP Bioliquids P re - de v e lo pm e nt C o s t s 1 2 2 7 2 8 0 5 5 C a pit a l C o s t s 37 52 112 83 100 103 63 21 20 F ixe d O &M 14 16 14 58 66 58 24 22 22
V a ria ble O &M 4 5 6 24 24 13 9 6 6
F ue l C o s t s 65 41 0 -27 -31 -23 119 270 270 C a rbo n C o s t s 0 0 0 0 0 0 0 0 0 C O 2 C a pt ure a nd S t o ra ge C o s t s 0 0 0 0 0 0 0 0 0 D e c o m m is s io ning a nd Wa s t e F und 0 0 0 0 0 0 0 0 0 H e a t R e v e nue s 0 0 0 0 -15 0 -33 -14 0 T o t a l Le v e lis e d C o s t s 122 116 134 144 145 158 182 310 323 Co-firing Standard CHP Hydro large storage Solar<4kW Onshore <15kW Onshore 1MW<5MW AD < 250kW AD > 500kW Hydropower <15kW Hydropower 100kW-1000kW P re - de v e lo pm e nt C o s t s 0 2 0 0 0 0 0 0 0 C a pit a l C o s t s 62 92 253 414 107 134 75 341 162 F ixe d O &M 32 8 28 49 14 176 102 36 34
V a ria ble O &M 2 6 0 0 0 0 0 0 0
F ue l C o s t s 63 0 0 0 0 0 -54 0 0 C a rbo n C o s t s 0 0 0 0 0 0 0 0 0 C O 2 C a pt ure a nd S t o ra ge C o s t s 0 0 0 0 0 0 0 0 0 D e c o m m is s io ning a nd Wa s t e F und 0 0 0 0 0 0 0 0 0 H e a t R e v e nue s -52 0 0 0 0 0 0 0 0 T o t a l Le v e lis e d C o s t s 108 108 282 463 121 310 123 377 196
Table 9: Levelised Cost Estimates for Projects Starting in 2013, 10% discount rate, £/MWh, highs and lows reflect high and low capital and fuel cost estimates
CCGT OCGT Nuclear - FOAK Onshore >5 MW UK Bi oma s s Convers i on Offshore R2 Offshore R3 Large scale solar PV Central 80 181 90 101 108 113 120 158 High capex 81 194 106 125 114 129 139 170
High capex, high fuel 100 222 107 n/a 129 n/a n/a n/a
Low capex 78 168 79 80 105 100 105 146
Low capex, low fuel 58 138 78 n/a 94 n/a n/a n/a
EfW CHP EfW
Geothermal
CHP Landfill Sewage Gas Geo-thermal AD CHP Cofiring Convention al AD Central 26 29 47 84 134 93 94 95 106 High capex 37 34 79 124 201 125 149 96 165
High capex, high fuel 56 48 n/a n/a n/a n/a 179 110 198
Low capex 15 23 10 52 95 58 54 91 68
Low capex, low fuel -3 9 n/a n/a n/a n/a -37 81 -32
Dedi ca ted bi oma s s >50MW Dedi ca ted bi oma s s 5-50MW Hydropower 5-16MW ACT s ta nda rd ACT CHP ACT advanced Biomass CHP Bioliquids CHP Bioliquids Central 122 116 134 144 145 158 182 310 323 High capex 154 138 149 223 226 171 200 364 375
High capex, high fuel 164 160 n/a 243 250 188 218 379 390
Low capex 115 100 80 71 61 128 163 297 310
Low capex, low fuel 106 81 n/a 57 45 116 146 211 224
Co-firing Standard CHP Hydro large storage Solar <4kW Onshore <15kW Onshore 1MW<5MW AD < 250kW AD > 500kW Hydropower <15kW Hydropower 100kW-1000kW Central 108 108 282 463 121 310 123 377 196
High capex n/a n/a 381 507 138 360 151 813 397
High capex, high fuel n/a n/a n/a n/a n/a n/a 183 n/a n/a
Low capex n/a n/a 205 429 99 265 98 187 106
Case 2: Projects starting in 2019, NOAK, 10% discount rate44
Table 10: Central Levelised Cost Estimates for Projects Starting in 2019, 10% discount rate, £/MWh CCGT OCGT Nuclear NOAK Gas - CCGT with post comb. CCS FOAK Coal - ASC with oxy comb. CCS FOAK Coal - IGCC with CCS FOAK Onshore >5 MW UK Offshore R2 Offshore R3 Large scale solar PV
Pre-developm ent Costs 0 5 5 1 1 1 7 4 6 0
Capital Costs 9 54 56 21 37 53 68 75 78 100
Fixed O&M 4 23 10 4 8 19 19 27 30 23
Variable O&M 0 0 3 2 2 0 5 1 0 0
Fuel Costs 49 74 5 56 36 36 0 0 0 0
Carbon Costs 24 35 0 4 5 7 0 0 0 0
CO2 Capture and Storage Costs 0 0 0 7 18 17 0 0 0 0
Decom m issioning and Waste Fund 0 0 2 0 0 0 0 0 0 0
Total Levelised Costs 85 190 80 95 107 134 99 107 114 123
Gas - CCGT retro post comb. CCS FOAK Gas - CCGT with pre comb. CCS FOAK Gas - CCGT with oxy comb. CCS FOAK Coal - ASC FGD with 300MW CCS FOAK Coal - ASC with post comb. CCS FOAK Coal - ASC with ammonia FOAK Coal - ASC ret post comb. CCS FOAK Coal - IGCC with 300MW CCS FOAK Coal - IGCC with retro CCS FOAK Biomass CCS FOAK
Pre-developm ent Costs 1 1 1 1 1 1 1 1 1 0
Capital Costs 15 24 24 31 44 42 27 49 27 63
Fixed O&M 4 5 13 7 10 10 10 16 19 12
Variable O&M 2 1 1 1 2 0 2 0 0 4
Fuel Costs 56 69 71 29 36 40 37 32 38 89
Carbon Costs 4 4 3 47 8 10 8 42 10 0
CO2 Capture and Storage Costs 7 9 9 3 17 18 17 6 18 0
Decom m issioning and Waste Fund 0 0 0 0 0 0 0 0 0 0
Total Levelised Costs 88 113 122 119 118 121 102 146 112 168
44
Please note these estimates should be viewed in the context of the sensitivities and uncertainties highlighted in the text of this report
EfW CHP EfW Geo-thermal CHP Landfill Sewage Gas Geother mal AD CHP Cofiring con-ventional AD Pre-development Costs 0 0 3 4 0 3 3 0 3 Capital Costs 93 73 70 57 102 64 63 5 60 Fixed O&M 36 30 14 14 28 14 59 5 50 Variable O&M 30 24 10 9 0 11 21 1 31 Fuel Costs -121 -100 0 0 0 0 0 84 0 Carbon Costs 0 0 0 0 0 0 0 0 0
CO2 Capture and Storage Costs 0 0 0 0 0 0 0 0 0
Decommissioning and Waste Fund 0 0 0 0 0 0 0 0 0
Heat Revenues -13 0 -53 0 0 0 -14 0 0
Total Levelised Costs 25 28 45 83 130 92 132 94 145
Dedi ca ted bi oma s s >50MW Dedi ca ted bi oma s s 5-50MW Hydro-power 5-16MW ACT standard ACT CHP ACT advanced Biomass CHP Bi ol i qui ds CHP Bi ol i qui ds Pre-development Costs 1 2 2 7 2 8 0 5 5 Capital Costs 37 51 123 80 96 100 62 21 20 Fixed O&M 14 16 14 54 63 54 23 21 21 Variable O&M 4 5 6 22 22 12 9 5 5 Fuel Costs 65 41 0 -24 -28 -21 119 263 263 Carbon Costs 0 0 0 0 0 0 0 0 0
CO2 Capture and Storage Costs 0 0 0 0 0 0 0 0 0
Decommissioning and Waste Fund 0 0 0 0 0 0 0 0 0
Heat Revenues 0 0 0 0 -15 0 -33 -14 0
Total Levelised Costs 121 115 146 139 140 153 180 302 315
Co-firing Standard CHP Hydro_La rgeSTORE Solar<4k W Onshore <15kW Onshore 1MW<5M W AD < 250kW AD > 500kW Hydropo wer <15kW Hydropow er 100kW-1000kW Pre-development Costs 0 2 0 0 0 0 0 0 0 Capital Costs 62 104 197 414 107 134 75 341 162 Fixed O&M 32 9 28 49 13 176 102 36 34 Variable O&M 2 6 0 0 0 0 0 0 0 Fuel Costs 63 0 0 0 0 0 0 0 0 Carbon Costs 0 0 0 0 0 0 0 0 0
CO2 Capture and Storage Costs 0 0 0 0 0 0 0 0 0
Decommissioning and Waste Fund 0 0 0 0 0 0 0 0 0
Heat Revenues -53 0 0 0 0 0 0 0 0
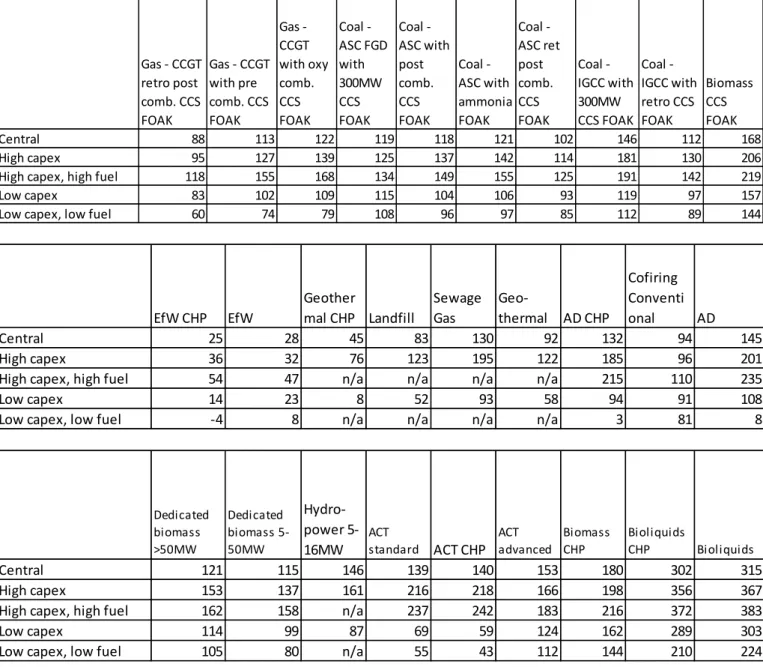
Table 11: Levelised Cost Estimates for Projects Starting in 2019, 10% discount rate, highs and lows reflect high and low capital cost estimates, £/MWh
CCGT OCGT Nuclear NOAK Gas - CCGT with post comb. CCS FOAK Coal - ASC with oxy comb. CCS FOAK Coal - IGCC with CCS FOAK Onshore >5 MW UK Offs hore R2 Offs hore R3 Large scale solar PV Central 85 190 80 95 107 134 99 107 114 123 High capex 87 205 93 105 132 172 123 122 134 132
High capex, high fuel 107 235 94 128 143 183 n/a n/a n/a n/a
Low capex 84 176 71 87 88 104 79 94 99 115
Low capex, low fuel 64 146 70 64 80 96 n/a n/a n/a n/a
Gas - CCGT retro post comb. CCS FOAK Gas - CCGT with pre comb. CCS FOAK Gas - CCGT with oxy comb. CCS FOAK Coal - ASC FGD with 300MW CCS FOAK Coal - ASC with post comb. CCS FOAK Coal - ASC with ammonia FOAK Coal - ASC ret post comb. CCS FOAK Coal - IGCC with 300MW CCS FOAK Coal - IGCC with retro CCS FOAK Biomass CCS FOAK Central 88 113 122 119 118 121 102 146 112 168 High capex 95 127 139 125 137 142 114 181 130 206
High capex, high fuel 118 155 168 134 149 155 125 191 142 219
Low capex 83 102 109 115 104 106 93 119 97 157
Low capex, low fuel 60 74 79 108 96 97 85 112 89 144
EfW CHP EfW Geother mal CHP Landfill Sewage Gas Geo-thermal AD CHP Cofiring Conventi onal AD Central 25 28 45 83 130 92 132 94 145 High capex 36 32 76 123 195 122 185 96 201
High capex, high fuel 54 47 n/a n/a n/a n/a 215 110 235
Low capex 14 23 8 52 93 58 94 91 108
Low capex, low fuel -4 8 n/a n/a n/a n/a 3 81 8
Dedicated biomass >50MW Dedicated biomass 5-50MW Hydro-power 5-16MW ACT standard ACT CHP ACT advanced Biomass CHP Bioliquids CHP Bioliquids Central 121 115 146 139 140 153 180 302 315 High capex 153 137 161 216 218 166 198 356 367
High capex, high fuel 162 158 n/a 237 242 183 216 372 383
Low capex 114 99 87 69 59 124 162 289 303
Co-firing Standard CHP Hydro large storage Solar <4kW Onshore <15kW Onshore 1MW<5M W AD < 250kW AD > 500kW Hydropo wer <15kW Hydropow er 100kW-1000kW Central 107 120 224 463 120 310 177 377 196
High capex n/a n/a 354 535 145 371 212 860 419
High capex, high fuel n/a n/a n/a n/a n/a n/a 244 n/a n/a
Low capex n/a n/a 160 424 98 263 151 185 105
Low capex, low fuel n/a n/a n/a n/a n/a n/a 55 n/a n/a
Case 3: Commissioning in 2014, 2016, 2020, 2025, 2030, NOAK, 10% discount
rate45
Table 12: Levelised Cost Estimates for Projects Commissioning in 2014, 2016, 2020, 2025, 2030, 10% discount rate, £/MWh, highs and lows reflect high and low capital cost estimates
2014 2016 2020 2025 2030 High 76 79 83 88 90 CCGT Central 75 77 82 86 88 Low 73 76 80 84 86 High 83 83 90 96 99 CCGT CHP Central 81 81 87 93 96 Low 79 79 85 91 94 High 187 192 200 208 212 OCGT Central 175 179 185 192 195 Low 163 167 172 178 180 High 108 106 94
Nuclear - FOAK/NOAK Central 93 90 80
Low 83 78 70
High 105 105
CCGT with post comb. CCS - FOAK Central 95 95
Low 88 87
High 95 95
CCGT retro post comb. CCS - FOAK Central 89 88
Low 83 83
High 127 127
CCGT with pre comb. CCS - FOAK Central 113 113
Low 102 102
High 139 139
CCGT with oxy comb. CCS - FOAK Central 123 122
Low 110 109
45
Please note these estimates should be viewed in the context of the sensitivities and uncertainties highlighted in the text of this report
2014 2016 2020 2025 2030
High 121 125
Coal - ASC FGD with 300MW CCS - FOAK Central 116 119
Low 112 115
High 138 137
Coal - ASC with post comb. CCS - FOAK Central 120 118
Low 105 104
High 145 142
Coal ASC with ammonia - FOAK Central 124 121
Low 108 106
High 115 113
Coal - ASC ret post comb. CCS - FOAK Central 103 102
Low 94 92
High 133 132
Coal - ASC with oxy comb. CCS - FOAK Central 109 108
Low 89 88
High 177 181
Coal - IGCC with 300MW CCS - FOAK Central 143 146
Low 117 119
High 173 172
Coal - IGCC with CCS - FOAK Central 135 133
Low 106 104
High 139 139
Coal - IGCC with retro CCS - FOAK Central 123 122
Low 110 109
High 206 206
Biomass with CCS Central 168 168
Low 157 157
High 157 156 153 152 151
Dedicated biomass >50MW Central 123 123 122 121 120
Low 117 116 116 116 116
High 141 140 137 136 135
Dedicated biomass 5-50MW Central 118 118 116 115 115
Low 102 101 101 101 101
High 140 138 133 130 127
Onshore >5MW E&W Central 112 111 108 106 104
Low 89 88 91 91 91
High 129 128 123 121 118
Onshore >5MW UK Central 104 103 100 99 97
Low 83 82 84 84 84
High 166 153 129 124 120
Offshore Round 2 Central 146 135 114 109 105
Low 129 119 100 96 92
High 184 171 142 136 129
Offshore Round 3 Central 159 148 123 116 111
2014 2016 2020 2025 2030
High 115 114
Biomass conversion Central 108 108
Low 105 105
High 170 154 132 112 96
Large scale solar PV Central 158 144 123 105 90
Low 146 133 115 98 84 High 40 38 37 36 35 EfW CHP Central 28 27 26 25 25 Low 17 16 15 14 14 High 35 34 33 32 32 EfW Central 30 29 28 28 27 Low 25 24 23 23 22 High 109 93 79 76 73 Geothermal CHP Central 69 57 47 45 43 Low 21 15 9 8 7 High 125 124 123 123 123 Landfill Central 84 84 84 83 83 Low 52 52 52 52 52 High 203 201 196 194 192
Sewage gas Central 135 134 131 130 128
Low 96 95 93 92 92 High 150 137 124 122 120 Geothermal Central 111 102 93 92 90 Low 67 63 58 58 57 High 135 161 186 184 183 AD CHP Central 80 106 132 131 131 Low 40 66 94 94 93 High 97 96 96 96 96
Cofiring conventional Central 95 95 94 94 94
Low 91 91 91 91 91
High 151 177 202 200 199
AD Central 92 118 145 144 144
Low 54 81 108 108 108
Cofiring standard CHP Central 108 107 107 107 107
Hydro large storage Central 106 110 117 122 122
High 142 146 156 161 162
Hydropower 5-16MW Central 127 132 141 146 146
Low 77 79 84 87 87
High 228 225 218 214 209
ACT standard Central 147 145 141 138 133
Low 73 72 70 68 64
High 233 228 221 216 210
ACT CHP Central 149 146 141 138 133
2014 2016 2020 2025 2030
High 175 172 168 164 160
ACT advanced Central 162 159 155 152 147
Low 131 129 125 122 118 High 205 203 200 198 197 Biomass CHP Central 186 184 182 180 179 Low 167 166 163 162 161 High 378 373 367 366 365 Bioliquids Central 325 321 316 314 314 Low 313 308 303 302 301 High 367 362 357 355 353 Bioliquids CHP Central 312 308 303 301 299 Low 299 295 290 288 287 High 259 201 Wave Central 246 191 Low 215 167 High 207 185
Tidal stream shallow Central 190 171
Low 155 140
High 165 144
Tidal stream deep Central 148 129
Low 131 115
High 283 283
Tidal range Central 230 230
Low 173 173 High 381 373 354 330 310 Solar<4kW Central 282 258 224 198 181 Low 205 183 160 144 134 High 507 517 535 560 586 Onshore <15kW Central 463 463 463 463 463 Low 429 429 424 414 405 High 138 141 145 152 159 Onshore 1MW<5MW Central 121 121 120 120 120 Low 99 99 98 95 93 High 360 364 371 381 392 AD < 250kW Central 310 310 310 310 310 Low 265 265 263 261 259 High 151 180 212 218 223 AD > 500kW Central 123 150 177 177 177 Low 98 125 151 150 149 High 813 828 860 902 947 Hydropower <15kW Central 377 377 377 377 377 Low 187 187 185 181 177 High 397 404 419 439 459 Hydropower 100kW-1000kW Central 196 196 196 196 196 Low 106 106 105 103 101
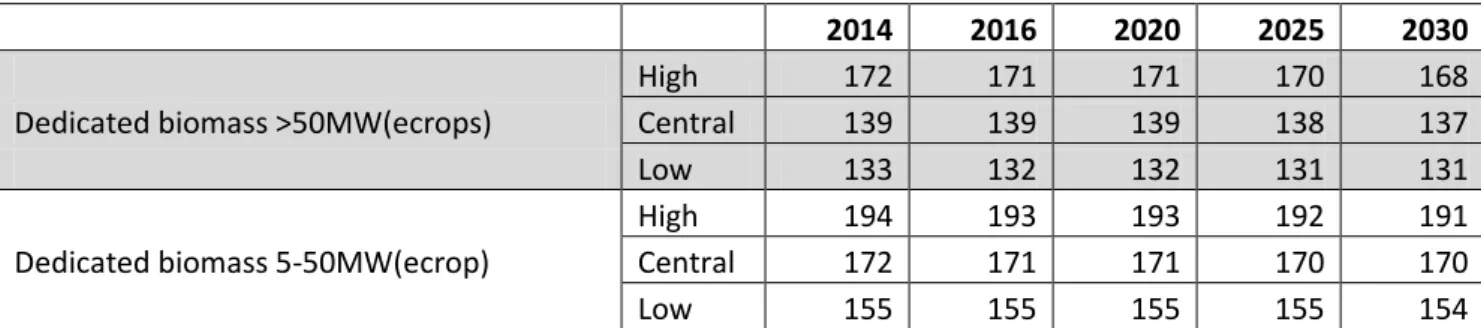
2014 2016 2020 2025 2030
High 172 171 171 170 168
Dedicated biomass >50MW(ecrops) Central 139 139 139 138 137
Low 133 132 132 131 131
High 194 193 193 192 191
Dedicated biomass 5-50MW(ecrop) Central 172 171 171 170 170
Low 155 155 155 155 154
Case 4: Commissioning in 2014, 2016, 2020, 2025, 2030, NOAK, tech specific
hurdle rates46
Table 13: Levelised Cost Estimates for Projects Commissioning in 2014, 2016, 2020, 2025, 2030, technology specific hurdle rate, £/MWh, highs and lows reflect high and low capital cost estimates 2014 2016 2020 2025 2030 High 75 78 82 86 88 CCGT Central 74 77 81 84 86 Low 73 75 79 83 85 High 85 85 91 97 100 CCGT CHP Central 83 83 89 95 97 Low 82 82 88 93 96 High 175 179 186 194 197 OCGT Central 165 169 175 181 184 Low 155 159 164 170 172 High 102 101 89
Nuclear - FOAK/NOAK Central 89 86 77
Low 79 75 67
High 118 118
CCGT with post comb. CCS - FOAK Central 105 104
Low 94 93
High 103 102
CCGT retro post comb. CCS - FOAK Central 94 93
Low 87 86
High 143 143
CCGT with pre comb. CCS - FOAK Central 124 123
Low 109 107
High 158 156
CCGT with oxy comb. CCS - FOAK Central 134 133
Low 115 114
46
Please note these estimates should be viewed in the context of the sensitivities and uncertainties highlighted in the text of this report
2014 2016 2020 2025 2030
High 134 139
Coal - ASC FGD with 300MW CCS - FOAK Central 127 131
Low 122 125
High 162 161
Coal - ASC with post comb. CCS - FOAK Central 137 135
Low 117 115
High 170 165
Coal ASC with ammonia - FOAK Central 141 137
Low 120 116
High 126 124
Coal - ASC ret post comb. CCS - FOAK Central 111 109
Low 99 97
High 159 157
Coal - ASC with oxy comb. CCS - FOAK Central 125 123
Low 97 95
High 207 213
Coal - IGCC with 300MW CCS - FOAK Central 161 165
Low 125 128
High 209 206
Coal - IGCC with CCS - FOAK Central 156 154
Low 116 114
High 139 139
Coal - IGCC with retro CCS - FOAK Central 123 122
Low 110 109
High 239 239
Biomass with CCS Central 188 188
Low 174 174
High 173 172 170 168 167
Dedicated biomass >50MW Central 132 132 130 129 129
Low 124 123 122 121 121
High 157 156 154 153 152
Dedicated biomass 5-50MW Central 130 129 127 127 126
Low 110 109 108 107 106
High 124 119 116 114 112
Onshore >5MW E&W Central 100 96 94 93 91
Low 81 78 76 75 74
High 115 110 108 106 104
Onshore >5MW UK Central 93 90 88 86 85
Low 75 72 71 70 69
High 168 149 126 121 117
Offshore Round 2 Central 148 132 111 106 102
Low 131 116 98 93 90
High 208 186 154 148 141
Offshore Round 3 Central 179 160 133 126 120
2014 2016 2020 2025 2030
High 117 115
Biomass conversion Central 110 109
Low 106 105
High 131 116 100 86 74
Large scale solar PV Central 122 108 94 80 70
Low 114 101 87 75 66 High 58 50 48 47 46 EfW CHP Central 45 37 36 35 34 Low 32 25 23 23 22 High 41 41 39 39 38 EfW Central 36 35 34 34 33 Low 30 30 29 28 28 High 312 248 214 208 201 Geothermal CHP Central 206 161 136 132 127 Low 82 59 46 43 41 High 116 114 113 113 113 Landfill Central 79 78 77 77 77 Low 50 49 49 49 49 High 195 186 182 180 178
Sewage gas Central 130 125 122 121 120
Low 93 89 88 87 86 High 337 282 253 248 243 Geothermal Central 239 200 181 177 173 Low 130 111 101 99 98 High 154 177 205 203 202 AD CHP Central 86 113 142 141 141 Low 37 67 98 97 97 High 97 97 97 97 97
Cofiring conventional Central 95 95 95 95 95
Low 91 91 91 91 91
High 164 191 219 217 216
AD Central 96 125 154 153 152
Low 53 82 112 112 112
Co-firing standard CHP Central 118 117 116 116 116
Hydro large storage Central 80 83 89 92 92
High 107 107 113 117 117
Hydropower 5-16MW Central 97 97 103 107 107
Low 61 61 64 66 66
High 207 198 193 189 183
ACT standard Central 136 131 128 124 120
Low 71 69 68 65 62
High 224 214 207 202 196
ACT CHP Central 144 138 134 130 125