Unlocking
Clients
UmitG. Gurun
Universityof TexasatDallas and NBER
Noah Stoffman IndianaUniversity
Scott E. Yonker CornellUniversity
March 1,2018
Abstract
Weinvestigatetheimpactofnon-competeagreements(NCAs)onthemarketforfinancialadvice usingvariationinfirm-leveladoptionoftheBrokerProtocol,whichrelaxedtheenforcementof NCAsforadvisersofadoptingfirms. Whilewefindevidenceconsistentwithrelaxedenforcement “unlocking”clients,we alsodocumentanumberofunintendedconsequences inboththelabor andproductmarkets. Clientfees,adviserturnover andmisconductallincreaseafterfirmsjoin theprotocoland thepropensityoffirmsto fireadviserswhoengageinmisconductisreduced. Ourfindingsquestion whetherthecostsof“unlocking”clientsoutweighthebenefits.
We thank Jawad Addoum, Brian Broughman, David Ng, Andrew Karolyi, and Merih Sevilir as well as seminar participants at Cornell and Indiana for helpful comments.
The mobility of human capital is critical for allocating skilled labor to its most efficient use
(Becker, 1962). Non-compete agreements (NCAs), which legally constrain employee mobility, provide
an important impediment to such reallocation, although they can also provide an incentive for firms
to invest in their employees’ human capital (Rubin and Shedd, 1981).1 Extant research on the
importance of non-compete agreements has tended to focus on workers in technology-intensive or
high-skilled industries, but with the sharp increase in the prevalence of NCAs in recent years,2 it
has become increasingly important to understand how they affect labor mobility in the broader
economy.
In this paper, we study the importance of restrictions on mobility of financial advisers. Most
investors in the U.S. access financial markets through financial advisers. Unsophisticated investors,
in particular, trust their advisers to help them take on risk that they otherwise wouldn’t have the
confidence to handle (Gennaioli, Shleifer, and Vishny, 2015). This financial advisory industry is
large, with over 14,000 investment advisory firms employing more than 760,000 financial advisors
and managing over $28 trillion of assets in our data.
Because of the central importance of trust in the investment advisory industry, the relationships
between clients and advisers are key to understanding individual investor decisions and welfare, as
well as investment flows. Without any restrictions on mobility, advisers can move to a competing
firm and likely take many of their clients with them, essentially walking out the door with the firm’s
assets.
In order to protect these “relationship assets,” (Lavetti, Simon, and White, 2017) an adviser’s
departure had historically often been followed by litigation by their former employer. This changed
in 2004, when, in an effort to limit the expense of this litigation, three major brokerage firms,
1We refer to non-compete agreements, but include also non-solicit agreements, which allow employees to move to
competing firms, but not to solicit former clients to move their business. A non-compete agreement is also known as a non-compete clause, or a covenant not to compete.
2Starr, Prescott, and Bishara (2017) find that 18% of employees report being bound by non-compete agreements—
Citigroup, Merrill Lynch, and UBS, agreed to the Protocol for Broker Recruiting (hereafter, “the
protocol”). The protocol established a set of rules for the departure of advisers, allowing an adviser
to take client lists and contact information to their new employer without fear of legal action.
Importantly, this shield from litigation applies only when both the old and new employers are
signatories to the protocol.3
While the protocol began as an agreement among large broker-dealer firms, it quickly came to
be dominated by much smaller investment advisory firms. Both types of firms provide investment
advice, but their business models and incentive structures are quite different. As we show below,
broker-dealers earn most of their revenue from trading-related commissions while also providing
investment advice. Investment advisory firms, in contrast, provide only investment advice and earn
a fees based on the amount of assets they manage. In addition, each type of firm operates in a
different regulatory environment: investment advisers have a fiduciary duty to their clients and are
regulated by the SEC under the Investment Advisers Act of 1940; broker-dealers are regulated by
FINRA, a self-regulatory organization, and subject to a less-stringent suitability requirement when
recommending securities to customers.4
By the end of our sample period, in December 2016, just 29% of protocol member firms are
broker-dealers. It is likely that the initial signatories to the agreement did not anticipate that so
much of the growth in the protocol membership would come from small investment advisory firms.
Indeed, many of the firms that have joined the protocol were launched by advisers working at one
of the larger brokerage firms who wanted to simply take their clients to their own company. At
least one enterprising law firm has encouraged advisers to do just that, with considerable success.5
Perhaps related to these unanticipated consequences, Morgan Stanley, one of the largest signatories
3
The complete text of the agreement is available athttp://www.thebrokerprotocol.com/index.php/authors/ read-the-protocol.
4
Throughout the paper, we use the term “advisers” to refer to both registered investment advisers and advisers employed at broker-dealers (who may or may not be registered investment advisers).
5The Law Offices of Patrick J. Burns, Jr., P.C., advertises that its firm “works with breakaway brokers establishing
to the protocol, announced that it was leaving the agreement in October 2017. It was soon followed
by UBS, one of the protocol’s founding firms.
Complete records of all firms joining and leaving the protocol are publicly available. We combine
these with detailed information on all registered brokers and advisers obtained from the SEC and
FINRA. Together, these data provide us with a very rich setting in which to study the impact
of loosening constraints on adviser mobility. In sharp contrast to previous research about labor
mobility and non-compete agreements, we have time-series observations of employment records for
the entire industry: every financial adviser at every firm, regardless of whether their employer is a
member of the protocol.
Our tests exploit within-firm time series variation in membership in the protocol and the
enforcement of NCAs. We also take advantage of a key feature of the protocol: that only the
members of the protocol benefit from its protection, so the enforceability of an NCA varies for a
particular adviser at each point in time depending on which firms are currently in the protocol.
This allows us to test, for example, whether NCAs influence which firms advisers move to, and
whether they take more of their clients’ assets with them when they move. We carefully construct a
staggered panel of firm entry into, and exit from, the protocol to enable this analysis.
We begin by looking at firm-level adviser turnover, which we define as the average of the number
of advisers joining or leaving a firm scaled by its number of advisers in the previous year. We find
that firms that join the protocol see a large temporary increase in turnover of almost 20 percent in
the first two years of membership, but that subsequently turnover reverts to pre-membership levels.
This initial increase appears to be driven largely by firms joining the protocol in order to poach
advisers and grow. But as a firm remains in the protocol, we begin to see a substitution effect,
whereby its turnover with other protocol firms increases but decreases with non-protocol member
economically large effect on labor mobility, consistent with results from previous literature that
have primarily relied on survey data.
The decision to join the protocol is made at the firm level, so firm-level turnover is endogenous
to the decision to join the protocol. This is much less true, however, of an individual adviser’s
decision to leave her employer if it joins the protocol, particularly at large firms. We therefore turn
next to an analysis of adviser-level data, where a causal relation is more plausible. Here we find no
evidence that an adviser’s overall probability of leaving her firm changes. Rather, advisers become
more likely to leave for another protocol firm, and less likely to leave to a non-protocol firm by an
exactly offsetting amount. That is, those advisers who do move simply become significantly more
likely to move to a firm that is a member of the protocol. The magnitude of this effect is quite large,
with an increase of more than 50% in the probability of moving to another protocol firm. This too
provides evidence on the importance of non-compete agreements in restricting mobility.
The substitution in turnover that we observe to protocol firms from non-protocol firms suggests
that although total turnover does not increase, the average cost of turnover likely does, as advisers
can more easily take clients with them when they move to other protocol firms. To test this, we
examine the effects on a firm’s assets under management (AUM) when an adviser leaves. While
our data do not allow us to directly observe each adviser’s book of business, we do observe each
firm’s AUM each year for firms that are registered as investment advisers with the SEC, and are
therefore able to tie changes in this to adviser movements. We first show that changes in AUM are
positively related to contemporaneous adviser turnover, and that this relationship is stronger for
turnover in advisers within, rather than outside, the financial industry, which is consistent with
advisers taking clients with them. Decomposing this result by whether advisers move to another
protocol firm or not, we find significantly larger effects in the former. In particular, when an adviser
leaves one protocol firm to join another, she brings a client list worth almost half the average client
A recent literature has found that rates of adviser misconduct are persistent within firms,
suggesting some advisory firms do a poor job of disciplining misconduct (Egan, Matvos, and Seru,
2017), and that misconduct can be contagious among co-workers (Dimmock, Gerken, and Graham,
2017). In light of our evidence that advisers take more clients with them if their firm has joined
the protocol, it is natural to ask whether protocol firms become laxer with respect to punishing
misconduct in order to prevent a further decline in assets. To explore this, we test whether protocol
firms become more reluctant to fire advisers after advisers have engaged in bad behavior. For the full
sample of advisers, we find that engaging in misconduct increases the probability of being fired by
about by about 19%, but that becoming a member of the protocol effectively undoes this discipline
effect. These findings lend support to the notion that firms are more reluctant to fire employees
once they enter the protocol for fear of losing the assets of those advisers’ clients.
Next, we test whether this reduced discipline leads advisers to engage in misconduct more
frequently. In firm-level regressions we find that joining the broker protocol is associated with an
increase misconduct rates by 65%. Tests at the adviser-level, however, provide no evidence that
firms joining the broker protocol leads advisers to engage in misconduct. Of course, the firm-level
regressions give greater weight to misconduct at smaller firms, and turnover is likely even more
costly for precisely these firms, so we might imagine that it is in these firms that the disciplining of
bad behavior is reduced the most.
Finally, we investigate whether firms pass on to their customers the increased cost of adviser
turnover by increasing fees. We analyze a small sample of brokerage firms for which we have detailed
information about the breakdown of revenue. We find that firms increase their fees by 15% after
joining the protocol. Such a fee increase is consistent with firms recouping the costs associated with
attracting new advisers. This finding highlights a potential dark-side of the increased labor market
Our paper contributes to a literature spanning finance, economics, and law that examines
the implications of human capital mobility in the economy. Jeffers (2017) finds that increasing
the enforceability of NCAs leads to lower levels of entrepreneurship but increased investment at
knowledge-intensive firms. Earlier work by Stuart and Sorenson (2003), Marx, Strumsky, and
Fleming (2009) and Marx (2011) also find that NCAs impede mobility, although Barnett and
Sichelman (2016) dispute the interpretation that this leads to a reduction of innovation or other
economic harm. More generally, research has found that the mobility of human capital is related
to growth of both industries and geographic regions (Rosegrant and Lampe, 1992; Saxenian, 1996;
Franco and Filson, 2000; Klepper, 2002; Klepper and Sleeper, 2005)). Moreover, human capital
mobility can help firms change their strategic direction (Boeker, 1997) or organizational structure
(Klette, Møen, and Griliches, 2000). Our study contributes to this literature by providing evidence on
the effects of non-compete agreements in the financial industry, which is known to have a significant
wage premium (Oyer (2008); Goldin and Katz (2008); Philippon and Reshef (2012)).
Our paper also contributes to a growing literature exploring incentives and behavior in the
financial advisory industry. Financial advisors play an influential role in determining their clients’
asset choices (Mullainathan, Noeth, and Schoar, 2012; Foerster, Linnainmaa, Melzer, and Previtero,
2017). Gennaioli et al. (2015) argue that many investment managers, whom they refer to as “money
doctors,” advertise on the basis of trust, experience, and dependability, rather than simply past
performance. Consistent with their predictions about the importance of trust in this industry, Gurun,
Stoffman, and Yonker (2018) find that the clients of investment advisers respond dramatically
to a shock to trust in their advisers. Several recent papers have investigated the importance of
misconduct in this industry (Charoenwong, Kwan, and Umar, 2017; Dimmock et al., 2017; Egan
et al., 2017). Finally, in a contemporaneous working paper, Clifford and Gerken (2017) investigate
the effect of the Broker Protocol on investment in human capital.6 We contribute to this literature
6Clifford and Gerken (2017) conclude that employees are more likely to become investment advisers after their
by providing evidence of the importance in adviser mobility on misconduct, asset flows, and firm fee
structures.
1
Data and sample construction
In this section we discuss the four main data sources utilized in the study and how we use them to
construct the adviser-level and firm-level datasets used in our analysis.
1.1 Financial adviser data
Data on financial advisers are extracted from FINRA’s web server, which provides consolidated
data from their BrokerCheck website and the SEC’s Investment Adviser Public Disclosure (IAPD)
website.7 These data include information on all registered representatives (brokers) and investment
adviser representatives (investment advisers). Following Egan et al. (2017), we refer to these two
groups collectively as “financial advisers.” Data extracted from this source include the history
of advisers’ of registration by firm, locations of employment, customer complaints and dispute
resolution, and industry examinations. The data are similar to that used in the main analysis of
Egan et al. (2017), but also include advisers working for registered investment advisers that are not
also broker-dealers.
1.2 Investment adviser data
Data on registered investment advisory firms are from Part 1A of SEC Form ADV, the Uniform
Application for Investment Advisor Registration, which we obtained through a series of Freedom
of Information Act (FOIA) requests. The SEC granted us all electronic filings made since the
electronic filing mandate began in 2001, through the first quarter of 2017. These data include
7
detailed information about investment advisory firms, including information about the advisory
business, their owners, their clients, and any criminal behavior. Importantly, investment advisory
firms are required to update their filings annually, including assets under management (AUM) and
number of accounts. Using these data, we follow Gurun et al. (2018) to construct an advisory
firm-year panel dataset.8
1.3 Broker-dealer data
Broker-dealers are identified using Form BD, which is filed by all registered broker-dealers. The data
was obtained through a FOIA request to the SEC and is augmented with additional information
from the SEC’s website listing active broker-dealers by month, dating back to 2007.9
1.4 Broker protocol data
Entry and exit dates to the broker protocol are collected from a web site maintained by the law
firm Carlile, Patchen, and Murphy, LLP.10 The site includes a directory of all firms that have
ever entered the broker protocol, and provides legal names of firms, their dates of entry and exit,
and contact information. We match these firms to FINRA’s unique firm-level CRD identifier by
matching legal names of these entities to those in the SEC and FINRA databases. This matching is
extremely precise because the protocol web site uses legal names of firms.
As of the end of 2016, there were 1,515 unique firms that had joined the broker protocol. Of
these, we are able to identify the CRD# for 1,325 firms, or 87.5% of the initial sample. Most firms
that we are unable to match appear to be banks or trusts and are therefore not included in the
adviser data. Of the matched firms, 1,154 (87.1%) had at least one adviser employed in the year
8
Several other papers use these data to study hedge funds. See, for example, Brunnermeier and Nagel (2004), Brown, Goetzmann, Liang, and Schwarz (2008), Brown, Goetzmann, Liang, and Schwarz (2009), Dimmock and Gerken (2012), Brown, Goetzmann, Liang, and Schwarz (2012), Bollen and Pool (2012), and Clifford, Ellis, and Gerken (2016).
9http://www.sec.gov/help/foiadocsbdfoiahtm.html 10
prior to joining the protocol. (The remainder is firms that were created legally and joined the
protocol prior to commencing operations and having any registered advisers.)
Table 1 reports firm entry and exit by year into the protocol. The table shows that by December
2016, only 27 of the 1,154 firms that had entered the protocol had subsequently left. Entry by
number of firms peaked at 214 in the aftermath of the financial crisis, in 2009. Looking at the
number of advisers added to the protocol, the two highest years were 2004, with 52,417 advisers
joining, followed by 2009, with 48,061 advisers added. The table also shows that in the early years
of the protocol entry was dominated by large broker-dealers, but that smaller investment advisers
have made up the majority of entrants since 2008. For example, the average joining firm in 2004
had 13,104 advisers, while at the end of our sample period this number had declined to just 31.
Our analysis uses the period of 2007 onward because of the possibility of a survivorship bias
present in our data prior to 2007, which we discuss in detail below. The table shows that our
sample includes 99% of the staggered firm entries, 100% of the exits, and 176,542 advisers that were
employed when their firms joined the protocol, which is 71% of the population.
Figure 1 shows the percentage of firms and advisers in the protocol by year. Panel A of the
figure shows that protocol membership by firm has steadily increased over the period. By the end of
2016, 6.4% of firms with more than one adviser were party to the protocol. These rates are slightly
higher for broker-dealer firms than for non-broker-dealer firms. Turning to the number of financial
advisers employed at firms in the protocol, Panel B of the figure shows that by the end of 2016,
39.0% of advisers (296,879) were employed by firms in the protocol. A much larger proportion of
advisers employed by broker-dealers than those employed by non-broker-dealers were covered (43.4%
1.5 Additional data sources
We obtain data on fee-based assets and fee revenue for a subset of large broker-dealers from the
B–D Data Center on theInvestmentNews website, 11 These data, which cover approximately 75
broker–dealers per year from 2004 to 2016, come from the InvestmentNews’ annual independent
B–D surveys.
1.6 Sample construction
1.6.1 Survivorship-bias-free adviser sample
We use historical registration dates for advisers to construct a survivorship-bias free adviser-firm-year
panel dataset. The FINRA website does not state explicitly how long it retains financial adviser data
on its website. We downloaded the data beginning in July 2017, after an update to FINRA’s website
Terms of Use explicitly provided permission for researchers to download the data for academic
purposes.12
To identify the period for which the data are free of potential survivorship bias, we calculate
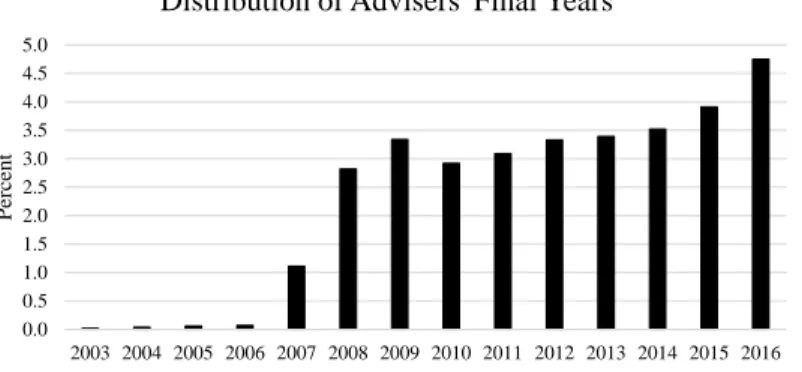
the last year that each financial adviser is included in the data. Panel A of Figure A.I in the
Internet Appendix shows the distribution of these final years. Almost none of the advisers file
their final deregistration prior to 2007. In 2007, which was ten years before we downloaded the
data, the number of adviser deregistrations is larger at 1.1%, but still only about one-third of the
number who finish their careers in 2008.13 We therefore suspect that FINRA deletes entire adviser
histories from the publicly-available data once they have been de-registered for ten years. Panel B
provides additional support for this claim. It compares the distribution of an adviser’s final month
of registration in 2007 to all other years. The typical distribution is fairly even across all months,
although with an uptick in December. But the 2007 sample is completely different—there are almost
11
http://www.investmentnews.com
12See item 5 of FINRA BrokerCheck
rTerms of Use, modified July 17, 2017. 13
no final de-registrations until July in that year, which is precisely ten years before we downloaded
the data. In a final test, we randomly select 500 individuals in our data with deregistration dates
in August 2007 to check if they are still present in the data on FINRA’s website. Of these, 480
individuals are no longer available, meaning that they have been removed subsequent to our initial
downloading, after the ten-year window was reached.
In light of this evidence, we conclude that our data are survivorship free only during the period
August, 2007 through June, 2017. Our tests using these data are therefore conducted with annual
panel data from the end of 2007 until the end of 2016.
One complication in constructing the employee–employer matched dataset is that the data
provides registration dates rather than actual employment dates. An adviser could, for example,
de-register but stay with the firm in a non-advisory role.14 We therefore assume that an adviser is
continually employed with a firm when an advisers’ registration ends at a firm, but then begins
again at that same firm within 365 days, provided that the adviser has not registered with another
firm during the intervening period. We also remove registrations of less than one week.
A second complication is that many financial advisers are registered simultaneously with multiple
firms. In our sample, 91.5% of advisers–year observations are from advisers registered with one firm,
while the corresponding numbers for those registered at two firms is 8.1%. The remaining 0.4%
of observations represent advisers simultaneously registered at more than two firms. In cases of
multiple employment, we assume that the primary employer is the firm with which the adviser has
been registered the longest.15
Finally, we limit our sample to firms with at least two advisers, since we are interested in
the effects of non-compete agreements. Our final survivorship-free sample includes 6,734,979
employee-year observations from the end of 2007 to the end of 2016.
14
We argue that this is not too much of an issue, because the cost of maintaining registration is low relative to the potential benefits, so even if financial advisers move into different roles, they will most likely keep their registrations active.
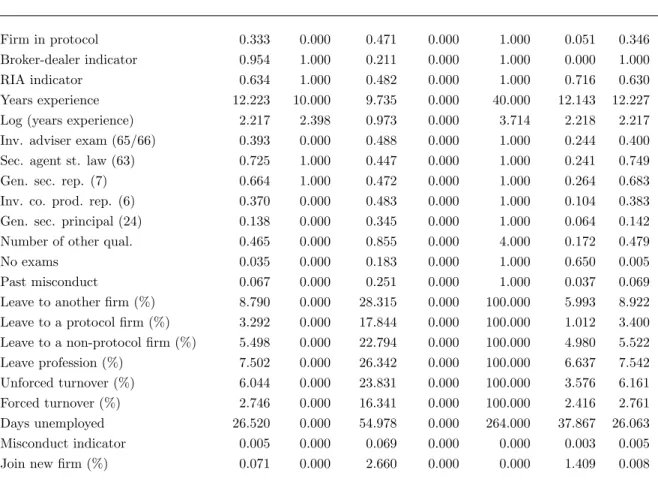
Summary statistics for the adviser-panel are displayed in Panel A of Table 2. The table shows
that for 33% of employee-year observations are for advisers who work for firms in the protocol. This
number is much higher for employees working at broker-dealers (34.6% vs. 5.1%), and most financial
advisers work for broker-dealers (95.4%). The average financial adviser has 12.2 years of experience.
The unconditional probability of an adviser leaving to another firm in the sample is 0.088 and the
probability that they leave the profession is 0.075. We decompose observations where advisers
move to other firms in two ways. First, we categorize departures by whether their destination
firm is a member of the protocol. Not surprisingly, the majority of moves are to non-protocol
firms (62.5%), since there are many more of them. Second, we compare at forced and unforced
turnover. While we do not know the exact nature of turnover, we assume that any turnover where
the adviser subsequently remained unemployed as an adviser for at least 90 days is forced. The
average days unemployed for advisers is 26.5, but the median is 0.0, indicating that most turnover
is likely planned.
We construct a misconduct indicator variable following Egan et al. (2017).16 During our sample,
advisers engage in misconduct 0.5% of the time, which is slightly smaller than the 0.6% reported
in Table 1 of Egan et al. (2017). Non-broker-dealers appear to be about 40% likely to engage in
misconduct. We also calculate a past misconduct variable, which indicates if an adviser has ever
engaged in misconduct in the past. Its average is 6.7%, matching the 7% reported by Egan et al.
(2017). More generally, our summary statistics closely match those of Egan et al. (2017).
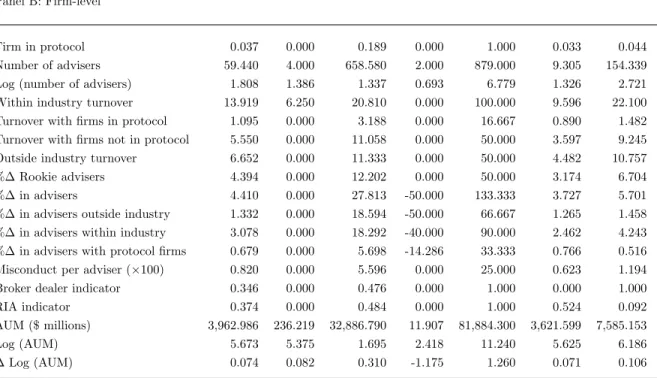
1.6.2 Firm-level sample
We collapse the adviser-level data to the firm-level each year. This gives us 120,159 firm-year
observations from 2007 until 2016, for about 12,000 firms per year. In 3.7% of the firm-years, firms
16
are members of the broker protocol and in 34.6% firms are broker-dealers. The average firm has 59
advisers, but this distribution is highly skewed with the median being only four. Moreover,
broker-dealers have many more advisers than non-broker-broker-dealers. Turnover, defined as the percentage of
advisers leaving the firm during the year plus the percentage of advisers joining the firm during the
year divided by two, is about 14% and for the average firm in the sample the number of advisers
grows by about 4.4% per year.17 Misconduct per adviser occurs at a rate of 0.82% in the sample,
and as previously noted it is less frequent among non-broker-dealers.
Part of the analysis relies on estimating the effect of the protocol on asset flows across firms.
We can perform these analyses only for firms that are also registered investment advisers with the
SEC. The RIA sample indicator reveals that in about 37.4% (44,988 firm-years) of the firm-years
firms also file Form ADV and report AUM. The average AUM for these firms is $3.9 billion, but the
median is much smaller at $236 million. Broker-dealer RIAs manage roughly twice as many assets
as non-broker-dealers. The average asset growth per year is 7.4%.
2
Empirical methodology
We are interested in understanding the effect of non-compete agreements on the market for financial
advice. This includes how these agreements affect the allocation of labor, as well as how that
allocation spills over on to firm and product market outcomes. To assess the impact of NCAs we use
the staggered panel of firm entry and exit into the broker protocol, which relaxed the enforcement
of NCAs with other member firms.
A nice feature of the broker protocol is that there are very few barriers to entry or exit. Firms
entering the broker protocol need only file a joinder agreement and notify the Securities Industry
and Financial Markets Association (SIFMA) of their entry. Exiting requires written notification ten
17
days prior to leaving the protocol. These low costs alleviate any concern that certain types of firms
are systematically excluded from joining and that the characteristics of those excluded firms drive
our results.
A challenge of estimating the causal effect of the broker protocol is that firms are likely to join
strategically. Indeed, our results show that this is likely the case. Therefore, at least for firm-level
observations, there are two sources of endogeneity to worry about. The first is endogeniety due to
ommitted variables. We address this issue by including firm fixed effects in our regressions. This
accounts for all time-invariant firm-level omitted variables, but cannot account for firm characteristics
that vary through time. We therefore include a number of time-varying firm-level control variables
in our models, as well as year fixed effects to remove the effect of any time series trends that could
be due to changing economic conditions or the increasing number of firms entering the protocol, for
example. Regression coefficient estimates on protocol membership will be unbiased as long as all
time-varying omitted variables are uncorrelated with protocol membership.
The second source of endogeneity is reverse causality. Firms likely join the protocol to poach
advisers from other firms. So when regressing turnover on protocol membership, for example,
it is difficult to determine whether firms join the protocol because they seek to poach investors
or whether joining the protocol causes turnover to increase. We argue that while this source of
endogeniety is certainly present at the firm level, at least for advisers at large firms, firm entry into
the protocol acts as an exogenous positive shock to the transferability of the advisers’ relationship
assets, essentially transforming what were once firm-specific assets to a general assets that advisers
can take with them if they leave.
Since not all of the analysis can be conducted at the adviser level we estimate both adviser- and
firm-level fixed effect regressions. Not only does our empirical methodology exploit within-firm time
series variation in the enforcement of non-compete agreements, but it also takes advantage of one of
all firms, but only with other firms that are also members of the protocol. This strengthens our
causality argument, allowing us to test, for example, whether non-competes influence to which firms
advisers move and whether they take more of their clients assets with them when they move to
these firms.
3
Results
In the following sections, we test whether NCAs restrict the mobility of workers and their relationship
assets. We begin by investigating the direct effects of NCAs. Specifically, we test whether the
relaxing of NCAs affects financial adviser mobility (Section 3.1) and advisers’ abilities to move
relation-assets (Section 3.2). We then turn to estimating the indirect effects of relaxing NCAs, which
effectively increases the bargaining power of advisers with their firms. Specifically, we test whether
the relaxation of NCAs changed firms’ willingness to discipline their advisers for bad behavior and
whether this in turn influenced advisers’ propensities to engage in financial misconduct (Sections 3.3
and 3.4). We then test whether firms passed any added costs associated with their loss of control of
their relation assets on to their clients in the form of higher fees (Section 3.5). Finally, we investigate
the relaxation of NCAs on entrepreneurship (Section 3.6.
3.1 Adviser turnover
3.1.1 Firm-level
We begin by estimating the relationship between broker protocol membership and turnover.
Specifi-cally, we estimate:
where Turnoveri,t is the adviser turnover at firm iduring calendar year t, (Firm in protocol)i,t is
a dummy variable that is equal to one if firm iis a member of the broker protocol at the end of
yeart. As controls, we include the log of the number of advisers employed by the firm at the end
of yeart−1. If relaxing NCAs increases turnover, then the coefficient estimate on βp should be
significantly greater than zero.
Significance tests for all of our results are calculated from robust standard errors that are
double-clustered by firm and year. Moreover, to ensure that our findings are not driven by outliers,
all dependent variables are winsorized at the 1st and 99th percentiles.
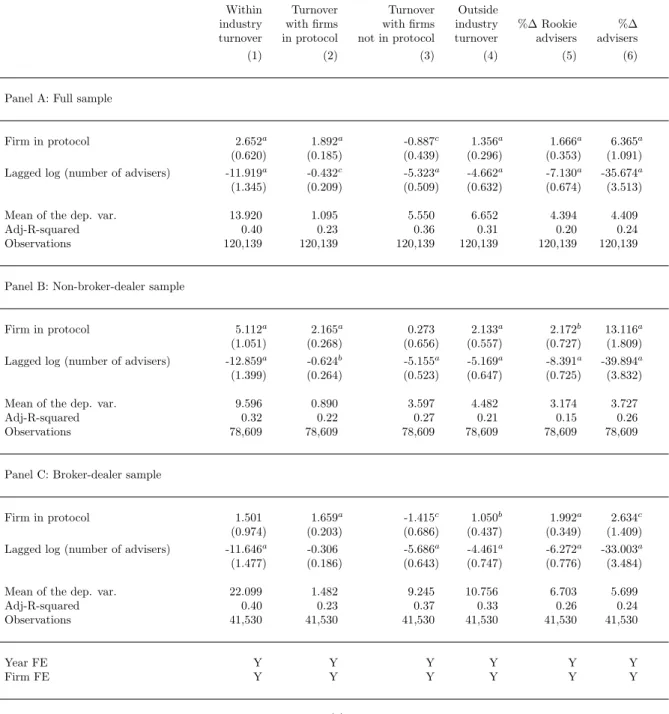
Table 3 reports results from this regression. The dependent variable in column 1 is within
industry turnover, which is defined as the average of the percentage of advisers who either join or
leave the firm from/to firms within the industry during the year. Percentages are calculated based
on the number of advisers at the end of yeart−1. This measure of turnover can be decomposed
into two components: turnover with firms in the protocol; and turnover with firms that are not in
the protocol. Outside industry turnover is the average of the percentage of rookie advisers who join
a firm and the percentage of advisers who leave a firm to retire. Results for each of these categories
of turnover are presented separately in columns 2, 3, and 4, respectively. Finally, in columns 5
and 6, we investigate the relationship between protocol membership and firms hiring new (rookie)
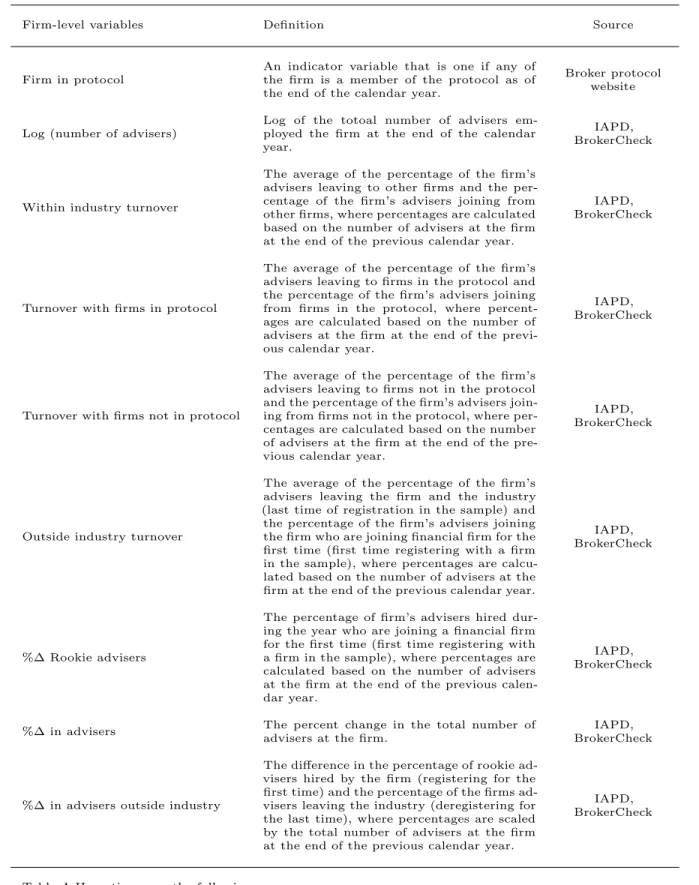
advisers and also the percent growth in all advisers. Detailed definitions of all variable are presented
in the Appendix.
Panel A shows the results for the full sample, while Panels B and C split the samples by
non-broker-dealer firms and broker-dealers. The estimates in column 1 indicate that protocol
membership is associated with 2.65 percentage points higher turnover. Given that the average level
of turnover is 14%, this implies a 19% increase in total adviser turnover. The source of this increase
in total turnover provides further evidence that it is the protocol that accounts for at least part of
the protocol, while turnover with non-protocol firms weakly declines. As mentioned earlier, firms
choose whether and when to join the protocol, so the significantly positive coefficients on “Firm in
the protocol” in columns 5 and 6 both indicate that firms tend to join the protocol when they are
expanding or looking to poach advisers from other firms.
The evidence in Panels B and C show that the joining the protocol has different effects depending
on whether the firm is a broker-dealer. The results for non-broker-dealers mirror those of the full
sample, although with generally larger magnitudes. Non-broker-dealers saw a fifty percent increase
in turnover (5.11/9.59), but it appears that these firms mostly experienced net increases in advisers,
as seen in the results in column 6, suggesting that these smaller investment advisory firms may be
the winners of the broker protocol.
The results for broker-dealer firms are quite different. In general, there was no significant increase
in turnover, but rather the protocol redirected the path that advisers took when leaving and joining
firms: Turnover with firms in the protocol increased by 1.7 percentage points while turnover with
non-protocol firms decreased by 1.4 percentage points after firms joined the protocol.
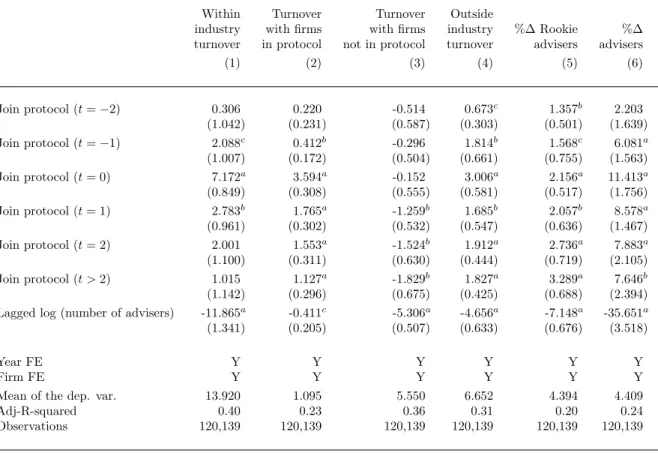
We next explore the dynamics of these findings by estimating the following regression:
Turnoveri,t= +αi+γt+βp,−2(Firm joins protocol)i,t+2+βp,−1(Firm joins protocol)i,t+1
+βp,0(Firm joins protocol)i,t+βp,1(Firm joins protocol)i,t−1
+βp,2(Firm joins protocol)i,t−2+βp,>2(Firm joins protocol)i,<t−2
+ Γ0Controlsi,t−1+i,t,
(2)
where (Firm joins protocol)i,t is an indicator variable that is one if firmi joins the broker protocol
in year t. Therefore, the βp,s coefficients estimate the changes in turnover relative to average
turnover three years or more prior to joining the broker protocol. For instance, βp,−1 estimates
βp,0 captures abnormal turnover in the first year of membership. The parameterβp,>2 captures the
average abnormal turnover after three or more years of protocol membership.
Results from the regression are presented in Table 4. In column 1 we see that total turnover
spikes by seven percentage points, an increase of over 50%, in years that a firm joins the protocol, and
remains significantly abnormally high in the second year of protocol membership, but subsequently
reverts to levels observed prior to membership. There is also a small anticipatory effect, with total
turnover two percentage points higher in the year prior to joining the protocol. This greater total
turnover can be attributed to two sources: greater turnover with other protocol firms (shown in
Column 2); and hiring new rookies (Column 5). As in the previous analysis, we see that protocol
membership redirects advisers to different types of firms. While abnormal turnover with protocol
firms is highest in the year that a firm joins, it remains abnormally high in the years after joining.
Turnover with non-protocol firms does not decline abnormally until the second year of membership,
but it remains persistently low thereafter.
Another interesting observation is that the percent of rookie advisers hired increases at an
increasing rate over the time period. More than two years after joining the protocol, recruiting of
these advisers is remains higher than it is than in the period immediately after joining. This is
consistent with the notion that protocol membership is attractive to new young advisers who hope
to build their client lists and profit from them in the future.
3.1.2 Adviser-level
Joining the broker protocol is a firm-level decision, but poses an exogenous shock to the transferability
of relationship assets for advisers, especially in large firms. Membership therefore reduces the cost
of turnover for current advisers and potentially increases it for firms. With lower turnover costs, we
might expect advisers to be more willing to move for better pay or better conditions. However, these
who may be willing to make concessions to keep their advisers on board. To test whether protocol
membership increases adviser turnover, we estimate the following linear probability model using our
annual adviser-employer matched panel from 2007 until 2016:
Turnoverj,i,t+1 = +αi+γt+βp(Firm in protocol)j,i,t+ Γ0Controlsi,t+j,i,t, (3)
where Turnoverj,i,t+1 is an indicator that is one if individual j’s employment at firmiends during
year t+ 1, (Firm in the protocol)i,t is an indicator variable that is one if firm i is in the broker
protocol by the end of yeart, and αi andγt are firm and year fixed effects, respectively. Control
variables include the log of the number of advisers employed at firmiat the end of year t, the log of
the number of years of experience of adviserj by the end of yeart, and a series of dummy variables
indicating the exams/qualifications of the financial advisers, which follow the definitions used in
Egan et al. (2017). One control beyond that included by Egan et al. (2017), is the variable “No
exams,” which takes a value of one if the financial adviser has passed no exams. In many states,
financial advisers are exempt from taking exams if they have other qualifications, such as a CFA
Charter. Table 2 shows that 3.5% of advisers have no exams passed, but that 65% of advisers at
non-broker-dealers have passed no exams. The variable of interest is “Firm in protocol.” If protocol
membership increases the propensity of advisers to leave their firms, then the estimate of βp should
be significantly positive.
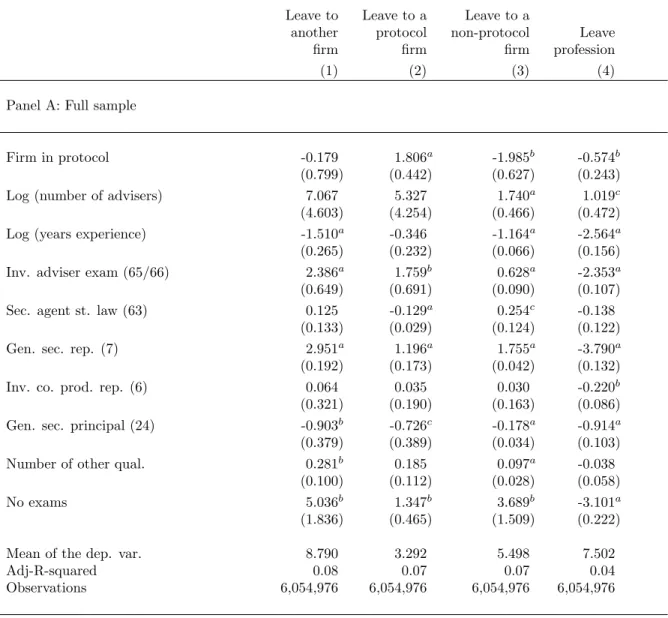
We estimate equation 3 using four alternative definitions of turnover. First, we use “Leave to
another firm”, an indicator variable that is one if an adviser leaves one firm and joins another. We
further decompose this variable into two categories: whether the firm that the adviser joins is a
member of the protocol or not, creating the indicator variables “Leave to a protocol firm” and
“Leave to a non-protocol firm.” Our final measure of turnover is “Leave profession.” This includes
turnover events where the adviser departs the firm and never rejoins another firm during our sample
Panel A of Table 5 shows the regression results for these four turnover variables. The results in
column 1 indicate that firms did not abnormally depart their firms once their firms became a part
of the broker protocol. Our estimate of βp is indistinguishable from zero. However, the evidence in
columns 2 and 3 is consistent with our earlier evidence—protocol membership redirected advisers
toward other protocol firms and away from non-protocol firms. The estimate of βp in column 2
is 1.8, indicating that once advisers’ firms joined the protocol, those advisers where 1.8% more
likely to leave to another protocol firm. The unconditional probability of leaving to join a firm
in the protocol is 3.3%, so the magnitude of this effect is substantial, increasing the probability
by more than 50%. The estimates in column 3 indicate that the probability that advisers leave
to join non-protocol firms following their firm joining the protocol declines by about 2%, which
almost exactly offsets the increase in movement toward protocol firms. Finally, in column 4, we see
that advisers are slightly less likely to leave the profession after their firms join the protocol. It is
possible that this could be a result of increased bargaining power, which ultimately leads to better
employment terms and overall satisfaction.
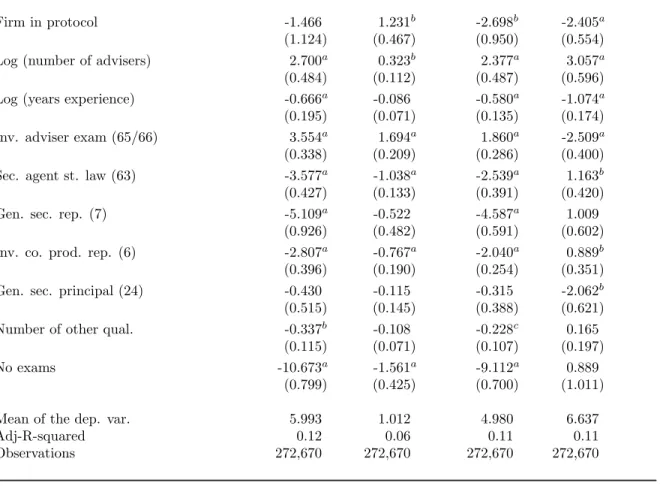
Panels B and C present the results for the sample of non-BDs and BDs, respectively. In general,
we find that turnover does not increase when firms join the protocol, but the path that advisers
take does—they become much more likely to join firms in the protocol and less likely to leave for
those not in the protocol.
3.2 Asset flows
The firm-level results from section 3.1 show that turnover increases after firms join the protocol,
but that this increased turnover seems to be driven by a firm’s choice to enter the protocol, which
is endogenous. It appears that firms seeking to grow join the protocol to poach advisers. This
increased hiring shows up in firm-level turnover. Our adviser-level analysis, which we argue estimates
causes advisers to be more likely to leave their firms for other firms. However, both the firm- and
adviser-level results show that turnover tilts toward other firms in the protocol once a firm joins.
These findings suggest that while total turnover does not increase, the average cost of turnover
likely does for firms once they join the protocol.
The finding that advisers increasingly moving to protocol firms is consistent with the idea that
they do so because they can take clients with them when they depart. In this section we test
whether AUM follow advisers and in particular, whether more assets follow advisers from firms in
the protocol, especially when they join other firms in the protocol. To test this we estimate the
following fixed effects OLS regression model:
∆log(AUM)i,t=αi+γt+βn,o(%∆ in adv. outside industry)i,t
+βn,n(%∆ in adv. within industry)i,t
+βn,p(%∆ in adv. with protocol firms)i,t
+βp,oProtocoli,t×(%∆ in adv. outside industry)i,t
+βp,nProtocoli,t×(%∆ in adv. within industry)i,t
+βp,pProtocoli,t×(%∆ in adv. with protocol firms)i,t
+βp(Firm in protocol)i,t+ Γ0Controlsi,t−1+i,t,
(4)
where ∆log(AUM)i,t is the change in the log of AUM of firm iduring year t, (Firm in protocol)i,t
is an indicator variable if firm iis a member of the broker protocol by the end of yeart, andαi and
γt are firm and year fixed effects, respectively.
The %∆ in adv. variables are various decompositions of the percentage change in the number of
advisers at firmiduring yeart. “%∆ in adv. within industry” is the percentage change in advisers to
and from other firms in our sample. Therefore, it is the difference between advisers joining from other
firms and advisers leaving to other firms, regardless of whether those firms are protocol members.
This includes the difference between advisers who enter our sample for the first time and those that
leave the profession (never show up in our data again) and also the difference between advisers
joining after being unemployed for at least a year and those leaving and being unemployed for at least
a year. These two components sum to the total percentage change in advisers at the firm during the
year, so %∆ in adv.)i,t = %∆ in adv. outside industryi,t+ %∆ in adv. within industryi,t, where
the scaling factor in all measures is the number of advisers at the end of yeart−1. We separate
these components because we hypothesize that advisers moving to or from other firms in the industry
are more likely to move assets with them than are rookie advisers, or those who leave the industry.
This leads to the prediction that βn,n> βn,o.
Finally, “(%∆ in adv. with protocol members)” is the difference between the percentage of
advisers joining from protocol member firms and those leaving to protocol member firms. As before,
the scaling factor is the total number of advisers at the end of yeart−1. Constructing our variables
this way allows us to test for differences in the elasticities of AUM to advisers for those joining from
or leaving to protocol and non-protocol firms.
In regression 4, the coefficientsβn,o,βn,n, andβn,pcapture the elasticities of AUM with respect to
outside industry advisers, non-protocol advisers, and protocol advisers for firms not in the protocol,
respectively. The coefficientsβp,o,βp,n, andβp,p capture the incremental effect on those elasticities
due to firms being in the protocol. Recall that in order for financial advisers to move assets from
one firm to another without legal repercussions, both firms must be in the protocol. Therefore, our
main hypothesis is that changes in AUM should be most sensitive to the changes in advisers at
protocol firms moving to and from other protocol firms, orβp,p>0. In addition, there is no reason
to believe that the change AUM should be any more sensitive to changes in non-protocol advisers
or changes in advisers from outside the industry if the firm is a protocol member, implying that
We estimate various forms of regression (4) using a firm-level annual panel data set constructed
from electronic filings of Form ADV as described in section 1.2. In Table 2 we showed that this
sample covers roughly 37% of firm-year observations in the sample. This decline in sample size is
due to the fact that not all firms that employ financial advisers are registered investment advisers,
which are required to make regular filings with the SEC.
Table 6 shows the results of our tests. In column 1, we include only the “%∆ in advisers” as our
variable of interest in order to test the general contemporaneous relationship between changes in
AUM and changes in advisers. The coefficient estimate is 0.104, which implies that a 1% increase
in the number of financial advisers at the average firm is associated with about 10.4 basis points
greater AUM. In column 2, we decompose the change in advisers between those coming within and
outside the industry. The estimates show that changes within the industry are associated with much
larger changes in AUM. A 1% increase in advisers coming from outside the industry is associated
with a 6 bps increase in AUM, while the same change in advisers coming from other firms within
the industry leads to an increase of about 15 bps. This is consistent with our prior and with the
idea that advisers do move assets with them when they move.
In column 3, we test whether changes in AUM are more sensitive to changes in within-industry
advisers when those changes are due to advisers either arriving from or leaving to firms in the
protocol. The evidence indicates that there is such a difference. The coefficient estimate on “%∆ in
advisers with protocol firms” is 0.166 and significant at better than the 1% level. This indicates
that a 1% increase in advisers joining from firms in the protocol is associated with 16.6 bps greater
increase in AUM than the same increase in advisers coming from firms that are not in the protocol,
and along with the coefficient estimate of 0.130 on “%∆ in advisers within industry” it implies that
a 1% increase in advisers joining from protocol firms is associated with a 29.6 bps increase in AUM.
In column 4, we estimate the full version of equation 4. Consistent with our hypotheses, we find
indicate that changes in AUM are particularly sensitive to changes in adviser going to and joining
from firms that are protocol members, especially when the firm itself is a protocol member. Our
estimate of the change in AUM for a one percent change in the number of advisers coming from
protocol firms to a firm in the protocol is 12.9 + 12.8 + 4.8 + 15.7 = 46.2 bps. In other words, a new
adviser joining a firm in the protocol from another firm in the protocol, on average, brings clients
with assets worth almost half of the average assets of the firm’s existing advisers. It is possible that
some of this 46 bps of AUM growth is due to factors other than new advisers bringing assets with
them, but the 15.7 bps due to protocol-to-protocol firm turnover likely represents a lower bound of
the size of the effect, as there is no other reason to believe that assets would grow by more for firms
in the broker protocol than those that are not when they hire advisers from other protocol firms.
3.3 Disciplining advisers
In the previous section, we provided evidence that advisers move more of their clients’ assets with
them once their firm joins the protocol. This means that losing advisers is more costly for firms
in the protocol. We therefore ask whether this makes firms reluctant to fire advisers, even when
the advisers engage in bad behavior. To test this we modify regression Equation 3 to include an
indicator variable that is one if the adviser engages in misconduct during year t(“Misconduct”),
using the definition of Egan et al. (2017), and the interaction of “Misconduct” with whether the
firm is a member of the protocol. Our dependent variable is forced turnover, which is defined as
turnover for which the adviser is subsequently unemployed for at least 90 days on the assumption
that few individuals would plan choose to be unemployed for that long.18 Formally, we estimate:
Turnoverj,i,t+1 = +αi+γt+βm(Misconduct)j,t+βp(Firm in protocol)j,i,t
+βp,m(Firm in protocol)j,i,t×(Misconduct)j,t+ Γ0Controlsi,t+j,i,t,
(5)
18
where definitions of all variables follow those previously described. βm measures turnover sensitivity
to misconduct, which should be positive, at least in egregious cases of misconduct. βp measures the
difference in turnover propensity for firms once they join the protocol. If turnover is more costly for
firms, then they may be more reluctant to fire advisers following the protocol entry, implying that
this coefficient could be negative. βp,m captures the difference in turnover sensitivity to misconduct
attributable to firms being protocol members. If the increased cost of turnover for protocol firms
makes them less willing to discipline their advisers for bad behavior, then the estimate ofβp,m will
be negative.
The results are presented in Table 7. For the full sample of advisers (column 1) and for the sample
of advisers who work for broker-dealers (column 2), engaging in misconduct increases the probability
of being fired by about half of a percent, which is about a 20% increase in the unconditional
probability of forced turnover. In those same samples, being a member of the protocol essentially
undoes this discipline. The estimates of βp,m are −0.70 and −0.63, respectively. Focusing only on
non-broker-dealers, advisers who work for firms in the protocol have a−0.0063 lower probability of
being fired, a decrease of about 30%. In general, these results are consistent with firms being more
reluctant to fire employees once they enter the protocol for fear of losing AUM.
As a placebo test, in columns 4 through 6 we repeat these regressions with “Unforced turnover”
(that is, turnover in which the adviser gains employment at another firm within 90 days) as the
dependent variable. We find no evidence that this measure of unforced turnover is significantly
related to firms being in the protocol or the interaction of firms being protocol members and advisers
engaging in misconduct.
3.4 Misconduct
Since firms are less likely to discipline their advisers for misconduct, it natural to ask whether
misconduct increases once firms join the broker protocol. We conduct both firm- and adviser-level
tests. In the firm-level tests, we regress “Misconduct per 100 advisers,” defined as the number of
advisers who engage in misconduct during the year divided by the number of advisers at the end of
the previous year times 100, on “Firm in protocol”, control variables, and firm and year fixed effects.
The results of this test are presented in Panel A of Table 8. The results presented in column
1 indicate that misconduct, on average, significantly increases for firms after joining the protocol.
The magnitudes are large—“Misconduct per 100 advisers” increases by 0.535 on an unconditional
mean of 0.821, implying an increase in misconduct of 65%. Results using only broker-dealer firms,
presented in column 3, mirror these results, while for the sample of non-broker-dealers (column 2)
there is no evidence that joining the protocol is associated with an increase in adviser misconduct.
In Panel B, of Table 8 we present the adviser-level regression results. In these regressions, the
“Misconduct” indicator variable described in Section 3.3 is regressed on “Firm in protocol,” controls,
and firm and year fixed effects. Egan et al. (2017) show that advisers’ past misconduct is a strong
predictor of future misconduct. We therefore add “Past misconduct” as a control in these regressions.
The coefficient estimate on “Firm in protocol” is not statistically different from zero in any of the
three samples, indicating that the propensity of the average adviser to engage in misconduct does
not increase once their employer joins the protocol.
It is interesting that the two methodologies yield different results, although since the firm-level
regressions give greater weight to misconduct of smaller firms, it is likely that for these smaller firms
turnover is even more costly.
3.5 Commissions and fees
In this section, we investigate whether composition of broker revenues changed over the years in
response to the turnover induced by the protocol. A broker–dealer can generate revenue from two
selling particular investment products (such as high-fee mutual funds), a potential conflict of interest
can arise between brokerages and their clients. A brokerage fee, on the other hand, is a flat rate
that customers pay brokers to manage money regardless of the type of investment the client has
in her portfolio. This flat rate is generally expressed as a percentage of asset under management.
Previous research has found that financial advisors play an influential role in determining their
clients’ asset choices. For instance, Foerster et al. (2017) show that a large portion of the advisors’
personal portfolios look similar to client portfolios, suggesting advisor’s personal behavior explains
a substantial amount of variation in client behavior. Given the influence of the broker dealer on
clients’ assets, a natural question is whether the protocol created an incentive for firms to change
their revenue structure in order to offset the costs firms experience from increased protocol-induced
turnover.
We investigate this issue in two steps. We begin by examining whether commission-based
revenue increased relative to fee-based revenue. We focus on the commission-based component
because studies have also found that some advisors steer customers into particular financial products
that may be not in their customers’ best interests. For instance, Mullainathan et al. (2012) find
that some advisors in the U.S. steer investors from well diversified portfolios to high fee mutual
funds. Such opportunistic behavior has also been found in other financial products (Anagol, Cole,
and Sarkar, 2017) and other countries (Bhattacharya, Hackethal, Kaesler, Loos, and Meyer, 2012;
Hackethal, Inderst, and Meyer, 2012). In our second analysis, we investigate whether firms pass
part of the protocol-related costs on to customers through an increase in the flat-fee rate.
To test our hypotheses, we use broker-dealer revenue breakdown information from the B-D Data
Center maintained on the InvestmentNews website. As discussed in Section 1.5, our dataset covers
2004 to 2016 and contains approximately 75 large broker-dealers per year. For each of these firms,
we observe both the amount of commission revenue and fee revenue, as well as the total asset under
management that generated the fees. From these, we calculate two variables. The first one is the
Total revenue. The second variable is “Fee rate”, i.e. Fee rate = Fee Revenues / Fee-based Assets
(AUM).
We estimate the relationship between broker protocol membership and commission share and
fee rate by regressing these measures on “Firm in protocol,” control variables, and year and firm
fixed effects. Table 9 reports the regression results. To ensure our findings are not driven by outliers
all dependent variables are winsorized at the 1st and 99th percentiles.
The evidence in column 1 and 2 shows that while the commission-based revenues reduced slightly,
2.25%, after the joining the broker but the reduction is small compared to the average commission
share, 75%. The evidence in column 3 and 4 shows that fee rate increased by 14.4 basis point
after the joining the broker protocol. Off of the mean fee rate, 100 basis points, the increase is not
only statistically significant, but also economically large. These results collectively suggest that
broker-dealers do not change their revenue composition after joining the protocol, but they increase
the fee derived from fee-based accounts significantly.
3.6 Entrepreneurship
One strategy that advisers can take if their employer is a protocol member is to set up a shell
company, register it as an investment adviser, join the protocol, and then move all their clients’
assets to their new company and extract all fee revenue from those clients. There is also empirical
evidence that enforcement of NCAs impedes entrepreneurship (Samila and Sorenson, 2011). We
therefore, test whether the relaxation of the enforcement of advisers’ NCAs due to the broker
protocol resulted in advisers moving to new firms. To do this, we first identify new registered
investment advisory firms in our sample. We first calculate the first year in our data that a firm
exists. We then search all “initial filings” of form ADV and check whether this initial years coincide.
Firms can register prior to having registered employees, so we require that the initial filing is no
variable, “Join new firm” that is one if the adviser joins a new firm in yeart. Table 2 indicates that
the probability that an adviser joins a new firm in a particular year is rare – it is only 0.0007 or
0.07 bps.
We then use our adviser-level data and estimate a dynamic version of Equation 3 with “Turnover”
replaced by our specific type of turnover, “Join new firm.” Specifically, we estimate:
Join new firmj,i,t+1 = +αi+γt+βp,0(Firm joins protocol)i,t+1
+βp,1(Firm joins protocol)i,t+βp,2(Firm joins protocol)i,t−1
+βp,>2(Firm joins protocol)i,<t−1+ Γ0Controlsi,t+j,i,t,
(6)
where are variables and notation all and variable definitions are analogous to prior analysis.
In Figure 2 we plot the βp,t’s and their 10% confidence bounds. The Figure shows that the
probability of joining a new firm is significantly positive during the initial year of protocol membership.
The probability increases by 0.05 bps. One year after employers join the protocol is when their
advisers are most like to begin new firms. The probability during the second year of protocol
membership spikes by 0.17 bps making it over 200% more likely that an adviser start a new firm
during that year. The probability then declines to normal levels in the third, but even beyond the
third year of protocol membership advisers of member firms are significantly more likely to leave
and join new firms.
4
Robustness
We run a number of robustness checks. First, we replicate Tables 3, 5, 7, and 8 using the subsample
of firms/employers that are SEC registered investment advisers. We do this to confirm that our
results on adviser turnover, turnover sensitivity to misconduct, and misconduct hold in the same
with them when they change firms. In unreported results, the estimates in all cases look similar to
our main analysis. The exception is the adviser-level of analysis of misconduct, which suggests that
protocol membership is associated with significantly greater misconduct. In the full sample, this
relationship is not significant.
Second, we run all of our adviser-level tests conditioned on advisers working for employers with
at least 100 advisers. We do this to ensure that endogeneity due to reverse causality is not driving
the relationship between protocol membership and our adviser-level outcomes. All results are robust
to this restriction.
Finally, we run our adviser-level tests using the subsample of advisers who are registered with a
single firm. All of the results hold.
5
Conclusion
Financial advisers have historically been routinely bound by non-compete agreements, prohibiting
them from future solicitation of the clients they acquire while at the firm. This made it difficult for
clients to follow their advisers if they switched employers. This changed in 2004 with the signing of
the Broker Protocol by several major broker firms. This agreement has subsequently been joined by
over 1,600 firms.
Using variation in adoption of the protocol, we investigate the effects of the relaxation of
non-compete agreements on the market financial advice. We identify several important effects of the
relaxing of NCAs and the resulting increase in adviser mobility. First, adviser turnover temporarily
increases after firms join the protocol; this appears to be mainly driven by firms choosing to join the
protocol in order to poach advisers from other firms. More importantly, the typical adviser moves
within the industry change significantly: following protocol adoption, advisers increasingly move to
client assets follow advisers. Changes in assets under management of firms in the protocol are much
more sensitive to net changes in advisers from other protocol firms than to net changes in advisers
from non-protocol firms. This is not true for firms that are not in the protocol, indicating that
relaxing enforcement of NCAs allows advisers to take their clients with them. Third, firms in the
protocol are substantially less likely to fire advisers for engaging in misconduct following protocol
adoption and there is some evidence that the incidence of adviser misconduct also increases. Fourth,
client fees increase by about 15% following protocol adoption, suggesting that the increased costs
associated with adviser turnover are passed on to the consumer. Finally, we show that the broker
protocol led to the birth of a substantial number of registered investment advisory firms.
Our findings suggest that enforcement of NCAs in market for financial advice has both positive
and negative spillovers on investors. They also provide support for possible policy action. In
particular, investors could be made better off with more disclosure on the changing nature of
broker incentives. One recent regulatory trend in consumer markets is the notion that consumers
are better off if they are made aware of choices at their disposal before they borrow or sign a
any financial contract. For example, in the mortgage market, the new TILA–RESPA Integrated
Disclosure rules require mortgage providers to supply easy-to-understand disclosure statements.
In credit cards market, the “Schumer box” similarly requires credit card terms to be presented
in a standardized format. The aim of these disclosure was to simplify credit terms and help
consumers easily comprehend and analyze rates and fees associated with financial agreements.
Our analysis provides evidence that some investors could incur higher fees as a result of adviser
transitions, suggesting that additional disclosure to clients may be particularly useful at the time of
such transitions. While FINRA Rule 2273 (Educational Communication Related to Recruitment
Practices and Account Transfers), passed in November of 2016, mandates that clients be notified of
the rule went far enough. Informing clients of signing bonuses paid to their advisers, for example,
might lead clients to ask how firms afford to pay such bonuses.19
Bibliography
Anagol, S., Cole, S., Sarkar, S., 2017. Understanding the advice of commissions-motivated agents: Evidence from the indian life insurance market. Review of Economics and Statistics 99 (1), 1–15.
Barnett, J., Sichelman, T. M., 2016. Revisiting labor mobility in innovation markets. SSRN working paper 2758854.
Becker, G. S., 1962. Investment in human capital: A theoretical analysis. Journal of political economy 70 (5, Part 2), 9–49.
Bhattacharya, U., Hackethal, A., Kaesler, S., Loos, B., Meyer, S., 2012. Is unbiased financial advice to retail investors sufficient? answers from a large field study. The Review of Financial Studies 25 (4), 975–1032.
Boeker, W., 1997. Executive migration and strategic change: The effect of top manager movement on product-market entry. Administrative Science Quarterly, 213–236.
Bollen, N. P., Pool, V. K., 2012. Suspicious patterns in hedge fund returns and the risk of fraud. Review of Financial Studies 25 (9), 2673–2702.
Brown, S., Goetzmann, W., Liang, B., Schwarz, C., 2008. Mandatory disclosure and operational risk: Evidence from hedge fund registration. Journal of Finance 63 (6), 2785–2815.
Brown, S., Goetzmann, W., Liang, B., Schwarz, C., 2009. Estimating operational risk for hedge funds: The ω-score. Financial Analysts Journal 65 (1), 43–53.
Brown, S., Goetzmann, W., Liang, B., Schwarz, C., 2012. Trust and delegation. Journal of Financial Economics 103 (2), 221–234.
Brunnermeier, M. K., Nagel, S., 2004. Hedge funds and the technology bubble. Journal of Finance 59 (5), 2013–2040.
Charoenwong, B., Kwan, A., Umar, T., 2017. Who should regulate investment advisers? SSRN working paper 2899883.
Clifford, C., Gerken, W., 2017. Investment in human capital and labor mobility: Evidence from a shock to property rights. University of Kentucky Working Paper.
Clifford, C. P., Ellis, J. A., Gerken, W. C., 2016. Hedge fund boards and the market for independent directors. SSRN working paper 2537253.
Dimmock, S., Gerken, W., Graham, N., 2017. Is fraud contagious? Career networks and fraud by financial.Forthcoming, Journal of Finance.
Dimmock, S. G., Gerken, W. C., 2012. Predicting fraud by investment managers. Journal of Financial Economics 105 (1), 153–173.
Foerster, S., Linnainmaa, J. T., Melzer, B. T., Previtero, A., 2017. Retail financial advice: does one size fit all? Journal of Finance 72 (4), 1441–1482.
Franco, A. M., Filson, D., 2000. Knowledge diffusion through employee mobility. Tech. rep., Claremont Colleges Working Papers in Economics.
Gennaioli, N., Shleifer, A., Vishny, R., 2015. Money doctors. Journal of Finance 70 (1), 91–114.
Goldin, C., Katz, L. F., 2008. Transitions: Career and family life cycles of the educational elite. American Economic Review 98 (2), 363–69.
Greenhouse, S., 2014. Noncompete clauses increasingly pop up in array of jobs. NY TIMES, June 8. Gurun, U. G., Stoffman, N., Yonker, S. E., 2018. Trust busting: The effect of fraud on investor
behavior. The Review of Financial Studies 31 (4), 1341–1376.
Hackethal, A., Inderst, R., Meyer, S., 2012. Trading on advice. SSRN working paper 1701777.
Jeffers, J., 2017. The impact of restricting labor mobility on corporate investment and entrepreneur-ship. SSRN working paper 3040393.
Klepper, S., 2002. The capabilities of new firms and the evolution of the us automobile industry. Industrial and corporate change 11 (4), 645–666.
Klepper, S., Sleeper, S., 2005. Entry by spinoffs. Management science 51 (8), 1291–1306.
Klette, T. J., Møen, J., Griliches, Z., 2000. Do subsidies to commercial R&D reduce market failures? Microeconometric evaluation studies. Research Policy 29 (4-5), 471–495.
Lavetti, K., Simon, C., White, W., 2017. The impacts of restricting mobility of skilled service workers: Evidence from physicians.Forthcoming, Journal of Human Resources.
Marx, M., 2011. The firm strikes back: non-compete agreements and the mobility of technical professionals. American Sociological Review 76 (5), 695–712.
Marx, M., Strumsky, D., Fleming, L., 2009. Mobility, skills, and the Michigan non-compete experiment. Management Science 55 (6), 875–889.
Mullainathan, S., Noeth, M., Schoar, A., 2012. The market for financial advice: An audit study. Tech. rep., National Bureau of Economic Research.
Oyer, P., 2008. The making of an investment banker: Stock market shocks, career choice, and lifetime income. Journal of Finance 63 (6), 2601–2628.
Philippon, T., Reshef, A., 2012. Wages and human capital in the us finance industry: 1909–2006. Quarterly Journal of Economics 127 (4), 1551–1609.
Rosegrant, S., Lampe, D. R., 1992. Route 128: lessons from Boston’s high-tech community. Basic Books, Inc.