Introduction
How Humans Change the Atmosphere
In addition to the natural changes that occur in the atmosphere, many of the activities we humans engage in can change the atmosphere, principally by altering the chemistry or gaseous composition of the atmosphere. Many human activities release trace amounts of gases or particulates that can result in a variety of impacts on human health and the environment.
For example, there are many technologies or devices burn wood, coal, or oil inside buildings such as woodstoves, boilers, furnaces, ovens and heaters. When these devices are used, they must be probably vented to the outside because the gases that result from combustion can have a serious impact on the ability of we humans to breathe. Carbon monoxide is one such gas that often results from combustion and it is becoming more common for carbon monoxide monitors or alarms to be installed within homes and buildings.
Carbon monoxide, or CO, is a colorless, odorless gas that results from incomplete combustion or burning of fuel. Normally, the atmosphere contains a very small amount of carbon monoxide, about 200 parts per billion (ppb), or .02 parts per million (ppm). If the concentration of carbon monoxide in the air you breathe increases slightly to 9 parts per million, you may begin to have difficulty breathing. A healthy person may be just barely affected by CO exposure of 9 ppm, but older individuals and asthmatics, whose lung function may be already compromised, are likely to feel a greater level of effect.
Carbon monoxide reduces the ability of the body's blood to absorb oxygen. It is also colorless and odorless making detection difficult. Inhaling low levels of carbon monoxide can result in fatigue and chest pain, particularly in individuals with chronic heart disease. Increased exposure to CO can result in headaches, dizziness, sleepiness, nausea, vomiting, and disorientation. At very high levels, inhalation of carbon monoxide can cause loss of consciousness and death. Every year, several hundred lives are lost in the U.S. as a result of carbon monoxide inhalation.
An increase from .02 to 9 ppm in carbon monoxide may seem like a large relative increase, but a change of this magnitude is a change of only 0.000088% in the total concentration of gases in the air you breathe. So you see, a small relative change in the composition of gases in the atmosphere can have a big impact. Also, several fuel burning or combustion devices commonly found in buildings can increase the amount of carbon monoxide by amounts much greater than 9 ppm. For example, CO levels in a room with unvented kerosene space heaters will vary between 0.5 and 50 ppm. Chimney smoke from a woodstove contains 5,000 ppm of CO. Undiluted warm car exhaust contains about 7,000 ppm of CO, and undiluted cigarette smoke about 30,000 ppm of CO. 1
Pollution Indoors
In addition to carbon monoxide, there are many other chemicals, substances, and gases which can be harmful to human health. These chemicals, substances, or gases as a group are called indoor air pollutants. Indoor pollutants are not as easily dispersed or diluted as outdoor pollutants are. As a result, concentrations can often be many times higher than outdoors. Pollutants found indoor include asbestos, biological contaminants, formaldehyde, fumes from household products, lead, nitrogen dioxide,
particulates, pesticides, radon, and tobacco smoke.
Indoor pollution occurs in a wide range of indoor environments including homes, schools, factories, office buildings, and commercial workplaces. Excessive noise, dust, odors and fumes can all serve to lower worker productivity and adversely affect human health. The Occupational Safety and Health
Administration (OSHA) regulates indoor pollution within workplaces and the U.S. Environmental
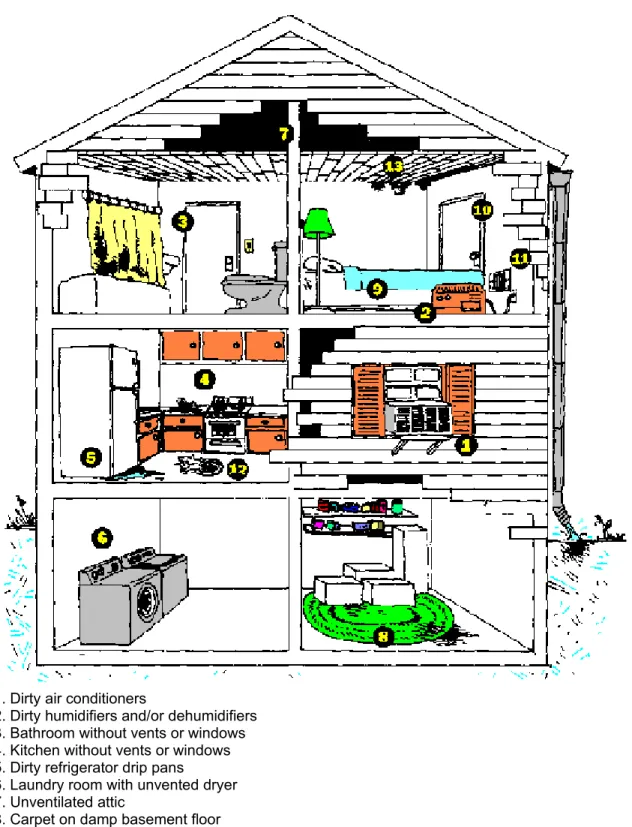
1. Dirty air conditioners
2. Dirty humidifiers and/or dehumidifiers 3. Bathroom without vents or windows 4. Kitchen without vents or windows 5. Dirty refrigerator drip pans
6. Laundry room with unvented dryer 7. Unventilated attic
8. Carpet on damp basement floor 9. Bedding
10. Closet on outside wall
11. Dirty heating/air conditioning system 12. Dogs or cats
13. Water damage (around windows, the roof or the basement)
Indoor air pollution can affect human health in many ways, ranging from headaches and breathing difficulties to death. Some of these affects exhibit themselves immediately after exposure. Others occur after long periods of exposure. Each person has a different level of susceptibility to indoor air pollution. Some individuals are hardly bothered while others have acute sensitivity to the smallest levels. Many variables, in combination, determine likely health impacts from exposure. These include a person's age, existing lung function, the concentration of pollutants, and the duration of exposure.
Within residential buildings, a variety of technologies are used to control indoor pollution. These include measurement & monitoring devices such as carbon monoxide and radon detectors, ventilation
improvements, and home air cleaning equipment and systems. Because there are many more indoor pollutants within workplaces, particularly shops and factories, there are a large number of commercial scale indoor air technologies. These include filters, humidifiers and dehumidifiers, dust collection systems, fume extractors, and ventilation systems.
Local Pollution
Changes in atmospheric chemistry that result in impacts on human health or the environment can often occur outside as well. These changes are typically known as air pollution, of which there are two principal kinds, pollution that is released from a single, identifiable source, known as a point source and pollution that comes from a large number of dispersed sources, known as non-point or area sources of pollution. Point sources of air pollution include toxic trace compounds emitted from specific industries. This type of pollution, known as local air toxics, presents an air quality problem in the vicinity of these industries. These pollutants include heavy metals such as beryllium, cadmium, and mercury, organic compounds such as aldehydes and furans and radioactive particles and gases. Occasionally, large-scale toxic emissions from industrial facilities, such as the industrial accident in 1984 in Bhopal, India, pose severely deleterious effects on human health. Other localized air quality concerns include noxious odors from industrial facilities, landfills, and sewage treatment facilities.
A number of processes & technologies are used to control local air pollutants and odors. Of particular importance is detection equipment and systems as many of these compounds are highly toxic to humans. Processes include distillation, extraction, incineration, control, biofiltration, and removal. Technologies include toxic gas analyzers, monitors and detectors, hood fans, exhaust systems, chemicals and scrubbers.
References
Local Pollution – Activity Sheet
The following exercise is designed to acquaint you with point sources of pollution in your neighborhood. The exercise utilizes the EPA’s Envirofacts website. Envirofacts allows users to search and find out information about pollution sources anywhere in the United States. You can also identify point sources of pollution in your neighborhood, learn about specific facilities, and create maps.
To begin with, go to http://oaspub.epa.gov/enviro/ef_home2.air and enter your zip code. What will be displayed is a list of facilities in your zip code that have been issued an
environmental permit. Scroll over to the “Stacks” column and then down the page. “Stacks” refers to smokestacks at a given facility. Most of the facilities listed may not have a stack.
Scroll down the column until you locate the facility in your neighborhood with the greatest number of stacks. If you find that none of the facilities in your zip code have a stack, try a zip code from a neighborhood near you, or enter the name of a city and state near where you live, until you find a facility that does have a stack. Once you’ve located a facility with the most stacks, click of the number of stacks for that facility, highlighted in blue and information about that specific facility will be displayed. Scroll down the listing until you come to “CLASS CODE”. This code indicates whether the facility is a major or minor discharger of pollutants.
1. What is the zip code or city/state used for your answers to this activity? 2. Is the facility you highlighted a major or minor discharger of pollutants? 3. How can you tell?
Now, look at the “Compliance Status” Code. 4. Is the facility in, or out of, compliance? 5. How can you tell?
6. Do you think that this database is a useful tool? Why or why not?
7. Does this information make you feel better, or worse, about where you live? Explain your answer.
Urban Air Quality
Most of the facilities, technologies, or devices that combust fuel and/or release trace amounts of gases into the atmosphere are found in urban areas simply because that is where the bulk of human activities occur. Most air pollution, therefore, is found in cities. As humans, our lungs have evolved over the millennia to breathe a specific combination of gases. If this combination is altered, even just a little bit, our ability to breathe, how far we can see, and how we feel can be affected. We’ve already seen how a small change in the amount of carbon monoxide in the air we breathe can have huge impacts on our health.
There are a number of other gases and substances that are released in urban areas, besides carbon monoxide, that can affect human health. These include sulfur dioxide (SO2),
nitrogen oxides (NOx), tropospheric ozone (O3), volatile organic compounds (VOCs) or
grouped in a number of ways such as, gaseous or particulate, primary or secondary, and stationary or mobile.
Primary air pollutants are those that are discharged directly into the atmosphere, such as car exhaust. In many cases, these primary air pollutants mix together to form other gases known as secondary air pollutants. Secondary air pollutants are formed in the atmosphere through a variety of chemical reactions, such as the photochemical reaction that creates tropospheric ozone. Ozone, or O3, is a secondary air pollutant found in most of the world’s
major cities. Ozone forms when volatile organic compounds, or VOCs, and nitrogen oxides (NOx) react with oxygen in the presence of sunlight. Ozone found in cities is a respiratory
irritant and affects lung function of asthmatics and the elderly. The Clean Air Act regulates tropospheric ozone. The National Ambient Air Quality Standard (NAAQS) for ozone is 125 parts per billion, or ppb.
Stationary sources of air pollution are usually discrete industrial sites and other fixed sources of emissions. Less than half of the air pollution found in cities, about 40%, comes from stationary sources. Stationary sources include electricity generating power plants, residences heated by wood, incinerators and industrial facilities such as refineries, chemical factories, iron and steel production and processing plants, glass factories, food production plants, cement works, and large fuel or oil storage facilities.
Mobile air pollution sources account for the bulk of urban air pollution, around 60%. The principal mobile source is the automobile, although other fuel burning mobile sources, such as ships, boats, and aircraft contribute as well.
Part 2
In this final section of the exercise, you’ll take a look at air quality near where you live. To begin with go to http://www.epa.gov/airnow/ click on the “Air Quality Index” link, and answer the following questions.
1. What is the Air Quality Index? 2. What scale does the AQI use?
3. At what point does air become unhealthy to breathe? 4. At what point does air become hazardous?
Click on the “Where You Live” link and then on the state you live in. 5. What are the current conditions:
For particulates? For ozone?
Now click on the “Archives” link and then on your region (the regions are represented by different colors). Select “December 2003”.
6. What happened?
7. Why would “ozone season” occur in the months of May through September?
your region reached the “Unhealthy for Sensitive Groups”, “Unhealthy”, or “Very Unhealthy”. Record your results below.
Month “Unhealthy for Sensitive Groups” “Unhealthy” “Very Unhealthy”
May 2003 June 2003 July 2003 August 2003 September 2003
8. Which month had the greatest number of “Unhealthy for Sensitive Groups”,