MOVING PEOPLE, MOVING PATHOGENS: POPULATION MOVEMENT AND DISEASE EMERGENCE IN THE DEMOCRATIC REPUBLIC OF THE CONGO
Corinna Keeler
A dissertation submitted to the faculty of the University of North Carolina at Chapel Hill in partial fulfillment of the requirements for the degree of Doctor of Philosophy in the
Department of Geography
Chapel Hill 2020
ABSTRACT
Corinna Keeler: Moving People, Moving Pathogens: Population movement and disease emergence in the Democratic Republic of the Congo
(Under the direction of Michael Emch)
This project investigates relationships between geography, demography, and infectious disease epidemiology in the Democratic Republic of the Congo (DRC). The DRC experiences frequent outbreaks of preventable and treatable diseases, and has been shown to be a corridor of infectious disease transmission between different regions of Africa. In the absence of a recent national census, there is a need for empirical evidence about demographic characteristics of the DRC, such as the population size and human movement patterns, to inform epidemiological estimates and infectious disease surveillance and control efforts.
Researchers have increasingly turned to gridded population datasets to calculate population size for the DRC; however, little work has been done evaluating concordance between population estimates obtained from different gridded datasets. I find that even though population estimates at the national level are similar between gridded population data sources, the subnational structure of the population at the province and health zone level is significantly different between LandScan and WorldPop data, and use the case study of a bednet distribution campaign to illustrate the relevance of these findings for implementing disease control measures.
and model the relationship between demographic and employment characteristics and circulatory mobility. I also examine geographic patterns in resettlement migration as well as the dominant motivations for migration among respondents in the survey dataset, given the significance of understanding population movements for measuring infectious disease outcomes.
ACKNOWLEDGEMENTS
The process of spending mumble years in graduate school and writing a dissertation has given me a visceral understanding of the many ways in which research is a collaborative effort – in generating and refining ideas; in maintaining both personal and scholarly perspective; and in making meaning out of maps, numbers, and words. I am so grateful to my committee, my family, and my intersecting UNC communities in Geography, IDEEL, and CPC for being part of the iterative process of this project.
Mike, thank you for all of the advice and guidance you’ve given me, both in general and for this project, and for your willingness to debate with me about critical geography. Steve, thank you for encouraging me to run with ideas, and using the creativity and rigor that you bring to scientific inquiry to help me make this project actually happen. Jonathan, thank you for sharing your clinical knowledge and experience in the DRC to help me make this project as applied and relevant as possible. Paul, thank you for the clarity with which you think about (and explain!) spatial and statistical methods. Conghe, thank you for representing the best of how geographers can integrate spatial science with insights from the breadth of our discipline.
TABLE OF CONTENTS
List of Figures ... xi
List of Tables ...xii
List of Abbreviations ... xiii
Chapter 1. Introduction ... 1
1. Study Site: The Democratic Republic of the Congo ... 3
1.1 Description of study site ... 3
1.2 Disease outbreaks in the DRC ... 5
2. Literature Review ... 8
2.1 Health Geography... 8
2.1.1 Health geography, population science, and public health ... 8
2.1.2 Theoretical Frameworks and Disease Ecology ... 10
2.2 Demography ... 12
2.2.1 Migration, Population Mobility, and Human Movement ... 12
2.2.2 Relationships Between Human Movement and Infectious Disease ... 14
2.2.3 Measuring Human Movement ... 15
2.3 Yellow Fever Epidemiology ... 17
2.3.2 Yellow Fever Virus Transmission ... 19
3. Dissertation structure and key contributions ... 21
3.1 Summary of Chapter 2 ... 21
3.2 Summary of Chapter 3 ... 21
3.3 Summary of Chapter 4 ... 22
Chapter 2. The Devil’s in the Denominator: The relationship between population data selection and uncertainty in epidemiological estimates in the DRC ... 23
1. Introduction and Literature Review ... 23
2. Data and Methods ... 26
2.1 Data ... 26
2.2 Population Enumeration Methods ... 26
3. Results ... 27
3.1 National population ... 27
3.2 Province-level populations... 28
3.3 Health zone-level populations ... 29
3.4 Case study application of unmet bednet need in the DRC ... 31
4. Discussion and Conclusion ... 32
5. From Population Structure to Population Movement ... 35
Chapter 3. Nationwide trends in both circulatory and migratory population movement in the Democratic Republic of Congo: Evidence from two cross-sectional studies ... 36
1. Introduction ... 36
3. Data and Methods ... 40
3.1 Description of data sources ... 40
3.2 Methods for circulatory movement ... 41
3.3 Methods for migratory movement ... 43
4. Results ... 44
4.1 Results for circulatory movement ... 44
4.1.1 Sample characteristics and descriptive findings ... 44
4.1.2 Logistic Regression ... 45
4.2 Results for migratory movement ... 48
4.2.1 Sample characteristics and descriptive findings ... 48
4.2.2 Geographic analysis of migration flows ... 53
5. Discussion and Conclusion ... 55
6. From movement of people to the spread of disease ... 60
Chapter 4. Geography and epidemiology of yellow fever virus in the Democratic Republic of Congo ... 61
1. Introduction ... 61
2. Background and Literature Review ... 61
3. Data and Methods ... 64
3.1 Data ... 64
3.2 Spatial and Temporal Patterns in YFV Occurrence ... 65
4. Results ... 69
4.1 Temporal patterns in YFV in the DRC ... 69
4.2 Spatial patterns in YFV in the DRC ... 71
4.3 Relationships between YFV and environmental and demographic variables ... 72
5. Discussion and Conclusion ... 73
Chapter 5. Conclusion and future directions ... 77
Appendix I: Supplemental Materials for Aim 1 ... 79
Appendix II: Supplemental Materials for Aim 2 ... 84
Appendix III: Supplemental Materials for Aim 3... 89
LIST OF FIGURES
Figure 1. Timeline of national cross-sectional surveys in the DRC ... 4
Figure 2. Meade's triangle of disease ecology ... 11
Figure 3. Theorized relationships between migration and infectious disease transmission ... 14
Figure 4. Data for measuring human population movements ... 16
Figure 5. Diagram of YFV transmission ... 20
Figure 6. Province-specific population comparison between LandScan and WorldPop ... 29
Figure 7. Health-zone specific population comparison between LandScan and WorldPop ... 30
Figure 8. Estimation of unmet bednet need by province ... 32
Figure 9. Relationships between urbanicity and permanent migration ... 52
Figure 10. Motivations for permanent migration by gender ... 52
Figure 11. Geographic patterns in permanent migration ... 54
Figure 12. Reported YFV cases and percentage of health zones with YFV cases ... 70
Figure 13. Seasonality in reported YFV cases ... 70
Figure 14. Total YFV cases and total YFV deaths reported by health zone ... 71
Figure 15. Number of years with at least one reported YFV case by health zone ... 72
Figure 16. Comparison of the spatial population structure by province in the DRC ... 80
Figure 17. Province population means across four GP datasets ... 81
Figure 18. Correlation matrix of similarity in province-level population estimates ... 82
Figure 19. Correlation matrix of similarity in health zone-level population estimates ... 82
Figure 20. Health zone level coefficient of variation across four GP datasets... 83
Figure 21. IDSR case definition for yellow fever from the technical manual. ... 89
Figure 22. Comparison of IDSR reports and cases between YFV and cholera in the DRC. ... 90
Figure 23. Cases and deaths due to suspected YFV in the DRC ... 91
LIST OF TABLES
Table 1. National population of the DRC in 2010 and 2015 ... 28 Table 2. Nationally representative cross-sectional surveys in the DRC containing
information about human movement included in this study ... 41 Table 3. Logit models of circulatory mobility and demographic characteristics,
stratified by gender ... 46 Table 4. Employment sector logit model of circulatory mobility and employment ... 47 Table 5. Demographic characteristics of Enquéte 1-2-3 respondents who reported
migratory mobility, stratified by gender ... 50 Table 6. Number health zones with IDSR reporting, YFV observations, and YFV cases for each year of the study period ... 65 Table 7. Model parameters for best fit model for each YFV outcome ... 73 Table 8. Weighted sample characteristics of adults in the 2013-14 DHS Survey,
stratified by gender. ... 84 Table 9. Weighted sample characteristics of adults in the 2013-14 DHS Survey,
stratified by gender and mobility status ... 85 Table 10. Full logit model of mobility among men ... 86 Table 11. Relative fit of logit models of mobility among men ... 87 Table 12. Demographic characteristics of all adults in the 2012 Enquéte 1-2-3 survey,
LIST OF ABBREVIATIONS
AFRO World Health Organization Regional Office for Africa AIC Akaike Information Criterion
CDC United States Centers for Disease Control DHIS-2 District Health Information Software 2 DHS Demographic and Health Survey DON Disease Outbreak News
DRC Democratic Republic of the Congo GHS Global Human Settlement Data GPW Gridded Population of the World HIV Human Immunodeficiency Virus
HZ Health Zone
IDP Internally Displaced Person
IDSR Integrated Disease Surveillance and Response ITN Insecticide Treated Net
MMWR Morbidity and Mortality Weekly Report
UN United Nations
UNHCR United Nations High Commission on Refugees
UNOCHA United Nations Office for the Coordination of Humanitarian Affairs USAID United States Agency for International Development
CHAPTER 1. INTRODUCTION
The World Health Organization’s online archive of Disease Outbreak News alerts begins in 1996 and continues into 2020, with weekly updates regarding every disease outbreak that the WHO is currently monitoring due to concern about significant local public health impact or international spread1. In the 25 years represented in this online archive, the Democratic Republic
of Congo (DRC) is the only country that has had disease outbreaks every single year that rise to the level of reporting in the WHO Disease Outbreak News system. The disease alerts for the DRC span viral, bacterial, and protozoan diseases; they discuss vector-borne, water-borne, and person-to-person transmission, and they range in geographic scope from documenting
nationwide cholera epidemics to two cases of polio in a single health zone. No other nation has as many disease outbreak reports, regarding as many different diseases, at as many different time points.
Throughout this archive, several themes emerge regarding 25 years of disease outbreaks in the DRC. One such theme is the challenge of public health surveillance, intervention
implementation, and disease control in a country as geographically large and varied as the DRC. Another significant theme that arises in the collection of Disease Outbreak News bulletins is the role of the DRC’s highly mobile population in propagating and complicating disease outbreaks, with frequent mentions of refugee movements, travel for seasonal labor, and rural migration to
cities. A third theme is uncertainty in population measurement of various cities and provinces in the DRC, which adds a layer of complexity to enumerating susceptible populations and
estimating vaccination needs.
This dissertation project is grounded questions about geography, demography, and infectious disease epidemiology that arise repeatedly in the archive Disease Outbreak News alerts for the DRC. The uncertainty surrounding population distribution and population movement in the DRC inherently complicates public health measures and disease surveillance efforts, even as these uncertainties stem from many of the same aspects of the DRC’s physical and cultural geography that render it susceptible to frequent disease outbreaks: the large and environmentally varied land area of the country, its relative political instability and ongoing civil violence, and its lack of infrastructural development compared to neighboring nations in sub-Saharan Africa. Against that backdrop, this project undertakes three interrelated aims: first, to examine the spatial distribution of the DRC population at relevant administrative units in order to provide insight into the “denominator” during disease outbreaks; second, to characterize
nationwide patterns of human movements in the context of the relationship between population movement and infectious disease exposures; and finally, to examine the geography and
epidemiology of yellow fever virus in the DRC in light of the demographic insights from the first two aims.
and ground this project. Finally, I introduce the structure of the dissertation, including the primary research question and approach of each chapter.
1. Study Site: The Democratic Republic of the Congo
1.1 Description of study site
Perhaps it is unorthodox to start the introduction to this project with a careful
examination of the study site instead of the theoretical framework or methodological approach, but there are particular characteristics of the DRC that inform every other aspect of the project and render a study site description a necessary first step. Indeed, while I can cite that the DRC is the largest country in Sub-Saharan Africa by land area, second only to Algeria on the continent (United Nations, 2016), it is difficult to make a similar comparison in terms of population because there has not been a national census since 1984. In “From Figures to Facts: Making sense of socioeconomic surveys in the DRC,” Marivoet and De Herdt outline the difficulty of research, administration, and planning in the DRC without reliable population information. Their observation is so salient to the work presented in this dissertation that I am including it here in full:
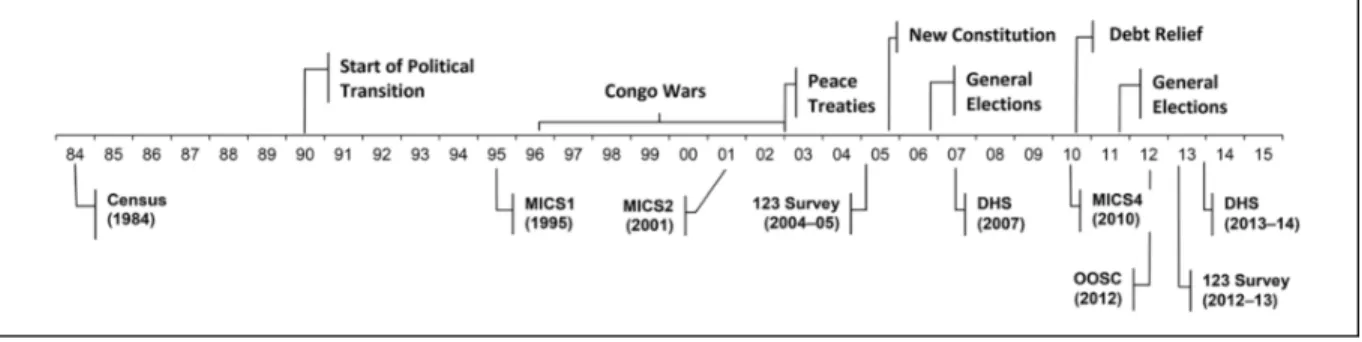
In the absence of a national census, there have been a series of cross-sectional population-based surveys in the DRC, mostly since 2000, which focus on various outcomes including out-of-school children, demographics and health, and livelihoods. The timing of these surveys is described in Figure 1. This project incorporates data from the two most recent of these national surveys, the Enquéte 1-2-3 conducted in 2012 and the Demographic and Health Survey (DHS) conducted in 2013-2014. In the years between the 1984 national census and these two surveys, the DRC experienced an ongoing period of civil and ethnic violence referred to as the Congo Wars, creating large numbers of internally displaced persons (IDPs) and refugees; violent conflict, forced displacement, involuntary movement continued to be a challenge in the country well beyond the peace treaty that putatively ended the war (Tamm, 2016; UNHCR, 2014).
Figure 1. Timeline of national cross-sectional surveys in the DRC, compared to the most recent census and key political events. Figure from Marivoet and De Herdt (2018).
secondary health administrative unit is the health zone (N=515). The land area of the DRC is approximately 2,345,000 square kilometers, approximately 25% as large as the United States.
1.2 Disease outbreaks in the DRC
I examined the full archive of WHO Disease Outbreak News (DON) alerts in the DRC in order to understand the challenges to disease control efforts that have persisted in the DRC, and used this qualitative analysis to guide my own research. As discussed above, the DRC is the only nation to have a disease outbreak that rises to the level of reporting as a DON alert in every year of the online archive, 1996 to present. My qualitative synthesis of the major trends and themes in this archive not only positions my dissertation in relation to outstanding questions about the geography of disease outbreaks in the DRC, but also contextualizes the landscape of infectious disease research, intervention, and control throughout the country in recent history.
There are 180 DON alerts regarding the DRC in the online archive. I applied a qualitative coding scheme to each DON document, coding for the following items: the disease(s) of
concern; the province, health zone, and/or geographic area affected; actors involved in disease response including government agencies/ministries, private organizations, and non-governmental organizations; whether the alert pertained to a new outbreak or was an update on a previously documented outbreak; major risk factors described in the document; major transmission pathways described in the document; and discussion of migration, mobility, or population movement.
44 disease outbreaks. The topics of the updates range from documenting further geographic expansion or increased infection rates of the outbreak, to announcing newly implemented diagnostic criteria or control measures, to broadcasting that an epidemic had concluded. In particular, I noted that there were four yellow fever virus (YFV) outbreaks documented in the DON archives; all of them were in the past 10 years, in 2010, 2013, 2014, and 2016.
The challenges introduced by the lack of census data in the DRC are reflected in the DON archive. During an outbreak of Ebola in 2018, the DONs referred to concern over the proximity of the outbreak to Mbandaka, a large city in the northern part of the DRC which is also a major port on the Congo River with travel and trade connections to both Republic of Congo and Central Africa Republic. The DON alert dated May 14, 2018 refers to the fact that the outbreak had reached “Wangata health zone [which is] adjacent to the provincial port city of Mbandaka (population 1.2 million).” However, in the following week, an update on the same outbreak dated May 17, 2018 reads: “Mbandaka City … has a population of approximately 1.5 million people.” As the WHO and international partners were in the process of stockpiling vaccine supply to enact experimental ring vaccinations to control the outbreak, this discrepancy in population has clear ramifications for health planning.
to a mid-sized village after several weeks away. There are eight distinct Ebola outbreaks documented in the archive, and over half identify the index case as either a farmer or a miner.
Finally, even without specific mention of the direction or cause of the mobility, the highly mobile population of the DRC is invoked in the DON archive as a reality that complicates infectious disease control in the country. A representative quote can be found in a March 21, 2019 DON update for the ongoing Ebola outbreak in the northwest part of the DRC: “Given the geographical spread of the epidemic and the high mobility in this region, the risk of Ebola spreading to unaffected areas or being reintroduced to previously affected areas remains high.” In the qualitative analysis, we examined mentions of migration, mobility, and porous borders. Often, these codes were mentioned in relation to each other, as with this May 2, 2016 DON alert about the large yellow fever outbreak affecting the DRC and Angola: "Kongo Central province shares a long, porous border with Angola … movement of people between Angola and DRC has [caused] the regular importation of viraemic cases from Angola. The report of Yellow Fever infection in travellers and workers returning from Angola also highlights the risk of international spread of the disease." Porous borders were mentioned in nearly 20% of DON alerts.
The insights from reviewing these alerts add context and motivation to the research aims of this dissertation. The significance of the relationship between human movement and
2. Literature Review
This project draws three distinct bodies of literature to inform the interdisciplinary synthesis of geography, demography, and infectious disease epidemiology. From health
geography, I use Meade’s Triangle of Disease Ecology as a guiding framework for considering how culture, environment, and behavior shape disease outcomes in space and time. From demography, I employ theories of migration and population mobility to distinguish between different types and routes of population mobility and hypothesize the mechanisms by which human movement and infectious disease outcomes interact in the DRC. From infectious disease research, I draw on the clarity and specificity with which researchers describe core
epidemiological concepts such as transmission, surveillance, and diagnosis in my analysis of yellow fever virus in the DRC.
2.1 Health Geography
2.1.1 Health geography, population science, and public health
The subdiscipline of health geography contributes to public health research in two major ways: by offering a methodological toolbox to add spatial and space-time variables into
epidemiological and biomedical models of disease, and by contributing theoretical and
conceptual frameworks that make explicit the role of geographic context and spatial processes in mediating, causing, or complicating health outcomes. These methodological and theoretical contributions can be traced from the foundations of modern health geography; in fact, they are inherent in the origins of the sub-discipline if we examine the work of Jacques May.
fully explain the patterns he was observing in health and disease within the clinic (Emch et al., 2017). He began to create maps of disease distribution and disease vectors to better understand the role of geographic context and the spatial distribution underlying these disease outcomes, and theorized the early foundations of disease ecology by claiming that diseases have organic,
inorganic, and social-cultural stimuli (May, 1959). While potentially simplistic by modern standards, May’s work laid the groundwork for the contributions that modern health geography makes to population health research: theoretically, where you live matters for your health; methodologically, spatial mapping of diseases can tell us something useful about public health outcomes.
May is thought of as the father of modern medical geography, and his work laid the groundwork for innovations in the field over the subsequent decades by John Hunter and Melinda Meade, among others, who both built on May’s initial disease mappings to extend and complicate medical geography and disease ecology into a more nuanced subfield (Hunter & Young, 1971; Meade, 1977). In his chapter in A Companion to Health and Medical Geography (2009), Mayer claims that the subfield of medical geography should really be called
epidemiological geography or public health geography, reflecting his view that the contributions of medical geographers are an essential part of epidemiological science and public health
Mayer’s observation underscores the methodological contributions that medical geography makes to public health in the modern day. Methods such as spatial statistics (e.g. clustering or hotspot analyses), multilevel modeling, remote sensing, and landscape genetics have their roots in medical geography and have become a core part of epidemiological analysis. Similarly, these spatial tools have also become an essential part of public health practice, as GIS and remote sensing approaches are frequently employed for public health planning of
interventions, targeting treatments, and notably for evaluating health care access. This
dissertation project builds on the existing interdisciplinary relationships between public health, population science, and health geography to apply spatial tools to questions of population change and disease clustering in the DRC.
2.1.2 Theoretical Frameworks and Disease Ecology
A core contribution that health geography makes to the fields of population health and public health is the introduction of rigorous theoretical frameworks that hypothesize the
Figure 2. Meade's triangle of disease ecology. Figure adapted from Meade (1977) by Corinna Keeler for publication in Emch, Carrell, and Root (2017).
Meade’s triangle of disease ecology frames a disease outcome or state of health in terms of three contexts – population, including genetic factors, gender, age and other demographic characteristic; environment, including natural, social, and built environments; and culture, including cultural beliefs, social organization, individual behaviors, and technology. By
2.2 Demography
2.2.1 Migration, Population Mobility, and Human Movement
Population movement is a conceptually complex demographic category that encompasses a wide variety of human behaviors including migration, commuting, travel, and other forms of mobility (Petersen, 1958). Prothero (1977) theorized the role of human movement in
epidemiology, identifying two major types of movement: circulatory and migratory. In this valuable typology, circulatory movement refers to movements where individuals return home after some period of time. Circulatory movement includes anything ranging from short term travel, to migration for seasonal employment, to temporary relocation where the individual returns home (Prothero, 1977). On the other hand, migratory movement refers to a permanent change of residence, with no intention to return to the previous place of residence.
Bell and Ward provide an update to Prothero’s framework, distinguishing between temporary mobility and permanent migration (2000) as two dominant types of human
movements. Their theorization extends previous work by disentangling the temporal dimension of human movement into three distinct components: duration, seasonality, and frequency (Bell, 2000). Both circulatory and migratory population movements are often theoretically framed and empirically analyzed in terms of push and pull factors (Hristoski & Sotiroski, 2012; Maclin et al., 2017). In this literature, push factors are drivers of out-migration from a certain place, ranging from environmental variables like drought to political variables such as armed conflict (Findlay, 2011; Warner et al., 2010); pull factors are those that incentivize in-migration to a certain place, such as employment opportunities (Hristoski & Sotiroski, 2012).
(Vlassenroot & Huggins, 2004a) found that under economic pressure, many young men in Eastern DRC opted to migrate seasonally for work, with rates of economic temporary migration increasing steadily during their study period of 1993-2003. Other studies have found similar patterns in seasonal migration due to participation in farming and mining sectors, especially among men (Geenen, 2014; Maclin et al., 2017). These studies have largely been limited to small study areas or convenience samples (i.e. the employees in a single mine), but have provided valuable data on the typical “push” and “pull” factors for entry into seasonal migration in DRC (Rustad et al., 2016).
2.2.2 Relationships Between Human Movement and Infectious Disease
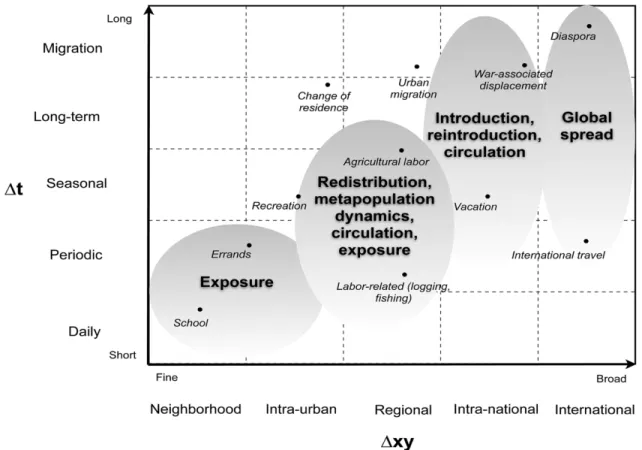
Both circulatory and migratory population movements have significant impacts on the transmission dynamics of infectious diseases, and on epidemiological surveillance efforts and public health interventions. Stoddard and colleagues theorize the role of human movement on vector-borne disease transmission across spatial and temporal scales (Stoddard et al., 2009). They posit that the spatial range of movements, ranging from local to regional to international, intersect with the duration of migration to produce different disease dynamic outcomes. In a key figure from their paper, below, they diagram some of the implications of varying spatial and temporal scales of migration.
This figure illustrates that the spatial and temporal scale of population movement intersect to determine the relationship between of population movement and infectious disease dynamics. Activities that occur at the same spatial scale but different temporal scales (such as international travel and diaspora migration) or the same temporal scale but different spatial scales, have different implications for infectious disease transmission.
Human population movements not only impact disease transmission itself, but also the ability of public health practitioners and clinicians to correctly measure case counts and disease rates for planning and intervention purposes. Human population movement can bias disease surveillance efforts by introducing error to both the numerator and the denominator in estimates of disease incidence and prevalence (Buckee et al., 2017). Biases to the numerator occur when cases are misdiagnosed, unreported, or reported in an incorrect location due to travel, circulatory movements, or migratory movements (Buckee et al., 2017; Tatem, 2014). Biases to the
denominator are driven by the difficulty of enumerating migrant or mobile populations, which could cause inaccuracies in measuring the underlying population structure, as well as seasonal changes to geographic population distribution that impact the population at risk of seasonal infections (Bharti et al., 2011; Buckee et al., 2017).
2.2.3 Measuring Human Movement
Beginning over 20 years ago, airline networks and rail networks were broadly available, allowing researchers to use the networked routes and, occasionally, passenger volumes as a proxy for large-scale international or regional movements (Balcan et al., 2009; Brockmann & Helbing, 2013). However, it remains difficult to measure circulatory and migratory population flows that occur via ground transportation, despite the fact that ground transportation is a more common mode of population movement and is hypothesized to drive a much higher share of disease diffusion than migration by plane or train (Pindolia et al., 2012; Tatem, 2014).
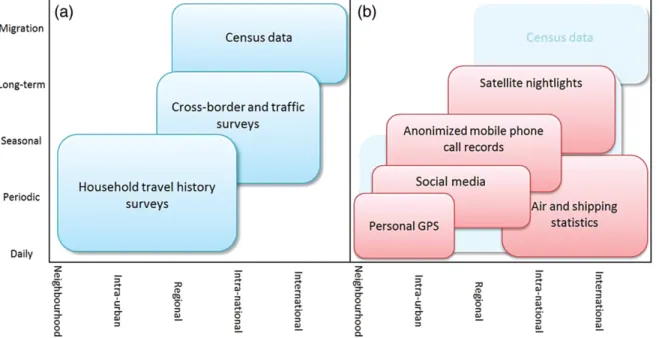
The figure below from Tatem (2014) summarizes the data available to quantify human population movements, although notably many of the datasets diagrammed in the figure are not available for many locations nor for many time periods.
Figure 4. Data for measuring human population movements. Figure is from Tatem (2014). The x-axis represents spatial scale of population movement, from neighborhood to international. The y-axis represents temporal scale, from daily commuting to permanent resettlement.
In this diagram, Tatem makes a distinction between “pre-21st century” data sources
only used as proxies where census data are not available. Additionally, data sources such as cell phone records and geo-located social media introduce their own questions of geographic
accuracy and whether they are adequately representative (Hay et al., 2013). Cell phone data is seen as the best possible movement data available in many parts of the world (Kraemer et al., 2017a; Ruktanonchai et al., 2016), however its utility is limited by its population coverage, the density of cell towers, and finally data access challenges for researchers (Pindolia et al., 2012). Some recent studies have compared census data to cell phone data and found similar
relationships between human movement and malaria incidence using both types of data (Garcia et al., 2015; Wesolowski et al., 2013) analysis of benefits of cell phone data versus benefits of census data.
Finally, where none of these empirical or proxy datasets are available, scholars have turned to modeled data. One common approach is to fit a gravity or spatial interaction model on available data in a neighboring country, then apply that model to simulate population movement in the country of interest. This approach has been used to simulate internal migration flows in every malaria-endemic country (Garcia et al., 2015), and to extrapolate population movement in Angola during a Yellow Fever outbreak based on cell phone records from Namibia (Kraemer et al., 2017a).
2.3 Yellow Fever Epidemiology
2.3.1 Yellow Fever Virus Worldwide
Despite the fact that an effective vaccine has existed since 1937, local outbreaks of yellow fever have persisted in parts of Africa, Central America, and South America, with
A 2015-2016 outbreak in Angola and DRC reached the capital cities of both countries, and more recently a 2017 outbreak in Brazil reached Sao Paolo, by some metrics the most populous city in the Western hemisphere (Vasconcelos & Monath, 2016). Yellow fever is an arbovirus vectored by the Aedes aegypti mosquito, the same mosquito that acts as the vector for dengue and zika viruses. The two recent yellow fever outbreaks highlighted a shortage of vaccine (Paules & Fauci, 2017), and prompted a resurgence in yellow fever modeling efforts to simulate worldwide risk areas, model unmet vaccine demand, and examine the epidemiological dynamics of yellow fever outbreaks (Kraemer et al., 2017a; Shearer, Longbottom, et al., 2018; Shearer, Moyes, et al., 2018a).
In the wake of the Angola/DRC outbreak and the Brazil outbreak, several commentaries have focused on the global health risk posed by the possibility of international spread of YFV (Barrett, 2018; Woodall & Yuill, 2016). The 2015-16 outbreak in Angola and the DRC resulted in the first documented occurrence of YFV importation to Asia (Ahmed & Memish, 2017), as 11 confirmed cases in China were traced to the Angola outbreak. This importation sparked concern among researchers, clinicians, and policymakers, as China and much of Asia have densely populated communities of susceptible people, and have been shown to have large populations of the competent mosquito vector Ae. Agypti (Ahmed & Memish, 2017; Wasserman et al., 2016). Several recent modelling studies have examined risk of importation of YFV to naïve locations due to travel and migration (N. R. Faria et al., 2018; Wilder-Smith & Leong, 2017), and
2.3.2 Yellow Fever Virus Transmission
YFV circulation in Africa has been shown to occur in three interrelated transmission cycles: the sylvatic or “jungle” cycle, the savannah or “intermediate” cycle, and the urban or “urban epidemic” cycle (Ahmed & Memish, 2017; Wasserman et al., 2016; Wilder-Smith & Leong, 2017). These interrelated transmission cycles have implications for assessing the drivers of YFV re-emergence, which has been shown to occur more often in areas with recent
deforestation and during years with higher than average temperature and rainfall levels
(Carrington & Auguste, 2013; Shearer, Longbottom, et al., 2018). Figure 5 shows the three YFV transmission cycles, along with key vector species implicated in each distinct cycle.
The sylvatic, or jungle, transmission cycle occurs between arboreal mosquito species such as A. africanus and non-human primates, primarily in forested areas, and allows for the maintenance of an enzootic disease reservoir that periodically spills over into the human
population. These spillover events create the savannah or intermediate transmission cycle, which refers transmission between mosquitoes and humans within forests or, more typically, at the forest edge (WHO, 2018). Frequently, this transmission occurs between forest mosquitoes that have experienced habitat disturbances (such as deforestation), bringing them into contact with forest workers or agricultural workers at the forest fringe and therefore resulting in YFV spread within small rural communities (Carrington & Auguste, 2013; Monath & Vasconcelos, 2015).
outbreaks of YFV that established urban transmission cycles. In 2015-2016, a YFV outbreak that originated in Angola spread to the DRC, resulting in 16 affected provinces in Angola and 8 affected provinces in the DRC, with confirmed cases in the capital cities of both countries (WHO 2016, Kraemer et al., 2017). Shortly thereafter, a YFV epidemic in Brazil reached the large cities of Sao Paolo and Rio de Janiero, which both have metropolitan populations of over 10,000,000 and were previously understood to be outside the YFV transmission risk zone (N. R. Faria et al., 2018; WHO, 2017b).
3. Dissertation structure and key contributions
My project draws on the literatures and frameworks described above to explore three interrelated aims. I will describe the primary research questions, data, and findings of the aims below.
3.1 Summary of Chapter 2
The primary aim of Chapter 2 is to describe the spatial population structure of the DRC, given the lack of modern census data described above. The underlying spatial population structure of the DRC has far-reaching implications for infectious disease interventions and control measures. Increasingly, researchers have turned to gridded population datasets such as LandScan and WorldPop to calculate population size for the DRC, however little work has been done evaluating concordance between population estimates obtained from different gridded datasets. This chapter finds that even though national total population estimates are fairly similar between gridded population data sources, the subnational structure of the population at the province and health zone level is drastically different between LandScan and WorldPop data. In order to demonstrate the effect that the selection of population data has on public health
intervention efforts, I use the case study of a bednet distribution campaign to illustrate the relevance of understanding the accurate population denominator for implementing disease control measures.
3.2 Summary of Chapter 3
diseases, however these relationships are often invoked in the case of DRC disease outbreaks without evidence-based links between migration and disease outcomes. The aim of this chapter is to characterize patterns of two distinct types of human movement in the DRC: circulatory
mobility, in which people leave home for short- or medium-term durations then return to their home, and resettlement migration, in which people leave without intending to return. I draw on two large cross-sectional population-based surveys that were administered in the DRC in 2012 and 2013 to construct estimates of the rates of each of these types of migration in the DRC, and model the relationship between demographic and employment characteristics and circulatory mobility. I also examine geographic patterns in resettlement migration as well as the dominant motivations for migration among respondents in the survey dataset.
3.3 Summary of Chapter 4
In Chapter 4, I examine the spatial and temporal patterns of yellow fever virus (YFV) occurrence in the DRC. I use data from the Integrated Disease Surveillance and Response system in the DRC that provides week case reports by health zone for the time period 2005-2017,
CHAPTER 2. THE DEVIL’S IN THE DENOMINATOR: THE RELATIONSHIP BETWEEN POPULATION DATA SELECTION AND UNCERTAINTY IN EPIDEMIOLOGICAL
ESTIMATES IN THE DRC
1. Introduction and Literature Review
Epidemiological estimates of infectious disease burdens and at-risk populations inherently rely on underlying datasets that enumerate the size and spatial distribution of a population. However, in many cases, censuses or other comprehensive sources of population data are outdated or unavailable (Linard & Tatem, 2012). The Democratic Republic of the Congo (DRC), which has not had a national census since 1984 (Marivoet & Herdt, 2014), is one such case. With no modern census data, researchers have relied on population data from gridded population models such as the LandScan dataset and the WorldPop dataset (Lloyd, Sorichetta, & Tatem, 2017). Understanding the underlying population distribution of the DRC has significant implications for health research and health service delivery because the country is the site of several recent and ongoing disease outbreaks.
available at a spatial resolution of 1 km grid squares (Bhaduri et al., 2007). The WorldPop gridded population has been modeled worldwide using country-specific algorithms at two time points, 2010 and 2015, although the WorldPop team has recently released gridded estimates for all of the years between 2000 and 2020 that may have less “tailored geospatial inputs” and methods than the datasets for 2010 and 2015. For all years, these data are available at a spatial resolution of 100m grid squares (Tatem, 2017).
Both datasets are modeled by applying a spatially varying population growth factor to the population count from the most recent national census with administrative boundaries, remotely sensed data, and other supplemental spatial data including road networks, physical geographic features, and settlement locations. However, the specific modeling approach used to
dasymetrically assign population to the grid cells differs slightly between the two datasets, though only WorldPop makes their algorithmic data inputs openly available (Lloyd et al., 2017). Previous studies have reviewed available gridded population datasets and compared these data in terms of their spatial and temporal resolution, modeling approaches, and geographic coverage (Wardrop et al. 2018, Leyk et al. 2019, Linard & Tatem 2012, Lloyd et al. 2017). However, to date no studies have empirically evaluated the differences in gridded population data products within a single country in order to better understand how and where the population estimates differ at national and sub-national levels.
Understanding the differences between the different gridded population models is
(Juran et al., 2018; Kraemer et al., 2017; Nackoney & Williams, 2013). The DRC is an outlier in recency of comprehensive population data, as the United Nations maintains a standard that its member states conduct a census every 10 years (United Nations Population and Housing Programme, 2017) and the DRC is one of just five countries that has not conducted a census since 1985. A quick review of published DRC population estimates illustrates the uncertainty about the population size of the DRC: in 2015 (contemporaneous with the data used in this study), the World Bank estimated the DRC population at 76,244,544, the CIA World Factbook estimated 79,375,136, and the United Nations estimated 77,267,000.
Second, because of the lack of recent census data to inform baseline population estimates and growth factors in these gridded models, the specific modeling differences between the inputs and methods used by WorldPop versus Landscan manifest in significant discrepancies in the modeled spatial population distribution between the two data sources. The differences between these datasets are larger for the DRC than they are for countries in the dataset that have more recent census data available to inform modeling outputs. Therefore, the choice of population data used as a denominator in a given study could strongly impact empirical calculations such as disease burdens, unmet healthcare needs, or expected primary school enrollment that rely on understanding population size and distribution.
use the case study of unmet bednet need in the DRC to illustrate the importance of the underlying population dataset for public health practice and disease control.
2. Data and Methods
2.1 Data
The selection of LandScan and WorldPop data for analysis is described in Appendix I. We obtained the WorldPop datasets from the DRC for 2015 from the Flowminder website. LandScan data were downloaded from the Oak Ridge National Lab website for 2015 in order to temporally match the available WorldPop data. DRC administrative boundaries curated by the United Nations Office for the Coordination of Humanitarian Affairs (UNOCHA) were obtained from the Humanitarian Data Exchange. Selection of administrative boundaries is important because of the gridded nature of the data; small variations in the spatial shape of a province boundary can “reassign” pixels from the gridded population model from one province to another, thus changing the province-level population estimate.
2.2 Population Enumeration Methods
Total populations were enumerated for both WorldPop and LandScan data at three spatial scales: whole-country, province, and health zone level. These spatial scales were selected
within the relevant administrative boundary to generate a total population estimate for the area contained within that specific administrative unit, using the zonal statistics function in ArcGIS 10.5.1.
WorldPop-based population estimates and LandScan-based population estimates were compared at the province and health zone level using correlation coefficients, and areas with the largest magnitude difference in population were identified. We explored the relationships between the discordance in population estimates between the two data sources, and various environmental, economic, and social variables at the province and health zone level that could be relevant for administrative planning, including deforestation, presence of refugees and IDPs, conflict events, and rate of urbanization.
Finally, in order to facilitate a case study application illustrating the effect of population data selection for public health planning, rates of insecticide treated bednet (ITN) ownership were obtained from the 2013-2014 Demographic and Health Survey. By taking the inverse of the ITN ownership rates from the DHS, we generated the proportion of people who did not own a bednet for each province for 2014, or the unmet bednet need. This proportion was applied to the province-level population calculations from both the LandScan and Worldpop datasets, in order to estimate the number of people in need of a bednet as a raw population number instead of a rate. This case study allows us to examine how a bednet distribution campaign might rely on two population characteristics that vary between the LandScan and WorldPop data: the total
population size, and the subnational spatial structure of the population.
3. Results
As shown in Table 1, there were differences in the estimated total population of the DRC for 2015. In order to examine secular trends in DRC population change, we calculated the 2010 population from both population grids as well. WorldPop showed an overall population growth of 12.5% between 2010 and 2015, while LandScan showed an overall population growth of 11.8% between 2010 and 2015. Across both years, WoldPop estimated a larger national population than LandScan.
Table 1. National population of the DRC in 2010 and 2015. Populations are calculated from the WorldPop and LandScan gridded population datasets for both time points. WorldPop estimated a higher overall population in both years.
Data source 2010 DRC population 2015 DRC population
LandScan 70,918,324 79,319,132
WorldPop 72,481,148 81,574,062
3.2 Province-level populations
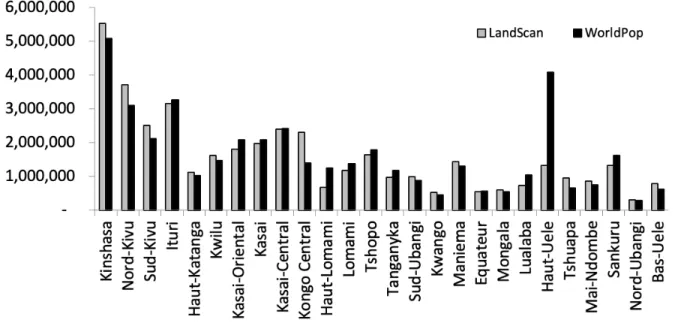
Figure 6. Province-specific population comparison between LandScan and WorldPop for 2015. While the national level population is similar between the two datasets, by examining the underlying spatial structure of the population by dataset it is clear that the spatial distribution of the population across the 26 DRC provinces differs notably between these datasets.
3.3 Health zone-level populations
Of the 515 health zones in DRC in 2015, 111 (21.6%) have a population of at least
WorldPop as compared to LandScan. Figure 7 shows the health-zone level differences in
population in the DRC based on the LandScan and the WorldPop data. By examining differences between the datasets at the health zone scale, patterns in the differences between datasets begin to emerge. The health zones comprising the largest cities in the DRC, including Kinshasa and Lumumbashi, have much larger populations in the LandScan data than the WorldPop data.
Figure 7. Health-zone specific population comparison between LandScan and WorldPop.
Panels A and B show the spatial distribution of population by health zone according to LandScan and WorldPop, respectively. Panel C shows the relationship between increasing HZ-level
population according to LandScan and the WorldPop estimate for the same health zone, with reference lines indicated for WorldPop = LandScan, WorldPop = 2*LandScan, and
3.4 Case study application of unmet bednet need in the DRC
Accurate population totals are necessary for public health and administrative planning for delivery of services and interventions. The example of unmet bednet need in the DRC
demonstrates the importance of having accurate population estimates for provinces and health zones. The burden of malaria remains high in the DRC, and bednet use is a key malaria
intervention (WHO World Malaria Report, 2018). Using data from a Demographic and Health Survey (DHS) conducted from 2013-2014 in the DRC, we illustrate the relevance of population data selection for integrated malaria control. While the DHS collects a population representative sample with rich data on bednet use and other malaria preventative measures, these survey data merely allow us to construct a rate of bednet ownership, rather than a number of people who own a bednet. Therefore, for actionable public health planning, the bednet ownership rate obtained from the DHS survey must be translated into a raw number of bednets needed per province or health zone in order to inform the allocation of bednets for distribution efforts.
The different province- and health zone-level populations according to the LandScan data versus the WorldPop data result in substantially different estimates of bednet need by province in the DRC, as shown in Figure 8. Based on WorldPop data, and estimated 43,200,316 people lived in households without a bednet in the DRC in 2015, while performing the same calculation using the LandScan data results in a total estimated population without a bednet of 41,153,207.
Figure 8. Estimation of unmet bednet need by province, based on the selection of underlying population data.
4. Discussion and Conclusion
Because the DRC has not had a census or comprehensive population enumeration since 1984, gridded population data provides necessary denominators for translating prevalences and rates into disease burdens and counts of individuals. Two primary sources of such gridded population data, LandScan and WorldPop, differ in their estimate of the 2015 DRC population by approximately two million people. Furthermore, when examining the population of the subnational administrative units of province and health zone, the spatial structure of the population differs substantially between LandScan and WorldPop. Our findings show that for nearly half of the health zones in the DRC, the selection of input population data between LandScan and WorldPop results in an estimated health-zone level population that differs by more than 50,000 people.
population and health data in the DRC, a demonstration of the interoperability between DHS data and gridded population data highlights the need for accurate denominators to translate DHS data into policy. While this study was limited to 2015 for data availability reasons, at the time of writing (January 2020), there is an ongoing Ebola outbreak in the northeast provinces of the DRC that is focused in North Kivu and Ituri provinces. The 2015 population of North Kivu as estimated by LandScan versus WorldPop differed by approximately one million people, and the Ituri population differed by approximately 150,000 between the two datasets in 2015. Population numbers are essential for vaccine delivery and vaccine herd immunity threshold calculations, planning for aid delivery including spatial allocation of health care supplies to different health zones, and understanding the underlying reproductive rate and case fatality rate of the epidemic. Uncertainty in population estimates could potentially introduce uncertainty into intervention and control measures for this epidemic as well as future disease outbreaks.
growth and change. LandScan also releases annual population grids, but since their modeling approach is not openly published, we cannot evaluate whether they have separately calibrated a country-specific model for the DRC in any or all of their available years of data.
We have focused on the DRC as a study area to evaluate differences in gridded
population datasets, however this research is applicable beyond just the DRC or central Africa. There are other countries around the world that have not had a comprehensive census in over 30 years, including Somalia, Afghanistan, and Lebanon (United Nations Statistics Division, 2019). In many cases, countries with the longest time gap since a national census are also those
5. From Population Structure to Population Movement
CHAPTER 3. NATIONWIDE TRENDS IN BOTH CIRCULATORY AND MIGRATORY POPULATION MOVEMENT IN THE DEMOCRATIC REPUBLIC OF CONGO: EVIDENCE
FROM TWO CROSS-SECTIONAL STUDIES 1. Introduction
This study characterizes patterns in population movement in the Democratic Republic of the Congo (DRC), given the significance of mobility for infectious disease surveillance, control, and intervention. The DRC is a large country in Sub-Saharan Africa with an estimated
population of approximately 83 million people; an estimated 11 million live in the capital and largest city of Kinshasa (CIA, 2019). The DRC is the third most populous country in Africa, has the third highest proportion of urban population on the continent at an estimated 43% in 2017, and is considered to be a rapidly urbanizing country (World Bank, 2018). Additionally, the DRC is the largest country in Sub-Saharan Africa by land area, and it shares a border with nine other countries. These national borders are highly porous (Kabamba, 2010) and international spread of disease across borders has been documented in multiple disease outbreaks (WHO, 2007; WHO, 2010; WHO, 2016).
resistance (Aydemir et al., 2018; Deutsch-Feldman et al., 2019). Recently, in a study of HIV subtypes, Faria and colleagues have identified a similar trend, finding high levels of migration of genetic subtypes of HIV-1 both within the DRC and from the DRC to other countries, pointing to high rates of population mobility along those routes (Faria et al., 2019). Despite the
well-documented rapid urbanization in the DRC and the fact that the landscape genetics of malaria and HIV point to nationwide population mobility in the DRC, there is a lack of empirical research about human movement in the DRC.
This study leverages available national survey data to examine the demographic and geographic dimensions of human population movements in the DRC. We draw on theories of population mobility to examine two distinct conceptual categories of population movement, circulatory movement and migratory movement. These types of movement have distinct implications for infectious disease transmission (Buckee et al., 2017). By examining the characteristics of population mobility in the DRC, we provide empirical evidence of the high rates of population mobility in the DRC in order to add context to infectious disease surveillance and intervention efforts in the country.
2. Background and Literature Review
Population movement is a complex demographic category that encompasses a wide variety of human behaviors including migration, commuting, travel, and other forms of mobility (Petersen, 1958). Prothero (1977) theorized the role of human movement in epidemiology, identifying two major types of movement: circulatory and migratory. In this typology,
other hand, migratory movement refers to a permanent change of residence, with no intention to return to the previous place of residence. Both circulatory and migratory population movements are often theoretically framed and empirically analyzed in terms of push and pull factors
(Hristoski & Sotiroski, 2012; Maclin et al., 2017). In this framework, push factors are drivers of out-migration from a certain place, ranging from environmental variables like drought to
political variables such as armed conflict (Findlay, 2011; Warner et al., 2010); pull factors are those that incentivize in-migration to a certain place, such as employment opportunities (Hristoski & Sotiroski, 2012).
Both circulatory and migratory population movements have significant impacts on the transmission dynamics of infectious diseases, and on epidemiological surveillance efforts and public health interventions. Stoddard and colleagues theorize the role of human movement on vector borne disease transmission across spatial and temporal scales (Stoddard et al., 2009). They posit that the spatial range of movements, ranging from local to regional to international,
geographic population distribution that impact the population at risk of seasonal infections (Bharti et al., 2011; Buckee et al., 2017).
There have been no nationwide studies of population movement in the DRC; however, the studies that do exist focus on a small sample, typically limited to one province or region, and document high levels of population mobility that fall into both the circulatory and migratory population movement categories. Vlassenroot & Huggins (2004) found that under economic pressure, many young men in Eastern DRC opted to migrate seasonally for work, with rates of economic temporary migration increasing steadily during their study period of 1993-2003. Other studies have found similar patterns in seasonal migration due to participation in farming and mining sectors, especially among men (Geenen, 2014; Maclin et al., 2017). However, evidence from the DRC has largely been limited to small study areas or convenience samples (i.e. the employees in a single mine, as with (Geenen, 2014)), but have provided valuable data on the typical “push” and “pull” factors for entry into seasonal mobility in DRC (Rustad et al., 2016).
for its severity, this dimension of population mobility has continued to be a significant source of migratory movement in the country (UN OCHA, 2018a).
The anecdotal nature of the available evidence about population movements within the DRC underscores the need for a nationwide examination of the demographic profile of people who are engaging in mobility, the geographic trends in population movements, and the drivers of those movements. Much research on population movements on the African continent and
elsewhere draws on census data to elucidate nationwide migration patterns; however, there has not been a census in the DRC in over thirty years (Marivoet & Herdt, 2014). In the absence of available census data, this study draws on existing nationally representative survey data to provide a set of baseline estimates relating to population movements in the DRC.
3. Data and Methods
3.1 Description of data sources
This study uses data from two large cross-sectional population-representative surveys in the DRC to analyze nationwide patterns in circulatory and migratory population movements. The Demographic and Health Survey (DHS) is a cross-sectional population-based survey that collects information on a variety of demographic and health indicators for men, women, and children. It is implemented by the DRC Ministry of Planning in collaboration with the United States Agency for International Development (USAID). The Enquéte 1-2-3 is a household survey on
the Enquéte 1-2-3 contains information about where respondents lived prior to the survey, allowing for spatial analysis of geographic mobility patterns that is not possible based on the survey items included in the 2013-14 DHS.
Given the structure of the survey items that address migration as well as the theoretical basis for distinguishing two major categories of population mobility, circulatory movements and migratory movements were treated as distinct conceptual processes and analyzed separately.
Table 2. Nationally representative cross-sectional surveys in the DRC containing information about human movement included in this study
Survey Name and Year
Total Number of Adults (age 15+)Y
Questions about population mobility asked of adult survey respondents:
DHS, 2013-14
27483 (8656 men, 18827 women)
In the last 12 months, have you been away from your home community for more than one month at a time? Enquéte 123,
2012
59702 (28906 men, 30796 women)
Have you always lived in this locality?
If no, where did you live before you lived here:
• What type of place did you live in (large city, small city, rural, etc)?
• If DRC, what territory did you live in?*
• If other country, was it a neighboring country, a different African country, or other?
If no, why did you come here?
Y The DHS study design includes separate questionnaires for women, men, and households (HH and children’s survey questions are asked of women; men are interviewed separately), with inclusion criteria defining adults as age 15-45 for women age 15-65 for men. In contrast the Enquete 123 is a household survey containing people of all ages in a single survey data file; therefore, for this study the DHS age cutoff for adults of 15 was used to define the sample of adults in the Enquete 123. We did not exclude adults older than 65 because we are not directly comparing the samples and wanted to maintain as large a sample size as possible in the Enquete123 survey.
* The territory refers to the Level II administrative unit in the DRC (N=162).
3.2 Methods for circulatory movement
(Maclin et al., 2017), we stratified all analyses by gender in order to capture the distinct characteristics of mobility among women versus among men.
We conducted a descriptive analysis to compare the demographic profile of those with short-term mobility to those with no short-term mobility in the sample, and identified
demographic categories with significant differences between mobile and non-mobile respondents using chi-squared tests for categorical demographic attributes such as marital status and
urbanicity, and T-tests for quantitative attributes such as age and household size. Based on this descriptive analysis, we identified variables for inclusion in the logistic regression analysis. We fitted logistic regression models stratified by gender using the binary outcome “mobility/no mobility” in order to evaluate the demographic predictors of circulatory mobility among adults in the DRC, and generated odds ratios for each covariate in order to examine the association
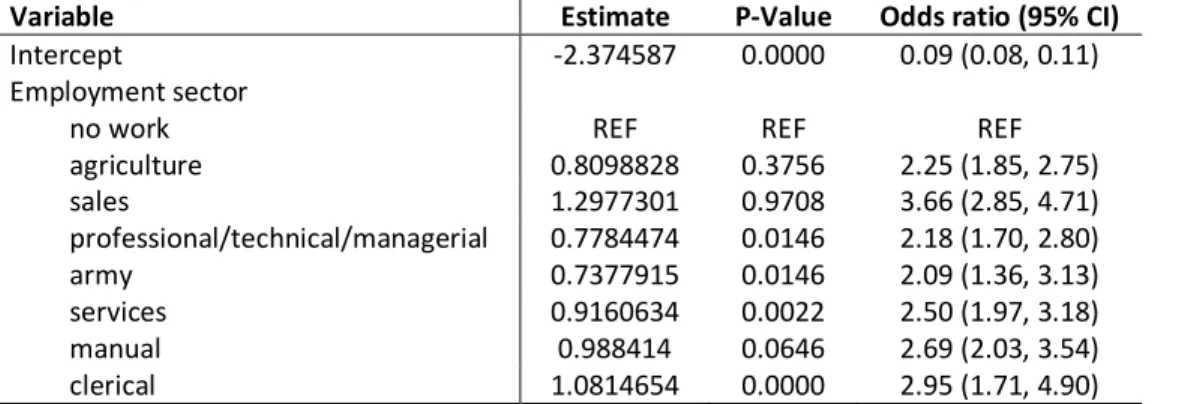
between demographic characteristics and mobility. Additionally, we conducted logistic
regression to examine the association between short-term mobility and employment among men; there were not significant differences in employment status or employment sector between the mobility group and the no mobility groups among women, so employment regression analysis did not include women. Logistic regression models were evaluated using the Akaike information criterion (AIC) statistic, in order to identify the models best describing the demographic
predictors of short-term mobility.
high-mobility and low-high-mobility sampling clusters using the Global Moran’s I statistic and found no evidence of spatial patterning in cluster-level rates of mobility for men, women, or overall adult mobility. Therefore, spatial results for circulatory mobility are not presented in this chapter.
3.3 Methods for migratory movement
To examine migratory movement in the DRC, we used the survey item from the Enquéte 1-2-3 which asked respondents if they had always lived at the location they were being surveyed in. Respondents who answered “no” to this question were coded as engaging in migratory mobility. Additionally, survey respondents who reported migration were asked follow up
questions about how long they had lived at their current residence, their reasons for moving, and where they lived before living in their current location, as described in Table 2 above.
We identified survey items regarding the marital status, educational attainment, age, and urbanicity of Enquéte 1-2-3 respondents that most closely matched the variables in the DHS in order to examine the demographic characteristics of migrants in the DRC, and compared these demographic categories between migrants and non-migrants using chi-squared tests for
categorical variables and T-tests for quantitative variables in order to examine which demographic characteristics differed significantly between migrants and non-migrants.
responses to this question in order to examine involuntary migration, forced migration, and migration for family reasons in the DRC, and compared these reasons between men and women in order to understand potential gendered differences in migration motivations.
Finally, we used the survey item regarding territory that migrants moved from to create spatial data layers in order to examine geographic patterns in migration. There were two variables in the Enquéte 1-2-3 survey that enabled us to examine geographic patterns in
migration. First, all surveys were coded with the province of residence for each household (the province is the Level 1 administrative unit of the DRC; N=26), this was coded as the destination location for migrants. Second, respondents who reported migratory movement were asked a follow-up question about which territory they moved from (the territory is the Level 2
administrative unit of the DRC; N-162), this was coded as the origin location for migrants. We created maps of the number of migrants that reported each province as their origin location and the number of migrants that reported each province as their destination location, and used the territory-level information to examine the proportion of reported migration that occurred between two territories within the same province. Finally, we constructed a map of migration flows between each of the 26 provinces in order to empirically examine the nationwide spatial patterns of migratory movement in the DRC.
4. Results
4.1 Results for circulatory movement
4.1.1 Sample characteristics and descriptive findings
(1443/8656) of men reported circulatory mobility as measured by the same survey item. Full sample characteristics are described in Appendix II (refer to Table 9 and Table 9).
We examined demographic characteristics of men and women who engaged in short-term mobility (Table 8, Appendix II) and examined differences in the proportions of people in a given demographic category who engaged in mobility versus those who did not. Based on the
descriptive analysis, we identified relevant demographic variables to include in model-based analysis. For women, there were significant differences in rurality, educational attainment, wealth index, and marital status between respondents who engaged in circulatory mobility and those who did not (p <= 0.05). For men, these four variables also showed significant differences between people with mobility and those with no mobility; additionally, there were significant differences between these groups in age, seasonality of employment, and sector of employment. Key demographic variables associated with mobility for men and/or women are described in full in Appendix II.
4.1.2 Logistic Regression
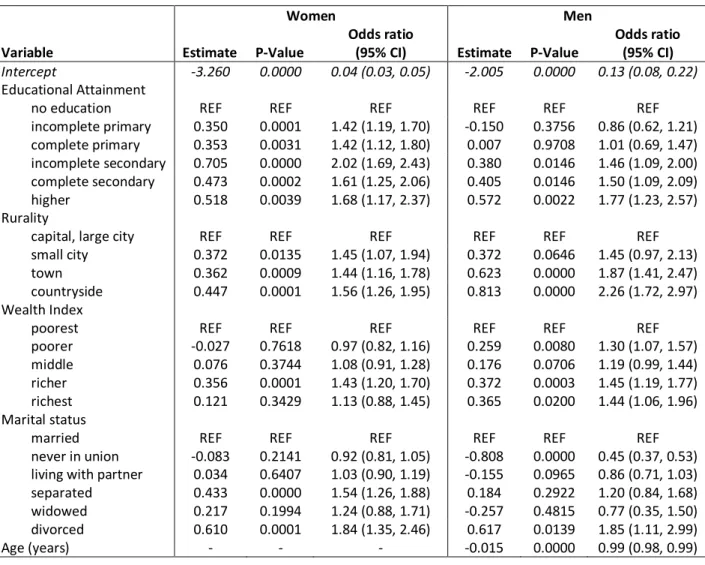
Results of the demographic model of mobility for men and women are shown below in Table 3. For women, all levels of education were significantly predictive of circulatory mobility compared to no education, while for men only levels of education above primary education were predictive of circulatory mobility compared to no education. Rurality was examined as a four-category variable, with the most urban four-category treated as the referent group. For both women and men, residing in the most rural category (countryside) had the largest effect on mobility: women living in the countryside were 1.56 (95% CI: 1.26-1.95) more likely to engage in
Table 3. Logit models of circulatory mobility and demographic characteristics, stratified by gender. Final demographic model for each gender is detailed below.
Women Men
Variable Estimate P-Value
Odds ratio
(95% CI) Estimate P-Value
Odds ratio (95% CI)
Intercept -3.260 0.0000 0.04 (0.03, 0.05) -2.005 0.0000 0.13 (0.08, 0.22)
Educational Attainment
no education REF REF REF REF REF REF
incomplete primary 0.350 0.0001 1.42 (1.19, 1.70) -0.150 0.3756 0.86 (0.62, 1.21) complete primary 0.353 0.0031 1.42 (1.12, 1.80) 0.007 0.9708 1.01 (0.69, 1.47) incomplete secondary 0.705 0.0000 2.02 (1.69, 2.43) 0.380 0.0146 1.46 (1.09, 2.00) complete secondary 0.473 0.0002 1.61 (1.25, 2.06) 0.405 0.0146 1.50 (1.09, 2.09) higher 0.518 0.0039 1.68 (1.17, 2.37) 0.572 0.0022 1.77 (1.23, 2.57)
Rurality
capital, large city REF REF REF REF REF REF
small city 0.372 0.0135 1.45 (1.07, 1.94) 0.372 0.0646 1.45 (0.97, 2.13) town 0.362 0.0009 1.44 (1.16, 1.78) 0.623 0.0000 1.87 (1.41, 2.47) countryside 0.447 0.0001 1.56 (1.26, 1.95) 0.813 0.0000 2.26 (1.72, 2.97)
Wealth Index
poorest REF REF REF REF REF REF
poorer -0.027 0.7618 0.97 (0.82, 1.16) 0.259 0.0080 1.30 (1.07, 1.57) middle 0.076 0.3744 1.08 (0.91, 1.28) 0.176 0.0706 1.19 (0.99, 1.44) richer 0.356 0.0001 1.43 (1.20, 1.70) 0.372 0.0003 1.45 (1.19, 1.77) richest 0.121 0.3429 1.13 (0.88, 1.45) 0.365 0.0200 1.44 (1.06, 1.96)
Marital status
married REF REF REF REF REF REF
never in union -0.083 0.2141 0.92 (0.81, 1.05) -0.808 0.0000 0.45 (0.37, 0.53) living with partner 0.034 0.6407 1.03 (0.90, 1.19) -0.155 0.0965 0.86 (0.71, 1.03) separated 0.433 0.0000 1.54 (1.26, 1.88) 0.184 0.2922 1.20 (0.84, 1.68) widowed 0.217 0.1994 1.24 (0.88, 1.71) -0.257 0.4815 0.77 (0.35, 1.50) divorced 0.610 0.0001 1.84 (1.35, 2.46) 0.617 0.0139 1.85 (1.11, 2.99)
Age (years) - - - -0.015 0.0000 0.99 (0.98, 0.99)
A five-category wealth index was used to examine the association between