Blood Glucose Predictor
By
Jessica Patterson
Senior Project
ELECTRICAL ENGINEERING DEPARTMENT
California Polytechnic State University
San Luis Obispo
i
TABLE II
PROJECT PLAN REPORT CONTENTS
Contents
List of Figures ... ii
Abstract ... iii
Chapter 1. Introduction ... 1
Chapter 2. Customer Needs, Requirements, and Specifications ... 2
Conclusion ... 14
Appendix A. Senior Project Analysis ... 17
List of Figures
Chapter 3:
Figure 1:
Level Zero block diagram for Adhesive Medical Monitoring Device describing required
inputs to produce blood glucose measurements
Chapter 4:
Figure 2: EE 460 Gantt Chart for Winter Quarter, 2019 listing recommended work periods
(green lines), due dates (blue triangles), and when the project requires feedback (circle of
arrows).
Figure 3: EE 461 Gantt Chart for Spring Quarter, 2019 including work periods and due dates for
design, test, and build cycles.
Abstract
For my senior project, I perform data analysis using statistical methods to determine body metrics that correlate with blood glucose levels. Working with Dr. Tina Smilkstein, I take repeat measurements from 6 different volunteers to establish trends in bodily metric data. The data taken includes weight, body fat, pulse rate, VO2, blood glucose, blood pressure, hours slept, and quality of sleep. Using these values, I use the program MiniTab to view results.
A few examples of correlations with blood glucose found in this project are:
• Systolic blood pressure for females had a regression line of 124.0 -0.3366*Blood Pressure. This indicates a negative correlation, meaning as blood pressure rose, blood glucose dropped. For males, the line equation is 59.47 + 0.2962*Blood Pressure, indicating a positive correlation. • In the case of diastolic blood pressure, male data was quite scattered graphically, indicating the
line of best fit is not an accurate representation of blood glucose. For females, the line is 111.9 – 0.3565*Blood Pressure (diastolic). This again indicates a negative correlation.
• In the case of weight, both lines graphically followed the data points. For males, the regression line is 162.6 – 0.342*Weight. For females, it is 103.2- 0.1525*Weight.
• The rest of the correlations and data is found in the contents of the report.
1
Chapter 1. Introduction
Using bodily metrics to understand changes in blood glucose and even predict it, my senior project, implements research to anticipate a patient’s blood glucose levels without puncturing their skin, a common customer grievance. This research can be leveraged to determine important trends. These trends may be used to create, potentially, a non-invasive blood glucose monitor. The monitor would measure the metrics other than blood glucose, allowing a pain-free blood glucose prediction method. The product’s customers, diabetics or pre-diabetics, can now predict their insulin needs more easily. This project allows patients to keep a closer eye on their health, without causing unnecessary pain, discomfort, and cost for doing so. Some blood glucose testing strips cost as much as $1.50 per strip. With testing every time you eat, this cost could grow over $5 a day. Although this tool is interesting to use, it is in the early stages of research and should not be taken as medical advice.
The project’s context is a time of changing and quickly advancing medical devices. The biotech industry continuously advances, with blood glucose monitors constantly needing attention [7]. These updates make them smaller, faster, more comfortable, and more user accessible. However, not many of these methods lack a needle pricking the skin of the user [6]. This project adds that layer of customer compatibility to the market, making it the prime choice for those not wishing to repeatedly puncture themselves.
Chapter 2. Customer Needs, Requirements, and Specifications
Customer Needs AssessmentThe target customers of this product, diabetes patients, need a method featuring the following:
• Simple – the measurements taken and webpage used to calculate should be intuitive
• Non-invasive – the device provides an external-only solution
• Reliable – the customer can trust the prediction made, but not accept it as medical advice
• Private – customers’ data does not remain in system beyond their calculation Requirements and Specifications
The requirements and specifications of this project arose from discussion and revision of original plans for the project. Inspiration for many of the specifications came from existing products and what the companies advertise as their most lucrative features. [1] [4]
Subject Selection
In order to choose subjects, the candidates must meet several criteria in the selection process and measurement process. For example:
• Subjects must not take blood thinners or other medications that interfere with the safety or results.
• Subject’s ages range from 18-24 years old.
• The testing will not impede any costs upon the subjects.
• Preparation for the data collection includes only cleaning the surface of the skin and ensuring the subject is seated and relaxed.
• The subjects do not experience excessive pain or discomfort during data collection.
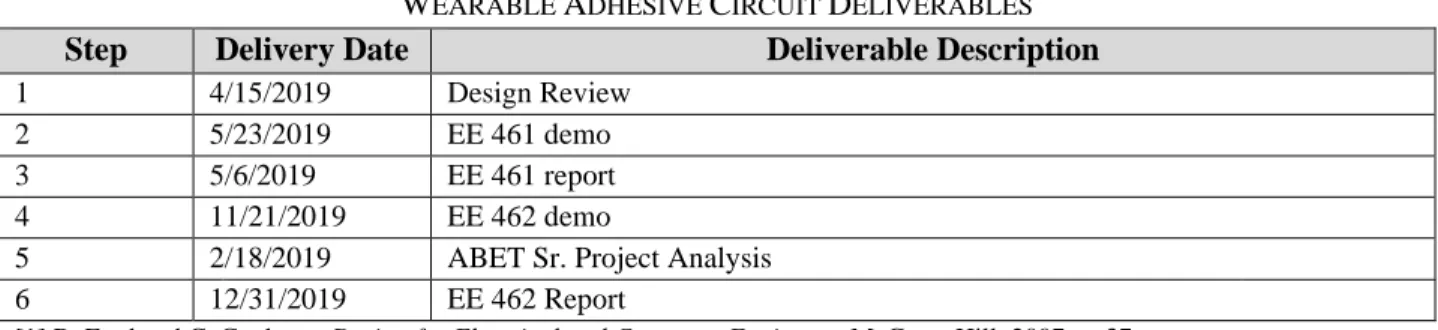
TABLE IV
WEARABLE ADHESIVE CIRCUIT DELIVERABLES
Step Delivery Date Deliverable Description
1 4/15/2019 Design Review 2 5/23/2019 EE 461 demo 3 5/6/2019 EE 461 report 4 11/21/2019 EE 462 demo
5 2/18/2019 ABET Sr. Project Analysis 6 12/31/2019 EE 462 Report
[1] R. Ford and C. Coulston, Design for Electrical and Computer Engineers, McGraw-Hill, 2007, p. 37 [2] IEEE Std 1233, 1998 Edition, p.
1. The first step, design review, was done in the EE460 course at Cal Poly, SLO. This included the formatting of this report in early stages, involving section creation. Dr. David Braun oversaw this process. Once complete, the report is handed to the advisor, Dr. Tina Smilkstein, who provides project feedback. This concludes the design review.
2. The EE 461 demo does not apply for this project, but it consisted of finishing research, gathering all materials, and preparing for data collection with subjects. This continued into the summer, where I took weeks of data on myself to perfect the methods and ensure the data taken on subjects was done quickly and safely.
3. Similar to the EE460 design review, EE461 also requires an update to the advisor on report status with any new information.
4. The EE 462 demonstration involved setting up the calculator to predict blood glucose with the regression analysis with the lowest P-values. This was inputted into the calculator-building website, then presented to Dr. Smilkstein to use and explore. The information for this calculator was found through several months of data collection from multiple subjects, then compiled and analyzed using Excel and Minitab. A more detailed time-flow of the project is found below:
a. First, determining which types of data to take and doing research on current blood glucose measurement techniques.
b. Second, gathering subjects for data collection.
c. Third, gathering data from the subjects, including at least three measurements from each person first thing in the morning.
d. Fourth, analyzing the data through MiniTab to see which metrics were the most significant and which could be disregarded.
e. Last, creating a tool for people to use and easily interpret my findings.
7. Results of Statistical Analysis
The results of this research showed interesting correlations. Notably, the differences between the male and female trends. At first, I analyzed both sexes together. Out of curiosity, I decided to split up male and female results, showing very interesting data. As a disclaimer, these results always may be a coincidence for the individuals I tested. Additionally, more subjects, more measurements, and a longer and more controlled study would improve the trends analyzed in this project.
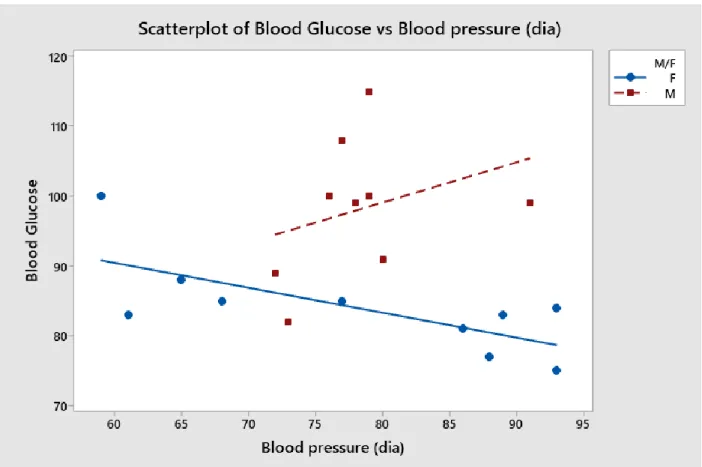
Figure 2: Blood glucose compared with diastolic blood pressure data.
Regression Equation
M/F
F Blood Glucose = 102.7 - 0.239 Blood pressure (dia)
M Blood Glucose = 116.8 - 0.239 Blood pressure (dia)
Coefficients
Term Coef SE Coef T-Value P-Value VIF
Constant 102.7 15.0 6.84 0.000
Blood pressure (dia) -0.239 0.190 -1.26 0.227 1.00
M/F
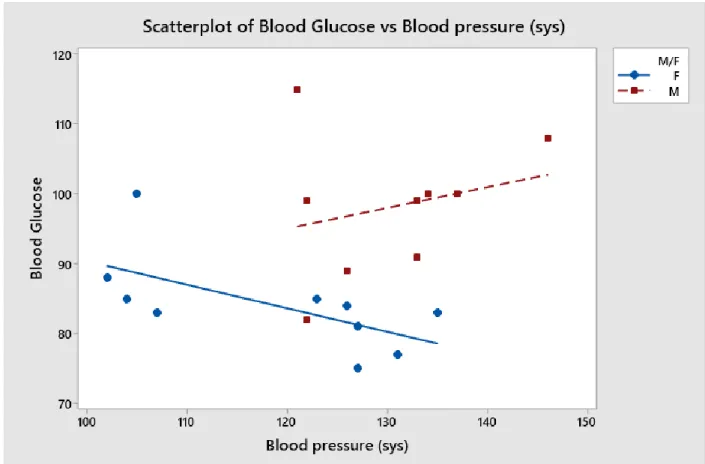
Figure 3: Systolic blood pressure and blood glucose associations.
In Figure 3, the trends follow a similar pattern as Figure 2. Again, the female blood glucose fell as blood pressure rose, while the male data remained more scattered. This may be due to statistical outliers, stress, or simply a more consistent trend in female measurements. The actual regression equations for male and female results are seen below. While graphically, systollic blood presure looks like a good indicator, the coefficients reveal that when used alone, it is not sufficient to predict blood glucose.
Regression Equation
M/F
F Blood Glucose = 103.0 - 0.159 Blood pressure (sys)
M Blood Glucose = 118.9 - 0.159 Blood pressure (sys)
Coefficients
Term Coef SE Coef T-Value P-Value VIF
Constant 103.0 22.6 4.56 0.000
Blood pressure (sys)
-0.159
0.189 -0.84 0.412 1.33
M/F
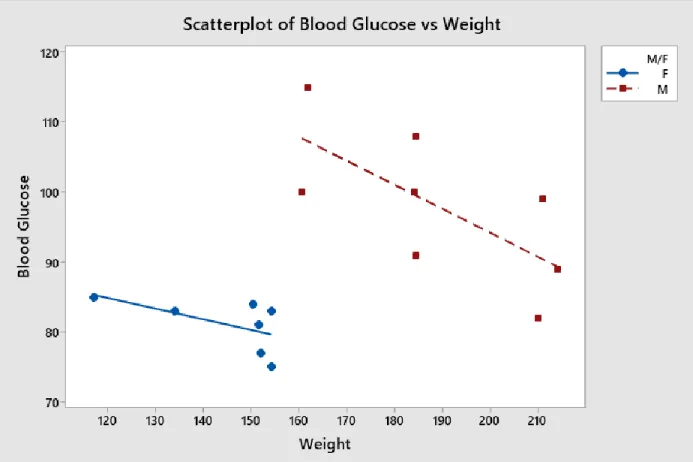
Figure 4: Blood glucose trends with weight differing between male and female subjects. In Figure 4, interestingly enough, trends defy expectations. As weight went up, blood glucose when down. Since all subjects are moderately active 18-24 year olds, I believe their muscle mass may have caused this phenomenon. Generally, resistance exercise increases muscle mass as well as lowing blood glucose levels [18]. The male weight correlation contains a higher variety of inputs than female, since most female data lies from 150-160 lbs.
Regression Equation
M/F
F Blood
Glucose
= 103.2
0.153 Weight
M Blood
Glucose
= 162.6
0.342 Weight
The regression equation above shows how to predict blood glucose between males and females. It is important to categorize sexes since, as seen above, the equations are quite different.
Coefficients
Term Coef SE Coef T-Value P-Value VIF
Constant 103.2 27.5 3.75 0.003
Weight -0.153 0.189 -0.81 0.437 9.69
M/F
M 59.3 35.3 1.68 0.121 108.50
Weight*M/F
M -0.190 0.222 -0.85 0.412 156.98
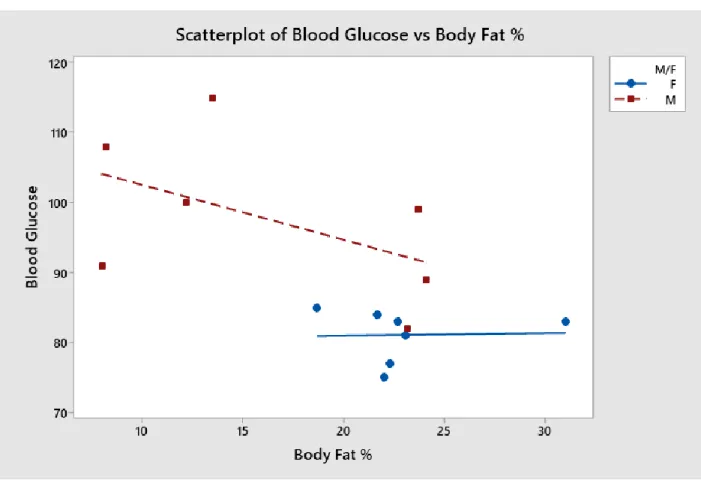
Figure 5: Blood glucose trends analyzed with respect to body fat percentage.
Figure 5 shows that there was very little correlation between blood glucose and body fat percentage. Some may be seen for males, but the scattered points may not be indicitave of a strong relationship. Overall, there was a slight downward trend in male blood glucose as body fat increased. For females, body fat had no correlation with blood glucose, as over a wide range of body fats, blood glucose stayed relatively constant.
MiniTab, the software used for the figures in this report, also has the ability to make predictions. Using a regression equation and weighting the male/female categories, Minitab provides an estimation of blood glucose level. For the calculator I created, I used a slightly different method by splitting up the male and female equations.
Below are several inputs and outputs of this estimation. Case 1: Blood pressure and sex
Regression Equation
Blood Glucose = 107.2 + 0.089 Blood pressure (sys) - 0.433 Blood pressure (dia) + 0.000000 M/F_F - 78.7 M/F_M + 0.000000 Blood pressure (sys)*M/F_F
+ 0.142 Blood pressure (sys)*M/F_M + 0.000000 Blood pressure (dia)*M/F_F
+ 0.937 Blood pressure (dia)*M/F_M
Settings
Variable Setting
Blood pressure (sys) 126
Blood pressure (dia) 70
M/F F
Prediction
Fit SE Fit 95% CI 95% PI
88.1743 8.31166 (70.2180,
106.131)
(62.9093, 113.439)
X
X denotes an unusual point relative to predictor levels used to fit the model.
Case 2: Pulse, weight, blood pressure, and sex
Case 2 represents pulse, weight, blood pressure, and sex as factors in the prediction. I chose these metrics for a more complete prediciton than in Case 1, while excluding metrics with extremely high P-values or that had clearly no correlation, graphically. Several different inputs are used to represent varying types of subjects.
Regression Equation Blood
Glucose
= 111.5 + 0.055 Pulse Rate - 0.299 Weight - 0.056 Blood pressure (sys)
Input 1:
Settings
Variable Setting
Pulse Rate 80
Weight 150
Blood pressure (sys) 120
Blood pressure (dia) 70
M/F F
Prediction
Fit SE Fit 95% CI 95% PI
76.7930 4.90026 (65.7078, 87.8781) (56.9951, 96.5908)
Input 2:
Settings
Variable Setting
Pulse Rate 55
Weight 200
Blood pressure (sys) 110
Blood pressure (dia) 75
M/F M
Prediction
Fit SE Fit 95% CI 95% PI
94.4555 6.18656 (80.4606, 108.451) (72.8932, 116.018)
Input 3:
Settings
Variable Setting
Pulse Rate 95
Weight 135
Blood pressure (sys) 105
Blood pressure (dia) 65
Prediction
Fit SE Fit 95% CI 95% PI
82.0487 7.35639 (65.4074, 98.6900) (58.6819, 105.416) X
X denotes an unusual point relative to predictor levels used to fit the model.
Input 4:
Settings
Variable Setting
Pulse Rate 85
Weight 181
Blood pressure (sys) 135
Blood pressure (dia) 85
M/F M
Prediction
Fit SE Fit 95% CI 95% PI
102.166 3.74881 (93.6855, 110.646) (83.6999, 120.632)
Conclusion
This project aims to reduce the number of times a person must prick themselves. To begin the lengthy process of determining the best and most accurate way to do this, my project uses data collected on 18-24 year old college students without diabetes, to first understand the baseline of healthy blood glucose. From this data, further research can be done to determine abnormalities and eventually leverage the information into a device. The goal of this project was reached, with finding which metrics were most helpful in determining blood glucose. Body fat, VO2, sleep quality, and sleep length (short term) were ruled out, while weight, pulse, blood pressure, and sex were found to be significant.
Along with data found, anyone with an internet connection can now roughly predict their blood glucose. It is important to note that this is not medical advice and I am not a doctor, simply a researcher. The calculator is found here: https://www.calconic.com/calculator-widgets/blood-glucose-predictor/5dcf37d8893823001e8a7b7c.
References
[1] “Meet real people like you on the MINIMED™ 670G SYSTEM WITH SMARTGUARD TECHNOLOGY.,” MiniMed 670G Insulin Pump System | World's First Hybrid Closed Loop System. [Online]. Available:
https://www.medtronicdiabetes.com/products/minimed-670g-insulin-pump-system. [Accessed: 26-Jan-2019].
Authority: This website provides the information of a current glucose monitor on the market from a reputable company, Medtronic. Many employees collaborate and review before releasing this advertisement to the public.
Why it informs: Via this link, users find marketing content, target customers, and specifications for one of the top biotechnology companies’ devices.
[2] J. Li, T. Igbe, Y. Liu, Z. Nie, W. Qin, L. Wang, and Y. Hao, “An Approach for Noninvasive Blood Glucose Monitoring Based on Bioimpedance Difference Considering Blood Volume Pulsation,” IEEE Access, vol. 6, pp. 51119–51129, Aug. 2018. [Accessed Jan. 24, 2019]
Authority: Many researchers, engineers, and scientists collaborated to create this IEEE conference paper. The authors presented at a conference and published, meaning selection occurred from many reputable articles.
Why it informs: The goal of the circuit I plan to build is to provide infrastructure to use electrical signals for blood glucose monitoring. This article lays out the groundwork for continuing this research and goal.
[3] J. Yoo, L. Yan, S. Lee, Y. Kim, and H.-J. Yoo, “A 5.2 mW Self-Configured Wearable Body Sensor Network Controller and a 12 uW Wirelessly Powered Sensor for a Continuous Health Monitoring System,” IEEE Journal of Solid-State Circuits, vol. 45, no. 1, pp. 178–188, Dec. 2009. Available: https://ieeexplore.ieee.org/document/5357569. [Accessed Jan. 24, 2019]
Authority: Many researchers, engineers, and scientists collaborated to create this IEEE journal article. This means it contains a variety of knowledge from multiple backgrounds. According to scholar.google.com, this article has 205 citations. For an article with such specialized content, it possesses a substantial amount of citations. Additionally, IEEE requires extensive peer review.
Why it informs: The journal article describes a small, wireless, health monitoring system. This covers the entire goal of my project, regardless of application.
[4] Lambert, J. and Borchert, M. (Jul. 23, 2002). “Non-Invasive Glucose Monitor,” Patent No.: 6424850. Available:
https://patents.google.com/patent/US6424850?oq=6424850. [Accessed Jan. 26, 2019]
Authority: This patent’s statistics read: cited 7 times by other patents or patent applications, 6 times by non-patents (for example, abstracts), and 86 times by other sources. The significant number of citing on this patent shows that it contains sound and reasonable claims.
Why it informs: I plan on implementing a non-invasive circuit, allowing users to monitor health data such as blood glucose. This specific application is the focus of this patent, describing specifications and claims that may prove useful when adapting my own claims.
[5] “Adhesive patch offers bloodless diabetes monitoring - EPR,” European Pharmaceutical Review, 11-Apr-2018. [Online]. Available: https://www.europeanpharmaceuticalreview.com/news/74495/adhesive-patch-offers-bloodless-diabetes-monitoring/. [Accessed: Jan. 26, 2019].
Authority: The European Pharmaceutical Review website provides recently updated articles and news in technological developments. Some consider it the leading publication for this information in Europe.
Why it informs: Ensuring whatever monitoring I end up doing requires no finger-pricking remains my top priority with the non-invasive circuit. Ideally, my project also consists of a patch for monitoring. The article focuses on this as well.
[6] “Continuous Glucose Monitors Consumer Guide,” main.diabetes.org, Apr-2015. [Online]. Available: http://main.diabetes.org/dforg/pdfs/2015/2015-cg-continuous-glucose-monitors.pdf. [Accessed: 26-Jan-2019]. Authority: Diabetes.org contains information from the American Diabetes Assocation, a well-respected organization providing information and resources on battling diabetes. They created a consumer guide for already existing products to summarize their functionality.
Why it informs: By comparing my ideas with currently existing products, I can adjust my goals towards more realistic specifications. This guide contains many of the leading glucose monitors, both invasive and non-invasive.
management, 2nd ed. Arlington, VA: American Diabetes Association, 2017.
Authority: 11 different books and articles have already cited this book in the few years since its publication, showing the impact it already has had on the niche community of blood-glucose monitoring.
Why it informs: By analyzing glucose pumps and continuous monitoring, I can learn the advantages and pitfalls of a device that merely measures and does not pump insulin. This could lead me to developing additional features or products in the future.
[8] “Single-Lead, Heart Rate Monitor Front End,” Data Sheet, Jun-2018. [Online]. Available:
https://www.analog.com/media/en/technical-documentation/data-sheets/ad8232.pdf. [Accessed: 26-Jan-2019].
Authority: Analog Devices, a 5.1 billion dollar company, specializes in signal processing. The data sheets and monitoring devices produced by this company face peer review and extensive revising over the years.
Why it informs: Data sheets list the most important and detailed engineering specifications that may challenge me to find elsewhere, such as common temperature limits, size, and supply range.
[9] R. Klintworth, K. Ludwig, M. Oberle, and W. Rode (June 26, 2000). “System for long-term remote medical monitoring” Patent No.: 6315719. Available: https://patents.google.com/patent/US6315719B1/en. [Accessed Feb. 3, 2019]
Authority: 292 sources have cited this patent, with the majority of those sources also cited between 200 and 1000 times each. This establishes credibility in that many reputable sources use this patent for their information This patent includes many images and diagrams, showing the function and reasonable usage of the device.
Why it informs: I intend to use an adhesive patch that transmits and receives from an external source, much like in the patent. The patent describes a device that acquires sensor data like pulse rate and blood glucose content, two of my main goals for data content.
[10] Maximous, “Print Conductive Circuits With an Inkjet Printer,” Instructables.com, 07-Oct-2017. [Online]. Available: https://www.instructables.com/id/Print-Conductive-Circuits-With-An-Inkjet-Printer/. [Accessed: 04-Feb-2019].
Authority: This instructables has the following statistics: 148,037 views, 536 likes, 43 comments, featured, and includes 11 sources such as books, projects, datasheets, research articles, and more. The detail and extensive research done by the author proves the credibility and authority of the instructions listed in printing the circuit.
Why it informs: I have never attempted printing a circuit using conductive ink, so having a step-by-step guide may provide me with materials needed, additional research resources, and guidance when attempting to print my adhesive circuit.
[11] National Institutes of Health Technology Assessment Conference Statement, “Bioelectrical impedance analysis in body composition measurement,” Nutrition, vol. 12, no. 11-12, Dec. 1994. [Accessed: 2/9/2019]
[12] A. Hodges and R. Flick, “Light Sensing Automated Blinds,” California Polytechnic State University, San Luis Obispo, 2017. [Accessed: 2/9/2019]
[13] J. Carrillo and D. Marusiak, “Energy Harvesting of Human Kinetic Movement,” California Polytechnic State University, San Luis Obispo, 2012. [Accessed: 2/9/2019]
[14] “CDC Newsroom,” Centers for Disease Control and Prevention, 18-Jul-2017. [Online]. Available: https://www.cdc.gov/media/releases/2017/p0718-diabetes-report.html. [Accessed: 13-Feb-2019].
[15] “Drugs, Devices, and the FDA: Part 2: An Overview of Approval Processes: FDA Approval of Medical Devices,” NeuroImage, 27-Jun-2016. [Online]. Available:
https://www.sciencedirect.com/science/article/pii/S2452302X16300183. [Accessed: 13-Feb-2019].
[16] “IEEE Code of Ethics,” IEEE - Advancing Technology for Humanity. [Online]. Available: https://www.ieee.org/about/corporate/governance/p7-8.html. [Accessed: 13-Feb-2019].
[17] J. A. Scott, “Diabetes by the Numbers,” Stroke Center - EverydayHealth.com, 17-Sep-2014. [Online]. Available: https://www.everydayhealth.com/hs/managing-type-2-diabetes/diabetes-by-the-numbers/. [Accessed: 25-Feb-2019].
[18] K. C. Ward, “Building Muscles Helps Control Blood Glucose,” Diabetes Forecast. [Online]. Available: http://www.diabetesforecast.org/2015/jul-aug/building-muscles-helps.html. [Accessed: 24-Dec-2019].
Appendix A. Senior Project Analysis
TABLE V
APPENDIX D — ANALYSIS OF SENIOR PROJECT DESIGN
Please provide the following information regarding your Senior Project and submit to your advisor
along with your final report. Attach additional sheets, for your response to the questions below.
Project Title:
Blood Glucose Predicting Algorithm
Student’s Name:
Jessica Patterson
Student’s Signature:
Advisor’s Name:
Tina Smilkstein
Advisor’s Initials: Date:
•
1. Summary of Functional Requirements
This easy-to-use, non-invasive method of predicting blood glucose allows users to understand their
bodily metrics better. It exists as a free calculator website to ensure accessibility.
•
2. Primary Constraints
Measuring accurate propagation delay of the signal may be a significant challenge, as several factors
can influence this time measurement. The accuracy of the printed transistors also may affect the
functionality of the monitor. The difficulty of finding subjects affects the timeline of this project.
Many limiting factors affect this project, such as time, test subject availability, and
accuracy/availability of data.
What made your project difficult? What parameters or specifications limited your options or directed
your approach?
Finding and getting subjects to do repeat measurements was the most difficult part of this project. Resources for analysis were available to me, but driving around to different subjects houses to make it easier for them was time-consuming.
•
3. Economic
• What economic impacts result? Consider:
Human Capital – Humans may not possess the knowledge of how the calculator works, leading to
disbelief in the effectiveness.
Financial Capital – Patients may not have the money to try this calculator on a computer, forcing
them to continue using the painful finger-prick method.
Natural Capital – The use of internet increases energy consumption.
• Costs and benefits accrue after the calculator has been implemented to a limited number of test
subjects to ensure safety and effectiveness. It may take many design-build-test iterations before the
product proves suitable for the general population if the calculator is leveraged into a device.
Actual final cost of component parts (at the end of your project): $12.00 to me, about 500 total
including parts provided by Dr. Smilkstein.
Attach a final bill of materials for all components.
Additional equipment costs include shipping costs, compensation for test subjects, and additional
work hours of the engineer once made into a device.
• How much does the project earn? Who profits?
As of now, the project earns no money. It is a free-to-use calculator to make medical testing more
accessible.
• Timing
When do products emerge? How long do products exist? What maintenance or operation costs
exist?
The calculator emerges immediately. If made in to a device, products emerge 3-7 years after creation
due to the need to complete the FDA device approval process [15]. Product lifetime remains
unknown until test subjects can confirm functionality.
Original estimated development time (as of the start of your project), as Gantt or Pert chart: 26
weeks.
Actual development time (at the end of your project), as Gantt or Pert chart: 27 weeks.
After the project ends, others may implement the ideas laid out in this senior project plan to bring the
product to market.
•
4. If manufactured on a commercial basis:
N/A
•
5. Environmental
• Describe any environmental impacts associated with manufacturing or use, explain where they
occur and quantify.
While usage of the calculator does not pose environmental threats, the manufacturing of the device
may release pollutants, depending on the factory’s conditions. Pollution from shipping vehicles also
poses an environmental concern, from large-scale shipping of materials to small-scale shipping to
customers. This likely does not compare with the current pollution levels from large companies. The
device manufacturing can likely take place in an existing factory and share shipping with other
relevant medical devices, reducing the impact.
• Which natural resources and ecosystem services does the project use directly and indirectly?
manuals.
• Which natural resources and ecosystem services does the project improve or harm?
This project improves the quantity of paper due to the reduced need for blood testing strips and
plastic materials to create the testing devices. It harms the atmosphere through vehicle exhaust
shipping and transportation.
• How does the project impact other species?
This project impacts other species indirectly by taking natural resources such as water and trees,
leading to habitat reduction.
•
6. Manufacturability
Manufacturing difficulties may include finding a location for manufacturing, paying for the
necessary materials and space for large scale production, and surpassing legal barriers for
manufacturing.
•
7. Sustainability
• Describe any issues or challenges associated with maintaining the completed device, or system.
If the device does not last as long as intended, production costs may increase to an unsustainable
amount. In addition, customers may choose not to purchase the device more than once if it does not
last.
• Describe how the project impacts the sustainable use of resources.
The project reduces the use of paper test strips and reduces the need for multiple devices through the
ability to recharge and reuse the device.
• Describe any upgrades that would improve the design of the project.
To upgrade the concept, a manufacturer could add functionality such as heart rate monitoring, drug
level monitoring, and devise a plan for insulin depositing.
• Describe any issues or challenges associated with upgrading the design.
The requirement that the device does not need to prick the user causes an issue with adding insulin
depositing functionality
Describe ethical implications relating to the design, manufacture, use, or misuse of the project.
Analyze using one or more ethical frameworks in addition to the IEEE Code of Ethics.
The first ethical framework of the IEEE Code of Ethics states:
“to hold paramount the safety, health, and welfare of the public, to strive to comply with ethical design and sustainable development practices, and to disclose promptly factors that might endanger the public or the environment”
The desire to provide a device related to the health of those with diabetes upholds the ideals of this
code.
The fifth ethical framework states:
“to improve the understanding by individuals and society of the capabilities and societal implications of conventional and emerging technologies, including intelligent systems”
The desire to reduce pain involved with glucose monitoring ensures that the project understands the
complaints of society and strives to provide an alternative method.
The misuse of this product does not cause problems, since the only functionality provides blood
glucose monitoring, which likely does not involve sinister intentions.
•
9. Health and Safety
Describe any health and safety concerns associated with design, manufacture or use of the project.
The application of current to the human body may concern some users. However, the amount of
current used does not harm the user as long as they do not have any electrical components already
inside them, such as a pacemaker.
•
10. Social and Political
• Describe social and political issues associated with design, manufacture, and use.
The rigorous and lengthy FDA approval process may cause an issue with bringing the product to
market. However, this process ensures the upmost quality of the device.
• Who does the project impact? Who are the direct and indirect stakeholders?
This project effects manufacturers of materials, patients with diabetes, doctors, competitors, and
investors. It directly effects engineers and patients.
• How does the project benefit or harm various stakeholders?
companies may endure financial harm if their products lose popularity.
• To what extent do stakeholders benefit equally? Pay equally? Does the project create any
inequities?
Engineers and investors likely earn much more than shipping contractors and materials
manufacturers. However, due to decreased involvement by the latter, this difference in pay does not
cause concern.
• Consider various stakeholders’ locations, communities, access to resources, economic power,
knowledge, skills, and political power.
The access to resources may affect the benefits of the patients, depending on whether or not they live
in a developed country, have access to electricity, earn an income, and more. These people have
unfair limitations placed on them and may not receive the product at any point.
•
11. Development