Adipose Tissue Gene Expression Associations
Reveal Hundreds of Candidate Genes
for Cardiometabolic Traits
Chelsea K. Raulerson,1 Arthur Ko,2,3 John C. Kidd,4 Kevin W. Currin,1 Sarah M. Brotman,1
Maren E. Cannon,1 Ying Wu,1,13 Cassandra N. Spracklen,1 Anne U. Jackson,5 Heather M. Stringham,5 Ryan P. Welch,5 Christian Fuchsberger,6 Adam E. Locke,7 Narisu Narisu,8 Aldons J. Lusis,2
Mete Civelek,9 Terrence S. Furey,1,10 Johanna Kuusisto,11 Francis S. Collins,8 Michael Boehnke,5 Laura J. Scott,5 Dan-Yu Lin,4 Michael I. Love,1,4 Markku Laakso,11 Pa¨ivi Pajukanta,2,12
and Karen L. Mohlke1,*
Genome-wide association studies (GWASs) have identified thousands of genetic loci associated with cardiometabolic traits including type 2 diabetes (T2D), lipid levels, body fat distribution, and adiposity, although most causal genes remain unknown. We used subcu-taneous adipose tissue RNA-seq data from 434 Finnish men from the METSIM study to identify 9,687 primary and 2,785 secondarycis -expression quantitative trait loci (eQTL;<1 Mb from TSS, FDR<1%). Compared to primary eQTL signals, secondary eQTL signals were located further from transcription start sites, had smaller effect sizes, and were less enriched in adipose tissue regulatory elements compared to primary signals. Among 2,843 cardiometabolic GWAS signals, 262 colocalized by LD and conditional analysis with 318 transcripts as primary and conditionally distinct secondarycis-eQTLs, including some across ancestries. Of cardiometabolic traits exam-ined for adipose tissue eQTL colocalizations, waist-hip ratio (WHR) and circulating lipid traits had the highest percentage of colocalized eQTLs (15% and 14%, respectively). Among alleles associated with increased cardiometabolic GWAS risk, approximately half (53%) were associated with decreased gene expression level. Mediation analyses of colocalized genes and cardiometabolic traits within the 434 in-dividuals provided further evidence that gene expression influences variant-trait associations. These results identify hundreds of candi-date genes that may act in adipose tissue to influence cardiometabolic traits.
Introduction
Excess adipose tissue, especially in central abdominal de-pots, is associated with increased cardiometabolic risk1,2 and mortality.3 Subcutaneous adipose tissue expands to store additional lipids and serves as a buffering system for lipid energy balance, especially for fatty acids,4,5 providing a protective role in metabolic risk.6 However, expansion of adipocyte size, rather than formation of new adipocytes has also been linked to insulin resistance.5,7
Genome-wide association studies (GWASs) have identi-fied thousands of loci for hundreds of human traits, but most functional variants, genes affected by variants, and mechanisms remain elusive. Identification of genetic vari-ants associated with gene expression level (eQTLs) in rele-vant tissues has proven useful to link non-coding GWAS variants to plausible candidate genes that may influence complex traits.8While 94% of eQTLs are shared across at least two tissues,8some are specific to one tissue or a subset
of tissues, necessitating the study of tissues that potentially contribute to GWAS traits to identify candidate genes.
Recently, eQTL studies have begun to identify additional eQTL signals through conditional analysis9–11in addition to the more commonly reported primary eQTLs. These additional conditionally distinct secondary eQTL signals are widespread and located more distal than primary sig-nals from the transcription start sites of the associated genes.9,10 The additional eQTL signals have also been shown to colocalize with GWAS loci,10 suggesting that they can detect additional candidate genes.
Previous studies have identified adipose tissuecis-eQTLs and tested for colocalizations of eQTL signals with cardio-metabolic GWAS loci.12–15 Additionally, GWASs have re-ported colocalized subcutaneous adipose cis-eQTLs with loci for body mass index (BMI), waist-hip ratio (WHR), WHR adjusted for BMI (WHRadjBMI), type 2 diabetes (T2D), circulating lipid levels, and adiponectin, a hormone produced by adipocytes that regulates glucose levels and fatty acid breakdown.16–20 However, colocalization
1Department of Genetics, University of North Carolina, Chapel Hill, NC 27599, USA;2Department of Human Genetics, David Geffen School of Medicine at
UCLA, Los Angeles, CA 90095, USA;3Department of Medicine, David Geffen School of Medicine at UCLA, Los Angeles, CA 90095, USA;4Department of
Biostatistics, University of North Carolina, Chapel Hill, NC 27599, USA;5Department of Biostatistics and Center for Statistical Genetics, School of Public
Health, University of Michigan, Ann Arbor, MI 48109, USA;6Center for Biomedicine, European Academy of Bolzano/Bozen, University of Lu¨beck, Bolzano/ Bozen 39100, Italy;7McDonnell Genome Institute, Washington University School of Medicine, St. Louis, MO 63110, USA;8National Human Genome
Research Institute, National Institutes of Health, Bethesda, MD 20892, USA;9Department of Biomedical Engineering, University of Virginia,
Charlottes-ville, VA 22908, USA;10Department of Biology, University of North Carolina, Chapel Hill, NC 27599, USA;11Institute of Clinical Medicine, Kuopio
Uni-versity Hospital, UniUni-versity of Eastern Finland, Kuopio 70210, Finland;12Institute for Precision Health, David Geffen School of Medicine at UCLA, Los
Angeles, CA 90095, USA
13Present address: Pfizer Worldwide Research, Development, and Medical, Cambridge, MA 02139, USA
*Correspondence:[email protected]
presents its own challenges, particularly when the GWASs and eQTL studies are from different ancestries or when multiple, conditionally distinct signals exist.
Here, we describe the analysis of subcutaneous adipose tissue gene expression levels from 434 participants in the METabolic Syndrome in Men (METSIM) study. METSIM participants have been well characterized for detailed clin-ical phenotypes, including metabolic and cardiovascular traits such as plasma lipids, anthropometric, and glycemic traits.21We identified and characterized primary and sec-ondarycis-eQTL genes that colocalize with GWAS loci for BMI, cholesterol and triglyceride levels, WHR and WHRadjBMI, T2D, adiponectin, cardiovascular endpoints, and other cardiometabolic traits. We further associated gene expression level with cardiometabolic trait levels in the METSIM cohort and identify the genes that show the strongest evidence of mediating the variant to trait associations.
Subjects and Methods
METSIM Study Participants and Sample Characteristics
METSIM is a population-based cohort composed of 10,197 males of Finnish ancestry from Kuopio, Finland.21For this analysis, we used a subset of 550 participants from whom subcutaneous adi-pose tissue had been collected near the umbilicus by needle bi-opsy. The METSIM study was approved by the Ethics Committee of the University of Eastern Finland and Kuopio University Hospi-tal in Kuopio, Finland and carried out in accordance with the Hel-sinki Declaration. Written informed consent was obtained from all participants.
Genotypes were measured using the Illumina OmniExpress BeadChip array and the Illumina HumanCoreExome at the Center for Inherited Disease Research (Baltimore, MD). Genotyping qual-ity control (QC) and imputation to the Haplotype Reference Con-sortium (HRC) panel22have been previously described.12For this study, we filtered HRC-imputed genotypes to retain 7.8 million variants with minor allele frequency (MAF)>0.01 and imputation quality, r2>0.3.
RNA Extraction and Sequencing
Following the adipose tissue biopsies, total mRNA was isolated us-ing the Qiagen miRNeasy kit (Qiagen), followus-ing the manufac-turer’s instructions. mRNA was isolated with a polyAþselection protocol (Illumina TruSeq RNA Sample Preparation Kit v2) and sequenced on the Illumina HiSeq 2000 platform at the University of California Los Angeles Neuroscience Genomics Core (UNGC) to an average sequencing depth of 45 million paired-end 50 bp reads. Reads were filtered using the Fastx-toolkit requiring 80% of bases to have phred quality>20. Reads containing linker and adapter sequences were removed using TagDust (seeWeb Resources). We implemented STAR (v.2.4.2a)23 to align reads to the hg19/ GRCh37 human genome reference sequence,24using GENCODE v19 (July 2013 freeze) as the annotation. Duplicate reads were re-tained. Read pairs with unpaired alignments were removed. The average uniquely mapped reads across all samples was 82.2%.
To ensure RNA samples were matched with the correct geno-types, we applied MixupMapper,25 verifyBamID,26 and GATK best practice guidelines (seeWeb Resources) to call variants from
RNA-seq data and assign best matches between the RNA-seq and genotype data. We retained samples that matched DNA genotypes corresponding to the expected self-sample for at least one method.
Expression Quantification and Sample Level QC
To identify fragments mapping to transcript isoforms, we used Salmon (v.0.7.2)27and provided GENCODE v.19 as annotation; to correct for bias in isoform abundance estimates due to technical biases resulting from GC content, we used the –gcBias option. Iso-form abundances were collapsed to the gene-level, and transcript per million (TPM) values were calculated using tximport (v.1.0.3).28To remove genes with limited evidence of expression, we retained genes withR5 reads in>25% of samples, resulting in using 21,735 genes of 57,821 forcis-eQTL analysis.
To assess the tissue heterogeneity of tissue samples, we used the unmix function in DESeq229to estimate the percent composition of whole blood, Epstein Barr virus (EBV)-transformed lympho-cytes, skeletal muscle, and subcutaneous adipose, using Geno-type-Tissue Expression (GTEx) v7 median TPM values per tissue as reference.30 We examined the expression of adipose-specific genes in three sample sets: all samples (n¼550) and the subsets comprised of samples with approximately>50% adipose compo-sition (n¼434) and>75% adipose composition (n¼387).
eQTL Mapping
To adjust for the known and unknown technical factors that influ-ence gene expression estimates, we inverse normal transformed gene-level TPMs and implemented probabilistic estimation of expression residuals (PEER)31 and inverse normal transformed again, since both PEER and eQTL detection require data in a normal distribution. To optimize for cis-eQTL discovery, we performed PEER analysis including differing numbers of factors (k¼10 to 90) at intervals of 10. We next performedcis-eQTL detec-tion using FastQTL (v.2.184)32on all variants within 1 Mb of the TSS of each gene and assessed the total number ofcis-eQTLs and the number of genes associated with R1 variant with various PEER factor values. We selected 60 PEER factors to maximize the number ofcis-eQTLs identified. We next implemented FastQTL permutation testing to estimate adjusted p values and calculated the p values corresponding to 1% FDR using the qvalue package in R (p<9.63106) to account for genome-wide eQTL testing of variants within 1 Mb of each transcript and determine the sig-nificance threshold.
To identify conditionally distinctcis-eQTLs, we first identified all genes withR1 significantly associated variant at FDR<1% and the lead variant for each of these genes. We then included the dosage values of the lead variant for each gene as a covariate for eQTL mapping using FastQTL. Conditional secondary eQTLs were considered significant at FDR<1% for primarycis-eQTLs (p<9.6310-6).
variants>1 Mb away from the transcription start site (TSS); the sig-nificance threshold for identifyingtrans-eQTLs was calculated us-ing the Bonferroni correction (p<3.431013).
eQTL Validation
For validation, we compared eQTLs with the significant eQTLs from the GTEx Project V7 release for both subcutaneous (n¼385) and visceral adipose (n¼313) tissue. For variant-gene pairs available in both files, we matched the effect alleles to compare the direction of effect. To ensure that groups of variants associated with the same gene did not inflate replication estimates, we limited this analysis to the lead variants for each gene in either METSIM or GTEx. We used the lead variant for each gene from one study and assessed whether that variant was significant for the same gene in the other study. We then counted the number of variant-gene pairs that showed a consistent direction of effect and met several different p value thresholds between 53103 and 53108in both studies.
eQTL Enrichment in Adipose Tissue Open Chromatin and Roadmap Adipose Nuclei Chromatin States
We compiled a set of adipose tissue transcriptional regulatory ele-ments from tissue-derived adipose nuclei chromatin states from the Roadmap Epigenomics Consortium38and METSIM adipose tis-sue accessible chromatin regions39generated using an Assay for Transposase-Accessible Chromatin (ATAC-seq).40 For Roadmap chromatin states, we used the 18 state chromatin model and selected promoter states (1_TssA, 2_TssFlnk, 3_TssFlnkU, 4_TssFlnkD, 14_TssBiv) and enhancer states (7_EnhG1, 8_EnhG2, 9_EnhA1, 10_EnhA2, 11_EnhWk, 15_EnhBiv). We defined adipose tissue accessible chromatin regions as the union of ATAC-seq peaks across three METSIM subcutaneous adipose samples.39 We also tested for enrichment among the subsets of ATAC-seq peaks that overlapped Roadmap adipose nuclei promoters and enhancers,38 requiring that a peak be completely contained within the epige-nomic region. We pruned eQTL variants based on linkage disequi-librium (LD, r2>0.2) usingswissto prevent variants in nominal LD with each other from inflating enrichment estimates. We selected background variants using GREGOR;41variants were matched on allele frequency, distance to gene, and LD (r2>0.8; 1000 Genomes phase 1, in a 1 Mb window). Background variants were then pruned withswissusing the same parameters as for significant eQTLs. We removed background variants that were themselves significant eQTLs at FDR<1% (primary or secondary signals) or that were in high LD (r2>0.8) with an eQTL lead variant (primary or secondary signals). We tested for enrichment using logistic regression, regress-ing the eQTL status of a variant (1¼significant eQTL, 0¼not eQTL), against whether that variant overlapped a given genomic annotation (1¼overlapped, 0¼not overlapped). An eQTL or back-ground variant was considered to overlap a genomic annotation if it or any of its LD proxies (r2>0.8, 1000 Genomes phase 1) overlap-ped the annotation. Enrichment was defined as the beta of the regression model, which is the log of the odds ratio that a variant is an eQTL if it overlaps the given genomic annotation.
To compare the effect sizes of eQTL signals that overlap various genomic annotations, we used the lead eQTL variant and all vari-ants in high LD (r2>0.8) to identify overlaps with promoters, en-hancers, and ATAC-seq peaks, stratified by primary and secondary eQTLs. We then used the effect size of the lead variant of the over-lapping eQTLs to test for differences in the strength of effect among different annotations using a Wilcoxon rank sum test.
Selection of GWAS Loci and GWAS-eQTL Colocalization
We downloaded the NHGRI-EBI GWAS catalog42 in December 2017 and extracted 4,588 GWAS variants associated with one or more of 93 cardiometabolic traits (Table S8) at genome-wide signif-icance (p<53108) and then added results from five additional large GWASs for cardiometabolic traits.18,19,43–45To ensure that GWAS variants representing the same signal did not inflate coloc-alization estimates, we performed LD pruning usingswiss(seeWeb Resources) across all traits; variants were ranked by p value, and variants in LD r2R0.8 in METSIM with the lead variant at each locus were removed. We defined the GWAS risk allele as the variant associated with a disease state or with the higher quantitative trait level, except for adiponectin and high-density lipoprotein (HDL) cholesterol levels, for which we defined the risk effect allele as associated with a lower trait level as these indicate poorer health outcomes.
We performed initial colocalization analysis based on LD between a lead GWAS variant and a lead eQTL variant. We then performed conditional analysis in the eQTL data by providing ge-notypes for the lead GWAS variant to FastQTL as a covariate. We considered signals to be colocalized if (1) the pairwise LD was high between the GWAS variant and eQTL variants (r2R0.8 in METSIM) and (2) after conditioning on the GWAS variant, the lead eQTL variant no longer met the 1% FDR equivalent p value (p>9.63106).
To identify METSIM variant-gene pairs that were observed in 13 GTEx tissues (n>300 in GTEx v.7; seeTable S10for the tissues tested), we first determined whether variants of colocalized variant-gene pairs observed in METSIM were significant eQTLs in GTEx (FDR<5%). We next identified the lead eQTL variant in GTEx and calculated the LD r2(1000 Genomes, phase 3 EUR) between the lead GWAS variant and the lead eQTL variant. We considered these signals to be colocalized if the variants were in strong LD (r2R0.8).
We further performed GWAS colocalizations with METSIM eQTLs using variants for additional non-cardiometabolic GWAS traits. For these analyses, we initially used all variants, without pruning by pairwise LD or distance. We considered signals to be colocalized if the lead GWAS variant and lead eQTL variant were in strong LD (r2R0.8 in METSIM). After colocalization, we per-formed LD pruning, removing variants in LD r2>0.8 in METSIM with the lead GWAS variant, to estimate the number of unique GWAS signals with colocalized eQTLs.
GWAS and eQTL, to 13106. We selected this more conservative value than coloc’s default p12 prior (13105) because we are using coloc to provide additional support for conditional analysis results based on LD and conditional analysis. We evaluated the posterior probabilities that correspond to H3and H4, that both the GWAS and the eQTL have signals, but that they are not the same (PP3) and that the GWAS and eQTL signals colocalize (PP4), respectively. We considered the signals to have strong evidence of colocalization if PP4>0.8.
Trait-Gene Expression Association
For 287 genes that showed evidence of GWAS signal colocalization with a primary eQTL signal based on LD and conditional analysis, we tested for association between gene expression level and each of the 20 cardiometabolic traits measured in the 434 individuals (for a list of traits, seeTables S14andS15). We adjusted traits for age and gene expression level for TIN, sequencing batch, and age. Following inverse normal transformation of both trait- and expression-level residuals, we used linear regression to test for as-sociation between the gene expression levels and traits. Because adipose expression level of a large number of genes is associated with BMI, we also performed these analyses additionally adjusting both gene expression levels and traits for BMI. The p value corre-sponding to 5% FDR was calculated using the qvalue package in R.
Mediation Analysis
Mediation analyses were conducted in 434 METSIM individuals using a procedure described by Imai et al.,47 similar to that of Huang et al.,48implemented in R and Cþþ, assuming an additive effect and modified for a continuous outcome. We performed mediation analyses only when the eQTL and GWAS data were co-localized and trait data for the GWAS trait itself or a similar trait was available for METSIM individuals, specifically testing fasting glucose, fasting insulin, Matsuda index, and HOMA-bfor T2D. We determined the effect of a variant on a trait through the medi-ator of gene expression, the effect of the variant on the trait when the mediator is held constant, and the combined effect, which is the sum of the mediation and variant-trait effects. This method uses two least squares regression models, where the first model uses the variant genotype, coded as 0, 1, or 2, as the predictor and the mediator of gene expression as the response, and the sec-ond model uses both gene expression level and variant genotype as predictors and the trait outcome as the response. The mediation effect was estimated by the product of coefficients from the two linear regression models. We assumed that the individual effects were linear and that there is not an interactive effect between the variant and mediator on the outcome. Confidence intervals for the mediating effect were calculated using Monte Carlo simu-lations. We seta¼0:05 and calculated 95% confidence intervals corresponding to a possible range for the estimates of the effect. Confidence intervals that did not include 0 were considered evi-dence of a mediating effect.
Results
Analysis of Tissue Heterogeneity
To identifycis-eQTLs for subcutaneous adipose tissue, we performed RNA-seq on needle biopsy samples obtained from 550 Finnish men in the METSIM study (Table S1). Ad-ipose tissue is comprised of adipocytes, pre-adipocytes,
endothelial cells, and various immune cells,49,50and nee-dle biopsies of adipose tissue can include whole blood and/or muscle. The resulting heterogeneity between samples can confound the analysis of bulk tissue transcrip-tomics,51–53 but its effects can be mitigated by tissue de-convolution methods. We estimated tissue composition using tissue from GTEx as reference tissue profiles
(Figure S1). We found wide variation in the estimated
per-centage of adipose tissue within our samples. To determine whether to limit the analysis to higher-purity samples or to retain the larger sample size including lower-quality ples, we compared eQTL results from the set of all 550 sam-ples to subsets of samsam-ples with estimated adipose tissue percentage of approximately>50% (n¼434) and>75% (n ¼ 387). For all three sample sets, we performed cis -eQTL analyses with a range of PEER factor corrections us-ing 7.8M variants and 21,735 genes. We then compared the strength of association at three previously described adipose eQTL loci12,13 and counted the total number of variant-gene associations observed (Tables S2 and S3). The known eQTLs showed the strongest associations within the>50% adipose subset (Table S3). The 50% adi-pose subset also had the most significantcis-eQTL variants (1.6M versus 1.5M and 1.4M, for the 50%, all, and 75% sample sets, respectively) and the most variant-gene pairs (3.0M versus 2.8M and 2.5M, for the 50%, all, and 75% sample sets, Table S2). These results suggest that the het-erogeneity between samples in the full sample set of 550 samples and the smaller sample size of the 387 samples with >75% adipose attenuated the association signals and that requiring samples to contain>50% adipose tissue (n¼434) yielded a set ofcis-eQTL results that best corre-spond to adipose tissue; thus, we performed all subsequent analyses using the subset of 434 samples.
eQTL Identification and Characterization
We performed genome-widecis-eQTL analyses using7.8 million genetic variants (MAF>0.01) from the 434 samples with>50% adipose tissue and 21,735 genes. Of these, 9,687 genes were associated with at least one variant located within 1 Mb of the TSS (FDR<1%, p<9.63106). The first and second PEER factors correlated with TIN36and esti-mated percent adipose tissue, respectively (Figure S2).
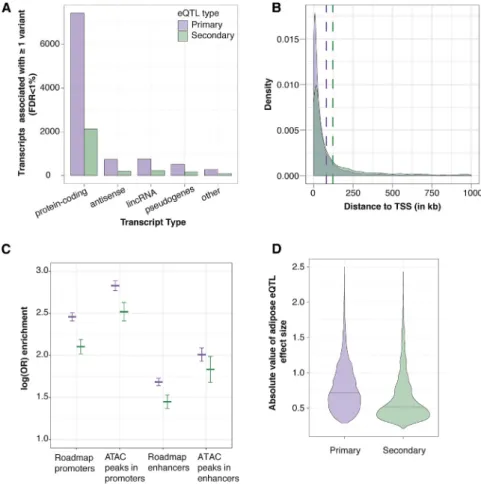
Secondary association signals are frequently identified at eQTL loci and may reflect more complex gene regula-tion.9,10Of 9,687 genes that exhibited primary eQTL sig-nals, 2,785 genes (28.7%) showed a significant secondary cis-eQTL (FDR<1%, p<9.63106). The proportions of transcript types with primary and secondary cis -eQTLs were not significantly different from each other (c2 p ¼ 0.42, Figure 1A). Secondary eQTLs have been reported to be located farther away from the TSS than pri-mary eQTLs.9,10We also observed this pattern: the distri-bution of distances to TSS for secondary eQTLs (median¼40.3 kb) was significantly higher than for pri-mary eQTLs (median¼26.7 kb, Mann Whitney U-test, p
<2.231016;Figure 1B). The identification of secondary
eQTL signals in subcutaneous adipose tissue greatly expanded the set ofcis-eQTL signals for available further investigation.
To characterize the potential function of the primary and secondary eQTL signals, we evaluated the enrichment of and effect sizes of the lead variant and LD proxies compared to adipose nuclei chromatin states (promoters, enhancers) defined by the Roadmap Epigenomics Project38and METSIM adipose tissue open chromatin as measured by ATAC-seq.39Lead variants of primary eQTL signals were more enriched in open chromatin, promoters, and enhancers than matched control variants, especially in open chromatin regions within promoters (p < 2 3 10308; b ¼ 2.83). Secondary eQTL variants showed a
Figure 1. Comparison of Primary and Secondary eQTL Association Signals
(A) For each type of transcript (x-axis), the number of transcripts associated with at least one nearby variant that met the genome-wide FDR<1% is shown (y-axis). (B) Density plot showing the distance from the lead eQTL variant to the TSS. Dashed lines represent the median distance to the TSS for primary (purple) and secondary (green) eQTLs.
(C) Enrichment of primary and secondary eQTLs in chromatin marks from Roadmap adipose nuclei chromatin marks and open chromatin ATAC-seq peaks from adipose tissue. The horizontal lines represent the logistic regression coefficient for enrich-ment with vertical lines representing the 95% confidence interval around the coefficient.
(D) Absolute value of the effect sizes of eQTL variants that overlap Roadmap adi-pose nuclei promoters and enhancers. Black horizontal lines represent the me-dian effect size for primary and secondary eQTL variants.
similar but weaker pattern of enrich-ment in all categories, even for a matched number of eQTL genes
(Table S5; Figure 1C). Further, effect
sizes for primary eQTL variants were significantly larger than those of secondary eQTL variants found within promoters and enhancers (Wilcoxon rank sum test, p¼4.3310131;Figure 1D). Including both pri-mary and secondary eQTL variants, effect sizes of variants within promoters were significantly larger than variants within enhancers (p¼8.131012;Figure S3), and effect sizes of variants within open chromatin in promoters were significantly larger than promoter variants generally (p ¼ 3.23 105). We observed no significant difference in the effect sizes between variants within open chromatin in enhancers and all enhancer variants. These results indi-cate that eQTL variants within promoters, particularly those in open chromatin, have larger effects on expression levels of nearby associated genes than those variants in enhancers.
To identify variants that influence the expression of distal genes and contribute to regulatory networks in adi-pose tissue, we performed a trans-eQTL analysis using 7.8M variants (MAF > 0.01) and 18,553 protein-coding and lncRNA transcripts, requiring variants to be >1 Mb away from the TSS. Accounting for the number of tests per-formed (Bonferroni, p < 3.4 3 1013), we identified 4,432 target genes, and at a relaxed significance threshold (p< 53 108), we identified 13,953 target genes, repre-senting 24% and 75% of genes tested, respectively (Table S6). At the known adipose-specific trans-eQTL hub near
KLF14,12,54which is also a known GWAS locus for
rs4731702 as the lead KLF14 cis-eQTL variant and vali-dated (p<53108) the distal association of this variant with expression level of one known target gene,PRMT2, and two additional target genes,SNX14 andRBBP7, not previously reported12,54 (Table S7). This male-only METSIM study detected fewertrans-eQTL associations for
KLF14 than the larger female-only TwinsUK study,54
consistent with power and the reported stronger effects in females at this locus.57
Colocalization of eQTLs and Cardiometabolic GWAS Loci
While thousands of cardiometabolic GWAS loci have been identified, many of the genes underlying these associa-tions remain unknown. We evaluated cis-eQTLs for evi-dence of colocalization with 2,843 GWAS signals (variants clumped by LD r2R0.8) associated with one or more of 93 cardiometabolic traits and available in ourcis-eQTL data
(Table S8). Of the 2,843 GWAS signals, 874 (30.7%) were
significantly associated with at least one nearby (<1 Mb) gene at FDR< 1% (Table S9). Using LD and conditional analysis (seeSubjects and Methods), we identified colocal-izations of 231 GWAS variants with expression of 287 genes, described further below as GWAS-colocalized pri-mary eQTLs. Of these GWAS-eQTL colocalizations, only 125 (43%) were detected in GTEx subcutaneous adipose data (GTEx n ¼ 385, FDR < 5%) (Tables S10 and S11). Among 12 additional tissues with at least 300 samples, only 59–102 (21%–36%) of these colocalizations were de-tected (Tables S10andS11).
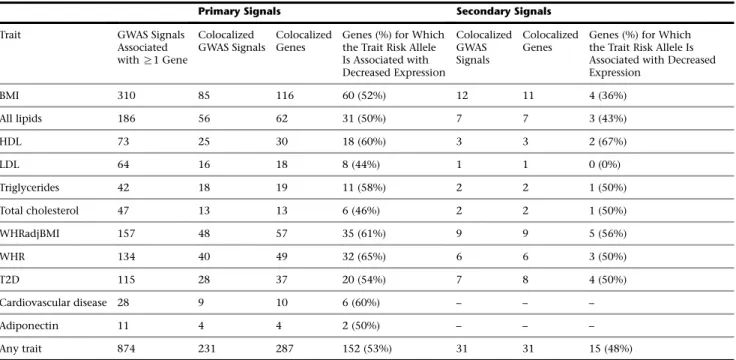
Colocalized GWAS and eQTL signals suggest potential candidate genes for cardiometabolic risk. Among the 287 primary eQTL genes colocalized with a GWAS trait, eQTLs for 116 genes were identified at BMI loci, 62 genes for lipid traits, 57 genes for WHRadjBMI, 37 genes for T2D, and 10 genes for cardiovascular disease (Table 1). These colocaliza-tions were based on differing numbers of GWAS signals per trait; to identify the proportion of GWAS signals with colo-calized eQTLs for each trait, we compared the total number of signals reported by five recent GWAS publications for BMI, lipids, WHR, WHRadjBMI, and T2D, which reported between 79 and 851 conditionally distinct GWAS signals per trait, to the number of signals with a colocalized eQTL signal from those same studies. Across traits from five studies,18,19,43–45 the proportion of signals found to be colocalized ranged from 8% for T2D and BMI to 12% for WHRadjBMI, 14% for all lipids, and 15% for WHR
(Table S12). Among additional non-cardiometabolic
GWAS signals, we observed the highest proportion of colo-calized signals for blood cell traits and autoimmune diseases (Tables S13andS14). These results suggest that ad-ipose tissue gene expression levels are relevant to a broad set of cardiometabolic and other GWAS traits, potentially reflecting the cell types present in adipose tissue.
Genes may influence disease risk by downregulating or upregulating expression level or function.58To assess the direction of effect of GWAS signals on gene expression level, we matched the GWAS risk alleles to the gene expres-sion effect alleles (see Subjects and Methods). Across all primary colocalized loci, the GWAS trait risk allele
Table 1. Primary and Secondary eQTLs Colocalized at GWAS Loci
Primary Signals Secondary Signals
Trait GWAS Signals
Associated withR1 Gene
Colocalized GWAS Signals
Colocalized Genes
Genes (%) for Which the Trait Risk Allele Is Associated with Decreased Expression
Colocalized GWAS Signals
Colocalized Genes
Genes (%) for Which the Trait Risk Allele Is Associated with Decreased Expression
BMI 310 85 116 60 (52%) 12 11 4 (36%)
All lipids 186 56 62 31 (50%) 7 7 3 (43%)
HDL 73 25 30 18 (60%) 3 3 2 (67%)
LDL 64 16 18 8 (44%) 1 1 0 (0%)
Triglycerides 42 18 19 11 (58%) 2 2 1 (50%)
Total cholesterol 47 13 13 6 (46%) 2 2 1 (50%)
WHRadjBMI 157 48 57 35 (61%) 9 9 5 (56%)
WHR 134 40 49 32 (65%) 6 6 3 (50%)
T2D 115 28 37 20 (54%) 7 8 4 (50%)
Cardiovascular disease 28 9 10 6 (60%) – – –
Adiponectin 11 4 4 2 (50%) – – –
Any trait 874 231 287 152 (53%) 31 31 15 (48%)
corresponded to decreased gene expression for 53% of transcripts (Table 1;Figures 2andS4), with a range from 44% for LDL loci to 65% for WHR loci. These results show that for common complex traits, disease risk is asso-ciated with decreased gene expression level for about half of all colocalized signals.
We also evaluated secondary eQTL signals for colocaliza-tion with the initial 2,843 GWAS signals. Of 154 lead
GWAS variants associated (FDR < 1%) with a secondary eQTL signal for at least one nearby gene (Table S15), 31 eQTL signals for 31 transcripts were colocalized at GWAS loci. Of these, 10 (32.3%) variants showed evidence of co-localization with at least one primary eQTL gene and with a different secondary eQTL gene. The other 21 variants (67.7%) did not demonstrate any evidence of colocaliza-tion with a primary eQTL signal such that no gene would Figure 2. Cardiometabolic GWAS and eQTL Colocalizations, Stratified by Trait
have been identified using primary eQTLs alone. We did not observe the same gene to be colocalized with a GWAS variant for both a primary and secondary eQTL. For example, the lead variant rs11724804 from a WHR and WHRadjBMI locus is not colocalized with the primary eQTL signal for DGKQ via conditional analysis (rs11731377; LD r2¼ 0.26) but was colocalized with the secondary eQTL signal for DGKQ, rs13101828, based on LD and conditional analysis (r2¼1.0;Figure 3). In hepatic cells, silencing DGKQ decreased the ability of synthetic FXR ligand to promote phosphorylation of mTOR, Akt, and FoxO1,59 and misregulation of the mTOR pathway has been shown to result in peripheral insulin resistance and to promote adipogenesis and lipogenesis in adipose tissue.60These results suggest that colocalization of sec-ondary eQTLs can identify substantially more GWAS loci for which at least one potential candidate gene can provide insights into GWAS biology, than primary eQTL colocaliza-tions alone.
For a subset of the 287 GWAS-colocalized primary eQTLs for which GWAS summary statistics were available (n¼173; BMI, WHR, WHRadjBMI, and T2D), we further investigated colocalization of primary eQTL signals by applying coloc2, a Bayesian colocalization test that uses summary statistics10,46(Table S16). Of 173 genes tested, 81 showed strong or moderate evidence of GWAS-eQTL co-localization (coloc2 posterior probability H4 > 0.8 and H4 > 0.5, respectively). An additional 82 genes showed strong or moderate posterior probabilities that did not sup-port colocalized signals (coloc2 H3 > 0.8 and H3 > 0.5, respectively), which was especially unexpected for nine signals with the same lead variant in both the GWAS and eQTL data and 31 signals with very strong pairwise LD (r2>0.95) between lead GWAS and eQTL variants. A com-parison of GWAS and eQTL association plots (e.g.,
Figure S5;Table S16) showed the GWAS and eQTL signals
are very similar and suggests that coloc2 is sensitive to additional nearby GWAS and eQTL signals.
Cross-ancestry Colocalization Analysis
Colocalization methods rely on examining association patterns in GWAS and eQTL studies for similarity; associa-tion patterns can differ due to the extent of LD in a region, which can vary by ancestry. We further examined LD pat-terns incis-eQTLs discovered in Finns for a subset of the BMI GWAS loci that were discovered in individuals from Japan (Tables S9andS17,Figure 4). We evaluated the LD r2 values between the GWAS variant and eSNP in both the Finnish eQTL population and in East Asian 1000G data. Of the six loci (corresponding to nine eQTL tran-scripts) that met the GWAS variant-eSNP colocalization LD threshold (r2>0.8) in Finns, lead variants at four loci had similar pairwise LD in East Asians and two had lower LD in East Asians (Table S17).
As an example of similar LD patterns across populations, the lead BMI-associated variant near GON4L in Japanese individuals,61rs860295, was also the lead eSNP forDAP3 Figure 3. A WHRadjBMI Signal Colocalizes with the Secondary
eQTL forDGKQ
(Figure 4A). Similar to previous examples comparing GWAS and eQTL signals within one ancestry, the similar patterns of GWAS and eQTL association signals here sug-gestDAP3as a candidate gene for the observed association with BMI. DAP3 has been shown to mediate interferon gamma-induced cell death,62which is involved in pro-in-flammatory responses related to obesity.63 Of note, a GWAS in Europeans43also identified BMI-associated vari-ants in this chromosomal region, although the European and Japanese GWAS variants exhibited low pairwise LD (r2¼0.32 in 1000 Genomes East Asians and r2¼0.35 in Finns) and the European signal was not colocalized with any genes (Table S9). While further characterization of the locus may identify additional candidate genes, the shared LD patterns support cross-ancestry conclusions of colocalized GWAS and eQTL signals.
Two GWAS-eQTL signals we considered to be colocalized showed high LD (r2R0.8) between the lead GWAS and eSNP in Finns but not in East Asians. The lead GWAS variant at the IL27/NUPR1 East Asian BMI locus, rs62034325, is acis-eQTL forSULT1A2(p¼1.0331027; b¼0.67;Figure 4B). LD between the lead GWAS variant and the eSNP, rs28698667, is high in Finns (r2 ¼ 0.93) but low in East Asians (r2¼0.22). However, LD between the lead GWAS variant and other near-lead eQTL variants
(e.g., rs62034322, p¼1.0231027;b ¼0.67) is high in both Finns (r2¼1.0) and East Asians (r2¼0.89), and con-ditional analyses in the eQTL data (pcond ¼1.613103) showed that these signals are colocalized. The SULT1A2 eQTL signal in Finns consists of more variants than the BMI signal in Japanese, and the BMI-associated variants appear to be a subset of the eQTL variants.SULT1A2 cata-lyzes the sulfate conjugation of estrogens, estrogenic alkyl-phenols, and 17-b-estradiol, to facilitate their removal from the body,64and increased levels of 17-b-estradiol are associated with obesity;65 in addition, SULT1A1 levels were altered in adipose tissue of rats on a high fat diet.66 These results are consistent with the dependence of all co-localization methods on patterns of association that vary by ancestry and suggest that, regardless of GWAS study ancestry, LD-based methods to assess colocalization should focus on the eQTL study population.
Cardiometabolic Trait Association with Expression Level of eQTL-GWAS Colocalized Genes
To further investigate the 287 genes identified based on co-localized primary eQTL-GWAS signals, we tested for associ-ation of expression level with 20 cardiometabolic traits measured in the same 434 METSIM individuals. Because BMI is correlated with the expression level of a high Figure 4. Cross-ancestry Comparison of Colocalized GWAS-eQTL Signals
Locus plots showing the regional associations for BMI in Japanese individuals,61colored by East Asian LD (EAS) (top) and gene expres-sion in Finns (bottom), colored by Finnish LD.
(A) ADAP3eQTL signal is colocalized with a BMI signal nearGON4L. The lead variant is shared between the GWAS and eQTL studies and the patterns of association are similar.
percentage (51%) of all genes in our study, we performed gene-trait associations with and without adjustment for BMI (Tables S18andS19). Without adjustment for BMI, expression levels of 154 genes were associated with at least one trait, and with adjustment for BMI, expression levels of 49 genes were associated with a trait. The difference be-tween the analysis with and without adjustment for BMI may demonstrate the influence of this trait on adipose tis-sue gene expression levels. This difference also could be due to gene expression and cardiometabolic traits influ-encing BMI (collider bias). We recommend caution inter-preting association results when a gene’s expression level is associated with BMI (Table S18), as collider bias can alter the effect size and significance level of the association. The traits associated with expression level of the most genes were Matsuda index, WHR, and triglycerides. For example, at a WHRadjBMI locus, EIF4G2, also known as DAP5, was significantly associated with fasting free fatty acids (p¼3.03105) and with Matsuda index, a measure of in-sulin sensitivity67(p¼7.23105) (Table S19), andEIF4G2 was not associated with BMI (Table S18), suggesting that this gene may affect these traits. EIF4G2 is thought to play a role in the interferon gamma-induced cell death pathway.68Association between adipose gene expression level and clinical traits provides an additional line of evi-dence that changes in expression of the colocalized genes may influence quantitative traits and disease risk.
Mediation Analysis
We next evaluated colocalized signals for evidence that gene expression mediates the effect of a GWAS variant on a cardiometabolic trait. We estimated the mediating ef-fect of a variant on a trait level through gene expression level, adjusted for age, relevant covariates, and BMI (except when evaluating BMI as an outcome; see Subjects and
Methodsfor covariates). Of note, observing mediation
de-pends on detecting effects of variants on traits in only 434 individuals. Among the colocalized loci, we tested media-tion paths only at loci for which a trait comparable to the reported GWAS signal had been measured in the indi-viduals with gene expression data; this choice resulted in testing the same variant and gene for multiple traits in some cases, leading to more potential mediations than co-localized signals. Of 348 potential mediations, 90 (25.9%) showed evidence of gene expression mediating the effect of an association signal on a trait (the 95% CI of a media-tion effect, ME, does not include 0;Table S20). We focused on signals with nominal evidence of the combined effect of mediation and a direct effect of the GWAS variant on the trait (p < 0.05, Table 2). Of these, at least four loci have functions relevant to cardiometabolic traits. For example, at a well-characterized GWAS locus for adiponec-tin levels, adipose expression level of CDH13, which en-codes a receptor for high-molecular-weight adiponectin multimers,69mediates the effect of rs12051272 on plasma adiponectin levels (ME ¼ 0.34; CI [0.086, 0.63]). At another GWAS locus, MLXIPL (also known as ChREBP)
mediates the variant effect on triglyceride levels (ME ¼
0.12; CI [0.21,0.40]). In adipose tissue,MLXIPLhas been shown to regulate glucose homeostasis and fatty acid synthesis.70In addition, RSPO3 mediates the effect of rs72959041 on triglycerides (ME ¼ 0.12; CI [0.21,0.043]), andRSPO3activates the Wnt/b-catenin pathway which promotes angiogenesis,71suggesting a po-tential role in the expansion of adipose tissue. Finally,
JAZF1 mediates the effect of rs1708302 on BMI (ME ¼
0.17; CI [0.059, 0.30]); in adipocytes, overexpression of
JAZF1inhibits lipid accumulation and regulates lipid
meta-bolism.72 In addition to these well-characterized loci, expression level of CATSPERZ, also known as TEX40, mediates an association with BMI (ME¼ 0.23; CI [0.44, 0.065]), and expression level of ADH1A mediates an association with WHR (ME¼ 0.01; CI [0.016,0.005]).CATSPERZencodes a calcium ion chan-nel andADH1Aencodes a member of the alcohol dehydro-genase family; while neither gene has yet been directly linked to body size or fat distribution, these mediation re-sults support the eQTL colocalization and suggest that these genes play a role in obesity.
Discussion
We identified primary and secondarycis-eQTLs in subcu-taneous adipose from 434 Finnish males from the METSIM study and linked their gene expression levels to cardiome-tabolic GWAS signals and measures of 20 cardiomecardiome-tabolic traits. By colocalizing eQTL signals with 262 cardiometa-bolic trait GWAS signals, we identified 318 candidate genes, the highest proportion of which corresponded to traits with multiple biological pathways relevant to adi-pose tissue: WHR (15% of GWAS signals), lipids (14% of GWAS signals), and T2D (8% of GWAS signals). Additional integration of clinical trait information from the eQTL study participants through gene-trait association and mediation analysis provided further support of a role for these genes in cardiometabolic trait variation.
While GWASs have successfully identified thousands of genomic regions associated with cardiometabolic diseases and complex traits, the genes and mechanisms responsible for many of these loci remain unknown. Identifying candi-date transcripts for GWAS loci is relatively straightforward when one of the lead GWAS variants is predicted to cause a loss of gene function, but identifying candidate genes with a testable link to function is more ambiguous when all candidate GWAS variants are noncoding. Colocalized eQTL signals provide one of several approaches to identify reasonable candidate genes.73,74The value of eQTLs derives from the low prior probability that GWAS variants will by chance also be functional variants associated with a gene’s expression level. For our main colocalization analysis, we assumed that candidate functional variants would be among those that show the strongest association with both a GWAS trait and gene expression level. Consistent
with widespread evidence that expression levels of most genes are regulated by genetic variants,75 31% of lead GWAS variants in this study showed nominal evidence of association (FDR<1%) with expression levels of at least one transcript. Further evaluation of signal colocalization using one or more methods46,76–79is critical, because here only 1.3% of the associations showed the identical lead variant to be associated with both the GWAS and gene expression traits. Interpretation of colocalization can be challenging as comparison of signals is affected by sampling heterogeneity, the presence of multiple and/or differing GWAS and eQTL signals per locus, and differences in LD patterns between GWAS and eQTL study participants.
The use of eQTLs to detect candidate genes at GWAS loci is becoming more widespread, but colocalizations often consider only primary eQTL signals, which are most easily available via summary data. While primary eQTLs identi-fied 90% of the candidate genes detected here, analysis of secondary eQTLs detected another 21 genes that would have been missed by summary level analysis. These sec-ondary eQTLs may reflect parallel biology with primary eQTL signals or they may derive from a different underly-ing cell type present in bulk tissue samples. As eQTL study sample sizes increase and single-cell orin silicocell-type de-convolution technologies improve, studies will have more potential to detect multiple regulatory effects per gene.
Colocalization methods are imperfect and sensitive to the thresholds applied. In the LD and conditional analysis approach, we applied a threshold for LD between the GWAS variant and the eSNP as well as a threshold for evi-dence of association after conditional analysis. These thresholds are arbitrary and sensitive to the strength of the original eQTL signal, the use of lead variants subject to sampling variability, and a conditional analysis step that requires individual-level data. In comparison, coloc2 requires setting prior probabilities and thresholds for inter-preting posterior probabilities and is sensitive to the pres-ence of multiple signals in either the eQTL or the GWAS data. Further development of colocalization methods may improve the use of eQTLs for identifying candidate genes for GWAS loci.
between the GWAS variant and eSNP in both ancestries. Although some loci can be compared cleanly across ancestries, as eQTL studies in more diverse populations become available, comparing GWAS and eQTL signals within ancestries will likely provide stronger evidence of colocalization.
To further investigate causal relationships between ge-netic variants and clinical traits, we used the extensive phenotypic trait information available for the METSIM eQTL study participants and identified 49 genes associated with cardiometabolic traits at colocalized GWAS loci. Although Matsuda index, WHR, and triglycerides showed the most associations with genes, these traits did not exhibit the most variation between individuals, suggesting that even small changes in traits can result in association with colocalized genes. Because BMI is associated with nearly half of all genes in our data, the direction of the rela-tionship between BMI, related traits, and gene expression is hard to determine; expression level of a gene may affect BMI, or BMI may influence expression level of a gene and a trait independently. We further tested for effects of the var-iants mediated through gene expression on the GWAS trait or a related trait. The six highlighted mediations (Table 2) show not only an association between these variants, genes, and traits, but also a directional, and potentially causal, path. This mediation analysis method is limited by statistical power because it uses only the hundreds of in-dividuals with expression data to detect an effect of the ge-notype on the trait, whereas thousands of samples were used to originally detect these associations in GWASs. To mitigate this limitation, we confined our analysis to estab-lished GWAS loci and required the combined effect of the genotype on the trait and the mediation to be significant. The results of both gene-trait associations and mediation analysis can be used to guide efforts in functional tests of genes for mechanistic effects on cardiometabolic traits.
The 318 candidate genes identified here correspond to GWAS loci across a broad range of cardiometabolic traits. These genes may act to influence obesity, diabetes, and car-diovascular traits and should be prioritized for future func-tional analysis. As larger subcutaneous adipose data sets become available in diverse ancestries, multiple eQTL sig-nals will become easier to identify and colocalize with GWAS signals from across populations.
Data Availability
Summary eQTL data are provided at http://mohlke.web.
unc.edu/data/. Gene expression data are provided in
GEO: GSE135134.
Supplemental Data
Supplemental Data can be found online at https://doi.org/10. 1016/j.ajhg.2019.09.001.
Acknowledgements
This study was supported by NIH grants R01DK093757, R01DK072193, U01DK105561, U01DK062370, 1-ZIA-HG000024, P01HL28481, R01HG009937, R01MH118349, P01CA142538, and P30ES010126; the Academy of Finland; the Finnish Heart Founda-tion; the Finnish Diabetes FoundaFounda-tion; Finnish Funding Agency for Technology and Innovation (TEKES) contract 1510/31/06; and the Commission of the European Community HEALTH-F2-2007-201681. Individuals were supported by NIH: T32GM067553 (C.K.R., K.W.C.), F31HL127921 (A.K.), T32GM007092 (S.M.B.), and R25GM055336 (K.W.C.). C.N.S. was supported by the American Heart Association Postdoctoral Fellowships 15POST24470131 and 17POST33650016.
We thank the UCLA Neuroscience Genomics Core (UNGC) for generation of RNA-sequencing data, Peter Chines for his contribu-tions to METSIM genotyping, and Karl Eklund for his assistance with read-level quality control. We also thank the Roadmap Epige-nomics Project for their adipose nuclei promoter and enhancer marks.
The Genotype-Tissue Expression (GTEx) Project was supported by the Common Fund of the Office of the Director of the National Institutes of Health, and by NCI, NHGRI, NHLBI, NIDA, NIMH, and NINDS. The data used for the analyses described in this manu-script were obtained from the GTEx Portal on 02/23/17 and dbGaP accession number phs000424.v7.p2 on 08/22/17.
Declaration of Interests
M.E.C. is a current employee of Invitae, Corp. and Y.W. is a current employee of Pfizer, Inc.
Received: May 29, 2019 Accepted: September 3, 2019 Published: September 26, 2019
Web Resources
GATK best practice guidelines, https://software.broadinstitute. org/gatk/best-practices/workflow
GEO,https://www.ncbi.nlm.nih.gov/geo/
qvalue R package,https://www.bioconductor.org/packages/release/ bioc/html/qvalue.html
swiss,https://github.com/statgen/swiss
TagDust,http://tagdust.sourceforge.net
References
1. Wang, Y., Rimm, E.B., Stampfer, M.J., Willett, W.C., and Hu, F.B. (2005). Comparison of abdominal adiposity and overall obesity in predicting risk of type 2 diabetes among men. Am. J. Clin. Nutr.81, 555–563.
2. Canoy, D. (2008). Distribution of body fat and risk of coronary heart disease in men and women. Curr. Opin. Cardiol. 23, 591–598.
4. Coelho, M., Oliveira, T., and Fernandes, R. (2013). Biochem-istry of adipose tissue: an endocrine organ. Arch. Med. Sci.9, 191–200.
5. Gustafson, B., Hedjazifar, S., Gogg, S., Hammarstedt, A., and Smith, U. (2015). Insulin resistance and impaired adipogene-sis. Trends Endocrinol. Metab.26, 193–200.
6. Porter, S.A., Massaro, J.M., Hoffmann, U., Vasan, R.S., O’Don-nel, C.J., and Fox, C.S. (2009). Abdominal subcutaneous adipose tissue: a protective fat depot? Diabetes Care 32, 1068–1075.
7. Smith, U., and Kahn, B.B. (2016). Adipose tissue regulates in-sulin sensitivity: role of adipogenesis, de novo lipogenesis and novel lipids. J. Intern. Med.280, 465–475.
8. Ongen, H., Brown, A.A., Delaneau, O., Panousis, N.I., Nica, A.C., Dermitzakis, E.T.; and GTEx Consortium (2017). Esti-mating the causal tissues for complex traits and diseases. Nat. Genet.49, 1676–1683.
9. Battle, A., Brown, C.D., Engelhardt, B.E., Montgomery, S.B., et al.; GTEx Consortium; Laboratory, Data Analysis &Coordi-nating Center (LDACC)—Analysis Working Group; Statistical Methods groups—Analysis Working Group; Enhancing GTEx (eGTEx) groups; NIH Common Fund; NIH/NCI; NIH/NHGRI; NIH/NIMH; NIH/NIDA; Biospecimen Collection Source Site— NDRI; Biospecimen Collection Source Site—RPCI; Bio-specimen Core Resource—VARI; Brain Bank Repository—Uni-versity of Miami Brain Endowment Bank; Leidos Biomedical— Project Management; ELSI Study; Genome Browser Data Inte-gration &Visualization—EBI; Genome Browser Data Integra-tion &VisualizaIntegra-tion—UCSC Genomics Institute, University of California Santa Cruz; Lead analysts; Laboratory, Data Analysis &Coordinating Center (LDACC); NIH program man-agement; Biospecimen collection; Pathology; and eQTL manuscript working group (2017). Genetic effects on gene expression across human tissues. Nature550, 204–213.
10. Dobbyn, A., Huckins, L.M., Boocock, J., Sloofman, L.G., Glicksberg, B.S., Giambartolomei, C., Hoffman, G.E., Perumal, T.M., Girdhar, K., Jiang, Y., et al.; CommonMind Consortium (2018). Landscape of Conditional eQTL in Dorsolateral Pre-frontal Cortex and Co-localization with Schizophrenia GWAS. Am. J. Hum. Genet.102, 1169–1184.
11. Jansen, R., Hottenga, J.-J., Nivard, M.G., Abdellaoui, A., Laport, B., de Geus, E.J., Wright, F.A., Penninx, B.W.J.H., and Boomsma, D.I. (2017). Conditional eQTL analysis reveals allelic heteroge-neity of gene expression. Hum. Mol. Genet.26, 1444–1451.
12. Civelek, M., Wu, Y., Pan, C., Raulerson, C.K., Ko, A., He, A., Til-ford, C., Saleem, N.K., Stanca´kova´, A., Scott, L.J., et al. (2017). Genetic Regulation of Adipose Gene Expression and Cardio-Metabolic Traits. Am. J. Hum. Genet.100, 428–443.
13. Buil, A., Brown, A.A., Lappalainen, T., Vin˜uela, A., Davies, M.N., Zheng, H.-F., Richards, J.B., Glass, D., Small, K.S., Dur-bin, R., et al. (2015). Gene-gene and gene-environment inter-actions detected by transcriptome sequence analysis in twins. Nat. Genet.47, 88–91.
14. Emilsson, V., Thorleifsson, G., Zhang, B., Leonardson, A.S., Zink, F., Zhu, J., Carlson, S., Helgason, A., Walters, G.B., Gun-narsdottir, S., et al. (2008). Genetics of gene expression and its effect on disease. Nature452, 423–428.
15. Franze´n, O., Ermel, R., Cohain, A., Akers, N.K., Di Narzo, A., Talukdar, H.A., Foroughi-Asl, H., Giambartolomei, C., Fullard, J.F., Sukhavasi, K., et al. (2016). Cardiometabolic risk loci share downstream cis- and trans-gene regulation across tissues and diseases. Science353, 827–830.
16. Locke, A.E., Kahali, B., Berndt, S.I., Justice, A.E., Pers, T.H., Day, F.R., Powell, C., Vedantam, S., Buchkovich, M.L., Yang, J., et al.; LifeLines Cohort Study; ADIPOGen Consortium; AGEN-BMI Working Group; CARDIOGRAMplusC4D Con-sortium; CKDGen ConCon-sortium; GLGC; ICBP; MAGIC Investi-gators; MuTHER Consortium; MIGen Consortium; PAGE Consortium; ReproGen Consortium; GENIE Consortium; and International Endogene Consortium (2015). Genetic studies of body mass index yield new insights for obesity biology. Nature518, 197–206.
17. Shungin, D., Winkler, T.W., Croteau-Chonka, D.C., Ferreira, T., Locke, A.E., Ma¨gi, R., Strawbridge, R.J., Pers, T.H., Fischer, K., Justice, A.E., et al.; ADIPOGen Consortium; CARDIOGRAMplusC4D Consortium; CKDGen Consortium; GEFOS Consortium; GENIE Consortium; GLGC; ICBP; Inter-national Endogene Consortium; LifeLines Cohort Study; MAGIC Investigators; MuTHER Consortium; PAGE Con-sortium; and ReproGen Consortium (2015). New genetic loci link adipose and insulin biology to body fat distribution. Nature518, 187–196.
18. Mahajan, A., Taliun, D., Thurner, M., Robertson, N.R., Torres, J.M., Rayner, N.W., Payne, A.J., Steinthorsdottir, V., Scott, R.A., Grarup, N., et al. (2018). Fine-mapping type 2 diabetes loci to single-variant resolution using high-density imputation and islet-specific epigenome maps. Nat. Genet.50, 1505–1513.
19. Hoffmann, T.J., Theusch, E., Haldar, T., Ranatunga, D.K., Jor-genson, E., Medina, M.W., Kvale, M.N., Kwok, P.-Y., Schaefer, C., Krauss, R.M., et al. (2018). A large electronic-health-record-based genome-wide study of serum lipids. Nat. Genet. 50, 401–413.
20. Dastani, Z., Hivert, M.-F., Timpson, N., Perry, J.R.B., Yuan, X., Scott, R.A., Henneman, P., Heid, I.M., Kizer, J.R., Lyytika¨inen, L.-P., et al.; DIAGRAMþ Consortium; MAGIC Consortium; GLGC Investigators; MuTHER Consortium; DIAGRAM Consortium; GIANT Consortium; Global B Pgen Consortium; Procardis Consortium; MAGIC investigators; and GLGC Consortium (2012). Novel loci for adiponectin levels and their influence on type 2 diabetes and metabolic traits: a multi-ethnic meta-analysis of 45,891 individuals. PLoS Genet. 8, e1002607.
21. Laakso, M., Kuusisto, J., Stanca´kova´, A., Kuulasmaa, T., Paju-kanta, P., Lusis, A.J., Collins, F.S., Mohlke, K.L., and Boehnke, M. (2017). The Metabolic Syndrome in Men study: a resource for studies of metabolic and cardiovascular diseases. J. Lipid Res.58, 481–493.
22. McCarthy, S., Das, S., Kretzschmar, W., Delaneau, O., Wood, A.R., Teumer, A., Kang, H.M., Fuchsberger, C., Danecek, P., Sharp, K., et al.; Haplotype Reference Consortium (2016). A reference panel of 64,976 haplotypes for genotype imputa-tion. Nat. Genet.48, 1279–1283.
23. Dobin, A., Davis, C.A., Schlesinger, F., Drenkow, J., Zaleski, C., Jha, S., Batut, P., Chaisson, M., and Gingeras, T.R. (2013). STAR: ultrafast universal RNA-seq aligner. Bioinformatics29, 15–21.
24. Lander, E.S., Linton, L.M., Birren, B., Nusbaum, C., Zody, M.C., Baldwin, J., Devon, K., Dewar, K., Doyle, M., FitzHugh, W., et al.; International Human Genome Sequencing Con-sortium (2001). Initial sequencing and analysis of the human genome. Nature409, 860–921.
datasets increases power to detect small genetic effects. Bioin-formatics27, 2104–2111.
26. Jun, G., Flickinger, M., Hetrick, K.N., Romm, J.M., Doheny, K.F., Abecasis, G.R., Boehnke, M., and Kang, H.M. (2012). De-tecting and estimating contamination of human DNA sam-ples in sequencing and array-based genotype data. Am. J. Hum. Genet.91, 839–848.
27. Patro, R., Duggal, G., Love, M.I., Irizarry, R.A., and Kingsford, C. (2017). Salmon provides fast and bias-aware quantification of transcript expression. Nat. Methods14, 417–419.
28. Soneson, C., Love, M.I., and Robinson, M.D. (2015). Differen-tial analyses for RNA-seq: transcript-level estimates improve gene-level inferences. F1000Res.4, 1521.
29. Love, M.I., Huber, W., and Anders, S. (2014). Moderated esti-mation of fold change and dispersion for RNA-seq data with DESeq2. Genome Biol.15, 550.
30. Gamazon, E.R., Segre`, A.V., van de Bunt, M., Wen, X., Xi, H.S., Hormozdiari, F., Ongen, H., Konkashbaev, A., Derks, E.M., Aguet, F., et al.; GTEx Consortium (2018). Using an atlas of gene regulation across 44 human tissues to inform complex disease- and trait-associated variation. Nat. Genet. 50, 956–967.
31. Stegle, O., Parts, L., Piipari, M., Winn, J., and Durbin, R. (2012). Using probabilistic estimation of expression residuals (PEER) to obtain increased power and interpretability of gene expression analyses. Nat. Protoc.7, 500–507.
32. Ongen, H., Buil, A., Brown, A.A., Dermitzakis, E.T., and Dela-neau, O. (2016). Fast and efficient QTL mapper for thousands of molecular phenotypes. Bioinformatics32, 1479–1485.
33. Karro, J.E., Yan, Y., Zheng, D., Zhang, Z., Carriero, N., Cayting, P., Harrrison, P., and Gerstein, M. (2007). Pseudogene.org: a comprehensive database and comparison platform for pseu-dogene annotation. Nucleic Acids Res.35, D55–D60.
34. Battle, A., Mostafavi, S., Zhu, X., Potash, J.B., Weissman, M.M., McCormick, C., Haudenschild, C.D., Beckman, K.B., Shi, J., Mei, R., et al. (2014). Characterizing the genetic basis of tran-scriptome diversity through RNA-sequencing of 922 individ-uals. Genome Res.24, 14–24.
35. Wang, L., Wang, S., and Li, W. (2012). RSeQC: quality control of RNA-seq experiments. Bioinformatics28, 2184–2185.
36. Wang, L., Nie, J., Sicotte, H., Li, Y., Eckel-Passow, J.E., Dasari, S., Vedell, P.T., Barman, P., Wang, L., Weinshiboum, R., et al. (2016). Measure transcript integrity using RNA-seq data. BMC Bioinformatics17, 58.
37. Delaneau, O., Ongen, H., Brown, A.A., Fort, A., Panousis, N.I., and Dermitzakis, E.T. (2017). A complete tool set for molecular QTL discovery and analysis. Nat. Commun.8, 15452.
38. Kundaje, A., Meuleman, W., Ernst, J., Bilenky, M., Yen, A., Her-avi-Moussavi, A., Kheradpour, P., Zhang, Z., Wang, J., Ziller, M.J., et al.; Roadmap Epigenomics Consortium (2015). Inte-grative analysis of 111 reference human epigenomes. Nature 518, 317–330.
39. Cannon, M.E., Currin, K.W., Young, K.L., Perrin, H.J., Vadla-mudi, S., Safi, A., Song, L., Wu, Y., Wabitsch, M., Laakso, M., et al. (2019). Open Chromatin Profiling in Adipose Tissue Marks Genomic Regions with Functional Roles in Cardiome-tabolic Traits. G3 (Bethesda),9, pp. 2521–2533.
40. Buenrostro, J.D., Giresi, P.G., Zaba, L.C., Chang, H.Y., and Greenleaf, W.J. (2013). Transposition of native chromatin for fast and sensitive epigenomic profiling of open chromatin, DNA-binding proteins and nucleosome position. Nat. Methods10, 1213–1218.
41. Schmidt, E.M., Zhang, J., Zhou, W., Chen, J., Mohlke, K.L., Chen, Y.E., and Willer, C.J. (2015). GREGOR: evaluating global enrichment of trait-associated variants in epigenomic features using a systematic, data-driven approach. Bioinfor-matics31, 2601–2606.
42. Buniello, A., MacArthur, J.A.L., Cerezo, M., Harris, L.W., Hay-hurst, J., Malangone, C., McMahon, A., Morales, J., Mountjoy, E., Sollis, E., et al. (2019). The NHGRI-EBI GWAS Catalog of published genome-wide association studies, targeted arrays and summary statistics 2019. Nucleic Acids Res. 47 (D1), D1005–D1012.
43. Yengo, L., Sidorenko, J., Kemper, K.E., Zheng, Z., Wood, A.R., Weedon, M.N., Frayling, T.M., Hirschhorn, J., Yang, J., Visscher, P.M.; and GIANT Consortium (2018). Meta-analysis of genome-wide association studies for height and body mass index in 700000 individuals of European ancestry. Hum. Mol. Genet.27, 3641–3649.
44. Pulit, S.L., Stoneman, C., Morris, A.P., Wood, A.R., Glaston-bury, C.A., Tyrrell, J., Yengo, L., Ferreira, T., Marouli, E., Ji, Y., et al. (2019). Meta-analysis of genome-wide association studies for body fat distribution in 694,649 individuals of Eu-ropean ancestry. Hum. Mol. Genet.28, 166–174.
45. Xue, A., Wu, Y., Zhu, Z., Zhang, F., Kemper, K.E., Zheng, Z., Yengo, L., Lloyd-Jones, L.R., Sidorenko, J., Wu, Y., et al.; eQTLGen Consortium (2018). Genome-wide association ana-lyses identify 143 risk variants and putative regulatory mech-anisms for type 2 diabetes. Nat. Commun.9, 2941.
46. Giambartolomei, C., Vukcevic, D., Schadt, E.E., Franke, L., Hingorani, A.D., Wallace, C., and Plagnol, V. (2014). Bayesian test for colocalisation between pairs of genetic association studies using summary statistics. PLoS Genet.10, e1004383.
47. Imai, K., Keele, L., and Yamamoto, T. (2010). Identification, Inference and Sensitivity Analysis for Causal Mediation Ef-fects. Stat. Sci.25, 51–71.
48. Huang, Y.-T., Vanderweele, T.J., and Lin, X. (2014). Joint anal-ysis of SNP and gene expression data in genetic association studies of complex diseases. Ann. Appl. Stat.8, 352–376.
49. Esteve Ra`fols, M. (2014). Adipose tissue: cell heterogeneity and functional diversity. Endocrinol. Nutr.61, 100–112.
50. Tchoukalova, Y.D., Sarr, M.G., and Jensen, M.D. (2004). Measuring committed preadipocytes in human adipose tissue from severely obese patients by using adipocyte fatty acid binding protein. Am. J. Physiol. Regul. Integr. Comp. Physiol. 287, R1132–R1140.
51. Titus, A.J., Gallimore, R.M., Salas, L.A., and Christensen, B.C. (2017). Cell-type deconvolution from DNA methylation: a review of recent applications. Hum. Mol. Genet. 26 (R2), R216–R224.
52. Jaffe, A.E., and Irizarry, R.A. (2014). Accounting for cellular heterogeneity is critical in epigenome-wide association studies. Genome Biol.15, R31.
53. Lappalainen, T., and Greally, J.M. (2017). Associating cellular epigenetic models with human phenotypes. Nat. Rev. Genet. 18, 441–451.
54. Small, K.S., Todorcevic, M., Civelek, M., El-Sayed Moustafa, J.S., Wang, X., Simon, M.M., Fernandez-Tajes, J., Mahajan, A., Horikoshi, M., Hugill, A., et al. (2018). Regulatory variants at KLF14 influence type 2 diabetes risk via a female-specific ef-fect on adipocyte size and body composition. Nat. Genet.50, 572–580.
Chasman, D.I., Willer, C.J., et al. (2010). Biological, clinical and population relevance of 95 loci for blood lipids. Nature 466, 707–713.
56. Voight, B.F., Scott, L.J., Steinthorsdottir, V., Morris, A.P., Dina, C., Welch, R.P., Zeggini, E., Huth, C., Aulchenko, Y.S., Thorleifsson, G., et al.; MAGIC investigators; and GIANT Consortium (2010). Twelve type 2 diabetes susceptibility loci identified through large-scale association analysis. Nat. Genet.42, 579–589.
57. Kong, A., Steinthorsdottir, V., Masson, G., Thorleifsson, G., Sulem, P., Besenbacher, S., Jonasdottir, A., Sigurdsson, A., Kris-tinsson, K.Th., Jonasdottir, A., et al.; DIAGRAM Consortium (2009). Parental origin of sequence variants associated with complex diseases. Nature462, 868–874.
58. Lee, T.I., and Young, R.A. (2013). Transcriptional regulation and its misregulation in disease. Cell152, 1237–1251.
59. Cai, K., and Sewer, M.B. (2013). Diacylglycerol kinaseq cou-ples farnesoid X receptor-dependent bile acid signalling to Akt activation and glucose homoeostasis in hepatocytes. Bio-chem. J.454, 267–274.
60. Saxton, R.A., and Sabatini, D.M. (2017). mTOR Signaling in Growth, Metabolism, and Disease. Cell168, 960–976.
61. Akiyama, M., Okada, Y., Kanai, M., Takahashi, A., Momozawa, Y., Ikeda, M., Iwata, N., Ikegawa, S., Hirata, M., Matsuda, K., et al. (2017). Genome-wide association study identifies 112 new loci for body mass index in the Japanese population. Nat. Genet.49, 1458–1467.
62. Kissil, J.L., Deiss, L.P., Bayewitch, M., Raveh, T., Khaspekov, G., and Kimchi, A. (1995). Isolation of DAP3, a novel mediator of interferon-g-induced cell death. J. Biol. Chem.270, 27932– 27936.
63. Engin, A.B., and Engin, A. (2017). The Interactions Between Kynurenine, Folate, Methionine and Pteridine Pathways in Obesity. Adv. Exp. Med. Biol.960, 511–527.
64. Harris, R.M., Waring, R.H., Kirk, C.J., and Hughes, P.J. (2000). Sulfation of ‘‘estrogenic’’ alkylphenols and 17b-estradiol by human platelet phenol sulfotransferases. J. Biol. Chem.275, 159–166.
65. Emaus, A., Espetvedt, S., Veierød, M.B., Ballard-Barbash, R., Furberg, A.-S., Ellison, P.T., Jasienska, G., Hjarta˚ker, A., and Thune, I. (2008). 17-beta-estradiol in relation to age at menarche and adult obesity in premenopausal women. Hum. Reprod.23, 919–927.
66. Gutierrez-Aguilar, R., Kim, D.-H., Woods, S.C., and Seeley, R.J. (2012). Expression of new loci associated with obesity in diet-induced obese rats: from genetics to physiology. Obesity (Sil-ver Spring)20, 306–312.
67. Matsuda, M., and DeFronzo, R.A. (1999). Insulin sensitivity indices obtained from oral glucose tolerance testing: compar-ison with the euglycemic insulin clamp. Diabetes Care22, 1462–1470.
68. Levy-Strumpf, N., Deiss, L.P., Berissi, H., and Kimchi, A. (1997). DAP-5, a novel homolog of eukaryotic translation initiation factor 4G isolated as a putative modulator of gamma interferon-induced programmed cell death. Mol. Cell. Biol. 17, 1615–1625.
69. Hug, C., Wang, J., Ahmad, N.S., Bogan, J.S., Tsao, T.-S., and Lodish, H.F. (2004). T-cadherin is a receptor for hexameric and high-molecular-weight forms of Acrp30/adiponectin. Proc. Natl. Acad. Sci. USA101, 10308–10313.
70. Herman, M.A., Peroni, O.D., Villoria, J., Scho¨n, M.R., Abum-rad, N.A., Blu¨her, M., Klein, S., and Kahn, B.B. (2012). A novel ChREBP isoform in adipose tissue regulates systemic glucose metabolism. Nature484, 333–338.
71. Kazanskaya, O., Ohkawara, B., Heroult, M., Wu, W., Maltry, N., Augustin, H.G., and Niehrs, C. (2008). The Wnt signaling regulator R-spondin 3 promotes angioblast and vascular devel-opment. Development135, 3655–3664.
72. Ming, G.F., Xiao, D., Gong, W.J., Liu, H.X., Liu, J., Zhou, H.H., and Liu, Z.Q. (2014). JAZF1 can regulate the expression of lipid metabolic genes and inhibit lipid accumulation in adipocytes. Biochem. Biophys. Res. Commun.445, 673–680.
73. Tak, Y.G., and Farnham, P.J. (2015). Making sense of GWAS: using epigenomics and genome engineering to understand the functional relevance of SNPs in non-coding regions of the human genome. Epigenetics Chro-matin 8, 57.
74. Gallagher, M.D., and Chen-Plotkin, A.S. (2018). The Post-GWAS Era: From Association to Function. Am. J. Hum. Genet. 102, 717–730.
75. Pai, A.A., Pritchard, J.K., and Gilad, Y. (2015). The genetic and mechanistic basis for variation in gene regulation. PLoS Genet.11, e1004857.
76. Hormozdiari, F., van de Bunt, M., Segre`, A.V., Li, X., Joo, J.W.J., Bilow, M., Sul, J.H., Sankararaman, S., Pasaniuc, B., and Eskin, E. (2016). Colocalization of GWAS and eQTL Signals Detects Target Genes. Am. J. Hum. Genet.99, 1245–1260.
77. He, X., Fuller, C.K., Song, Y., Meng, Q., Zhang, B., Yang, X., and Li, H. (2013). Sherlock: detecting gene-disease associa-tions by matching patterns of expression QTL and GWAS. Am. J. Hum. Genet.92, 667–680.
78. Nica, A.C., Montgomery, S.B., Dimas, A.S., Stranger, B.E., Beaz-ley, C., Barroso, I., and Dermitzakis, E.T. (2010). Candidate causal regulatory effects by integration of expression QTLs with complex trait genetic associations. PLoS Genet. 6, e1000895.