Visio In .
Robo-Advisors
A Future Way To Invest?
Viraj Vishwarupe
Tommy Vu
December 14th, 2018
About The Authors:
Viraj Vishwarupe is a fourth year Business Administration student concentrating in Financial Management and holding a minor in Statistics at California Polytechnic State University San Luis Obispo. In the past, he has worked for firms of varying sizes, from startups to large caps. From his academic and work experiences, Viraj has developed an expertise in market research, business process improvement, cash management, and financial accounting. In his free time, he enjoys playing basketball and the piano as well as sketching.
Tommy Vu is a fourth year Business Administration student concentrating in Financial Management at California Polytechnic State University San Luis Obispo. He has extensive experience in leading and influencing team members as Vice President of his fraternity, Tau Kappa Epsilon. He has also spent his last two summers as an Inventory Operations Associate at a small tech company, iFixit. Through academics and other projects, Tommy has developed into a leader and has strong knowledge in the financial field.
Table of Contents:
Research Project Purpose……….. 4-5
Importance to Authors………. 4
Importance to Readers……… 4-5
Learning Outcomes………... 5
Robo-Advisor Background………. 5-8
History……….. 5-6
General Attributes……….. 6-7
Public Attitudes Toward Robo-Advisors……….. 7-8
Industry Analysis……… 8-18
Robo-Advisor Industry Overview……… ……….. 8-9
User Growth………... 9-11
Market Segmentation……….. 11-12
Assets Under Management……… 12-14
Market Shares and Key Participants………. 14-16
Future Services………. 17-18
A Closer Look at Robo-Advisors……….. 19-41
Underlying Mechanics……….. 19-33
Robo-Advisor Offerings and Differences………. 33-38
Regulatory Framework………. 38-41
Robo-Advisors vs. Traditional Financial Advisors……….. 41-78
Pros and Cons of Robo-Advisors………..………….. 41-52
Pros and Cons of Financial Advisors………..……… 52-59
Case Studies: An In-Depth Look Into a Robo-Advisor and Traditional Financial Advisor
Firm……….. 59-65
Cost Benefit Analyses for Each Approach……….……… 65-78
Testing the Effectiveness of Robo-Advisors………. 78-99
Study Purpose ……….. 78
Procedures ……….. 78-81
Results and Discussion ………. 81-98
Conclusion ………. 98-99
Conclusion and Recommendations……….. 99-102
Appendix………. 103-107
Abstract
Research Question: Are robo-advisors the future of investing?
As the capabilities of technology continue to advance, alternatives to conventional practices are created in an attempt to boost convenience and efficiency. This paper will focus on one such alternative, robo-advisors, an automated investment advisor platform. The technology is
evaluated to answer the research question above and to assess whether it holds promise in the world of finance as well as the potential to ultimately outpace traditional forms of investment advice. To accomplish this goal, in-depth research is provided covering a broad range of topics concerning robo-advisors including the platform’s history, analysis of the industries it falls under, underlying mechanics, firms, its regulatory framework, and comparisons to traditional financial advisors. Next, knowledge from this preliminary research was used to report additional insights gained from interviews conducted with one representative of a robo-advisor platform and another representing a traditional financial advising firm. The paper then provides a cost-benefit analysis quantifying the tangible historical gains and losses clients have experienced from using both robo-advisors and financial advisors. Finally, personal investments were made with one robo-advisor platform to test the effectiveness of the technology over the course of 1.5 months in order to share user experiences, feedback, suggestions, recommendations and to reconfirm earlier insights reported in the paper.
To assist in writing the report, websites, peer-reviewed journals and scholarly articles, data sources such as Statista and Morningstar, tools like Portfolio Visualizer and Excel, phone calls, emails, web portals, and an app were utilized.
In the end, it was found that robo-advisors have a strong, positive outlook in terms of future growth. However, hybrid robo-advisors and models of investing were determined to be the norm looking ahead since they effectively integrate the advantages of both robo-advisors and
traditional financial advisors as well as address the downsides with each approach. Furthermore, it was concluded that there was no clear answer whether robo-advisors in their current state are better than conventional practices since it all depended on a client’s financial situation and needs. Still, potential college entrants and those looking to generate retirement savings were deemed best fits for the technology. Regardless, it was discovered that robo-advisors would continue to improve in the future by expanding their investment offerings, strategies, plans, making significant strides in artificial intelligence, and continuing to remain cost-efficient.
Research Project Purpose
Importance to Authors
As two finance majors in the Orfalea College of Business at California Polytechnic State
University - San Luis Obispo, we are both very interested in the world of investment and portfolio management. These are two areas we are actively looking to pursue our careers in as well. Initially, we wanted to do a project that would simulate what it would be like to be portfolio managers, but when we did further research, we discovered a program that automated
investments for individuals at a low cost. This seemed like an interesting topic to explore further and since we were new to the finance world, we were interested in modern investing strategies. To our shock, robo-advisors were also a relatively recent concept when presented to our friends and professors, especially since it was originally created in 2008. Since our original project idea involved investment, this topic was in line with what we wanted to do. Furthermore, we believed it was important to learn about automation because it could become even more prominent in finance looking years ahead. This research project will allow us to fully understand the current software and predict its prospective growth. To give us the full experience, we will also be interviewing financial advisor and robo-advisor firms that will allow us to validate our research and evaluate whether robo-advisors have the potential to replace conventional investment advice in the future. In addition, an approximately one and a half month long investment of our personal money into a robo-advisor will allow us to personally assess the effectiveness of this technology.
Importance to Readers
As we move further into the technology revolution, the marketplace is slowly shifting into better, more convenient, and cheaper ways to trade. Many individual investors are either highly
knowledgeable with the market through experience and research, while many others find the stock market similar to a casino where if they are lucky, they can walk away with positive returns. Generally, the public is uncomfortable with putting their money in the stock market due to their lack of experience. Additionally, in the past, individuals would have to go to investment advisors for advice; luckily, a solution has been created. Robo-advisors have emerged in the marketplace as an alternative for beginners to understand the stock market without fear of substantial loss. With no need for human intervention, one could create an investment portfolio within an hour using the algorithms (a set of rules) and asset allocation models that are custom fit for every individual based on their financial goals and risk profile.
beginners who are fearful of losing money in the stock market because automation allows for a reallocation of funds when there is a large loss. Since most people are unfamiliar with the various assets to pick as a beginner without a large amount of research, this will allow them to get their feet wet in the world of investment by understanding the mechanics behind the technology.
Learning Outcomes
This paper will provide an in-depth look into robo-advisors and an understanding of their potential in the future. Interviews of robo-advisor and financial advisor firms conducted will give an insight on the creation and daily use of the software as well as how traditional ways of investment advice compare to the technology. Since this project focuses on the future of robo-advisors and automation as a whole, these companies will assist in that aspect along with the personal experience gained through the authors’ investment in a specific robo-advisor, Betterment. This allows for real-life testing of a product to validate our research. A cost-benefit analysis will also be created to compare robo-advisors and traditional means of investing. This research will beneficial for individuals to further understand the pros and cons of robo-advisors and traditional financial advisors. As computers become more powerful and the capabilities of automation advance every day, this paper will illustrate how robo-advisors can disrupt and shape the future of wealth management. Are robo-advisors just the start of something bigger? How influential can they become and will it put financial advisors out of business?
Note: Research by Statista in 2017 shows that although there were 361 robo-advisors worldwide, 200 came from the United States alone. Therefore, this paper will lean more towards the
robo-advisors in the United States due to their strong presence in the country. 1
Robo-Advisor Background
History
First created during the financial crisis in 2008, the robo-advisor was initially created to rebalance (realign) investor assets within target-date funds (a fund designed to become more conservative as the end financial goal approaches closer for a client), and introduce investors into the new world of online interfaces. Most robo-advisors have a passive investing strategy that allows for the computer to rebalance a portfolio when the market shifts to skew allocations among equity (stocks), debt (like bonds), and other assets. Robo-advisors were not available to the public until 2008 and before then, the software was only used by human financial advisors to automate their workload while still charging the same annual fees of 1% to 3% of total assets under management (total financial value of client managed money). Now available to the public, robo-advisors can be
1 “Number of Robo-Advisors Globally by Country 2017 | Statistic.” Statista , Apr. 2017
used for a lower fee of 0.3%-0.5%. Now with 2
robo-advisors available, there are three methods of investment as shown in Figure 1. In the past,
investors would either do it themselves, but since they are not professionals, it required a large amount of research on companies and stock tickers. The alternative was hiring a financial advisor which was expensive and required a large amount of money to start investing. These two options are not preferable to the average American who doesn’t have a lot of time to research companies or has a large amount of money to meet the minimum investment requirement. Now with the introduction of robo-advisors, it is beneficial for beginners to use this system, both to save time and allows for them to invest as much as they want. Robo-advisor companies such as
Betterment and kaChing (later Wealthfront) began to start up and manage target-date funds, requiring investors to move their assets to a new custodian, an individual who is responsible for looking after their assets. Soon after, new services such as tax-loss harvesting were added, which allowed investors to reduce their overall tax bill by harvesting losses, selling their stock losses in the trough therefore offsetting the gains they experience elsewhere in the portfolio. Around 2010, another company by the name of FutureAdvisor began to offer automated advice on investment and retirement accounts which allowed for a first-time exposure to a large number of investors. This company allowed for investors to manage multiple, pre-existing brokerage and retirement accounts, with the added benefit that they were not required to move their assets and it allowed automation to do its job. Once a service for top investors, robo-advisors allow for automation of asset allocation and portfolio management and stand to represent the next generation of financial advice and investment management firms. With every year, wealth management 3
software moves closer and closer towards having the ability to automate all financial advisory services. The future will soon have robo-advisors being able to automate services such as tax planning, cash-flow management, college savings, and possibly an individual's entire financial future.
General Attributes
The term “robo-advisor” specifically refers to the number of Internet-based investment advisory services aimed to automate what financial advisors have been doing for individuals. Before a portfolio is created, the customer answers a questionnaire for the machine to learn about the user’s risk parameters and investment preferences in order to create an asset allocation program with specific investment recommendations.
The main strategies that robo-advisors run are investments in mutual funds and exchange traded funds (ETFs). Investments in ETFs are a main method of trading for Betterment, the robo-advisor currently used for this project. These funds allow for full diversification of portfolios through a single ticker by tracking an index, bonds, or commodities. Investing in a normal company like Apple or Nike allows the investor to share a portion of the company, but by investing in ETFs, investors can purchase a share in an entire fund. Robo-advisors utilize these funds in order to fully diversify portfolios and continually rebalance investments to ensure that it maintains the risk parameters and investment preferences. The minimum balance required to create a 4
robo-advisor account is small compared to the minimum required by financial advisors. They usually range from $500 all the way down to $0. Robo-Advisors are rapidly growing since their first creation during the financial crisis. A study created by Deloitte found that there were close to 100 robo-advisors in 15 countries as of 2016. As of April 2017, there were 200 robo-advisors in the United States alone. The estimates for the robo-advisory market are a big reason for the surge in 5
this product. The market is predicted to grow to almost $900 billion in assets to be managed with the support of robo-advisory services in 2020. By 2022, it is expected to explode to rise over $1.45 trillion in assets under management.
Public Attitudes Towards Robo-Advisors
In a 2015 survey, 82% of registered investment advisors (RIAs) said they weren’t concerned about robo-advisors. In the following 2016 survey, the results were very close to the same, RIAs were not concerned about robo-advisors. Only 1% of the RIAs responded that they were “extremely concerned” in both years of the survey. In the report’s view, wealth managers dismiss the robo-advisors for being something such as a “small fry” (often used to describe any smaller tag along trying to act older or grown up because they want to fit in and gain undeserved respect). Figure 2 shows Millennial and GenX opinions on financial advisors. About half of each group believes that a financial advisor is “nice to have,” which could mean that they may or may not have a financial advisor themselves. In this age of modern technology, almost everything can be found online. These are the people that are the most likely to be influenced to get a financial advisor if it was readily available and inexpensive. Based on this survey, robo-advisors could potentially have a big potential to grow with a large, young target market. The survey further found that two in five Millennials have not worked with a financial advisor because they believe
that they don’t have enough money saved to begin investing. A troubling thought for investors 6
should be the fact that a third of Millennials think investment professionals are too expensive. A popular marketing method for robo-advisors is the fact that the product is much more
inexpensive than traditional financial advisors. Once the public is more informed, wealth managers and RIAs should be extremely worried.
Industry Analysis
Robo-Advisor Industry Overview
The robo-advisor industry falls under the broad FinTech (or Financial Technology) industry (see Figure 3). This industry, generally speaking, involves the digitization and structural change of financial services. Digitization in this context means easier access for Internet/mobile app users, processing speed increases of automated processes, cost reductions, more convenience, more transparency, and a focus on quality customer service. Furthermore, the FinTech industry
branches out into five sub-segment industries: Alternative Financing, Alternative Lending, Digital Payments, Personal Finance, and Special InsurTech: Online Distribution. 7
Alternative Financing
6 Ponnaiya, Sanjay, and Kerri Ryan. “Robo-Advisors: the Rise of Automated Financial Advice.” Ipsos , 1 May 2017
Alternative Financing involves specific digital financial services for business customers. These services include equity-based crowdinvesting models (start-ups exchanging company shares for investment) and crowdfunding solutions (for non-monetary compensation like product launches and visual art financing). This industry primarily focuses on small and medium sized enterprises as well as freelancers (self-employed individuals). Bank financing is not used here. 8
Alternative Lending
The Alternative Lending industry builds upon the Alternative Financing industry by catering digital financial services for business customers but also to private borrowers. This includes loans without bank financing for small and medium sized enterprises (Crowdlending) and for personal loans (Marketplace Lending). These loans are carried either through private or institutional investors using online platforms. This industry primarily focuses on small and medium sized enterprises, freelancers, and private individuals. 9
Digital Payments
The Digital Payments industry includes Internet-made payments for goods and services and mobile-made payments through smartphone apps. Consumer transactions dictate this industry. 10
Special InsurTech (Insurance Technology): Online Distribution
This industry involves the distribution of digital insurance to private customers. Digital insurance products include life, health, property, etc. policies that are sold directly to the customer using online channels like an insurance company website or platform. 11
Personal Finance
As it turns out, the Personal Finance industry (provides financial services and gives
financial/investment opportunity advice to individuals and/or households) is further broken down into online peer-to-peer (P2P) money transfers and
the robo-advisor segments (see Figure 4). Online 12
P2P money transfers are essentially internet-made money transfers between private individuals. This includes cross-border payments (across national boundaries) and remittances (payments sent by an expatriate to their country of origin). Thus, 13
robo-advisors can be thought of as falling under the broad FinTech industry and more
8 “Alternative Financing - Worldwide | Statista Market Forecast.” Statista , 2018 9 “Alternative Lending - Worldwide | Statista Market Forecast.” Statista , 2018 10 “Digital Payments - Worldwide | Statista Market Forecast.” Statista , 2018
11 “Special InsurTech: Online Distribution - Worldwide | Statista Market Forecast.” Statista , 2018 12 “Personal Finance - Worldwide | Statista Market Forecast.” Statista , 2018
specifically the Personal Finance industry.
User Growth
More and more users are starting to use robo-advisors. According to Statista, approximately 25.8 million users in 2018 are active paying customers in the Robo-Advisor segment worldwide (see Figure 5). To put this into perspective, there were only 13.0 million users in 2017. This represents a 99% increase year-over-year (YoY) growth rate. By
2022, there are expected to be nearly 122.0 million users of robo-advisors worldwide. In the United 14
States, 6.6 million users in 2018 are active paying customers (see Figure 6). This means that as of now, a little more than 25% of worldwide users come from the United States. In 2017, there were 4.9 million users giving approximately a 35% increase YoY growth rate from 2017 to 2018. By 2022, there are expected to be 12.7 million users of robo-advisors. Since nearly 25% of worldwide 15
users come from United States, this indicates that a thorough investigation must be carried out to understand what countries contribute to the remaining 75% of users. As it turns out, more than 90% of the remaining users come from China, or 17.5 million users as of 2018 (see Figure 7). Why? Millions and millions of 16
Chinese customers are recently starting to hold investable assets that they are seeking to place elsewhere. Therefore, the only way to service the high volume of clients is to automate the processes. Billion-dollar companies such as AliBaba, more specifically its FinTech subsidiary Ant Financial, are fueling this effort. Moreover, because low interest rates and expensive real estate in China persist, there is a need to seek alternatives in generating returns. At the same time, mitigation of volatility (variation) exposure after-effects from the crash in Shanghai and
14 “Robo-Advisors - Worldwide | Statista Market Forecast.” Statista , Sept. 2018
15 “Robo-Advisors - United States | Statista Market Forecast.” Statista , July 2018
Shenzhen stock markets in 2015 is a priority as well. Thus, China’s robo-advisor growth rates are 17
primarily the reason why the number of users worldwide increased and were inflated to 99% from 2017 to 2018 (China’s own growth rate in these two time periods was 248%). Moreover, this is the reason why the user trends both in worldwide and in China closely resemble one another in form. Still, the robo-advisor segment is gaining significant traction in its registered users in many
countries and is the fastest growing segment in the FinTech-Personal Finance industry (see Figure 8).
Market Segmentation
After analyzing robo-advisor user growth trends, the focus now turns to analyzing the users’ demographics. While robo-advisors were originally thought to be tailored towards millennials
because of their affinity for new technologies, recent studies show that roughly half of robo-advisor investors are over the age of 36. Furthermore, the average age of a robo-advisor investor 18
is somewhere between 40 and 50. What’s causing a surge in 19
Baby Boomers and Gen X clients? For one, the older clients typically have large retirement savings, are willing to take on less risk, and are approaching retirement. Because robo-advisors typically have lower management fees, this
spurs an opportunity to move to this platform in order to save more money for
17 Barreto, Elzio, and Shu Zhang. “Robo Advisors Are Becoming the Hot New Item in China's Finance Sector.” Edited by
Will Waterman, Disruptive.Asia , 27 Apr. 2017
18 O'Hara, Clare. “Robo-Advisers Find Popularity Where Few Thought They Would.” The Globe And Mail , 27 Oct. 2017 19 Schapiro, Ken. “Robo Advisor Data For Two Year Period Now Available for Advisors.” Advisor Perspectives , 6 Mar.
retirement purposes. In fact, according to an Accenture research study, 90% of Baby Boomers 20
and 91% of Gen X clients viewed fee structure as important when it came to selecting a financial advisor. And yet, the trend reverses when analyzing the amount of interest robo-advisors has 21
generated among different age groups. Research shows that there is greater interest in robo-advisors the younger the consumer gets (see Figure 9). Lower fees and minimum 22
investment amounts are factors that certainly pique this interest to consumers who grew up with technology and often have less savings. However, these millennials still remain largely an untapped market. For instance, while only 24.3% of millennials worked with a robo-advisor, the reality is that nearly 62% of those who haven’t used a robo-advisor weren’t aware they existed. 23
Therefore, when it comes to identifying target markets, marketing efforts have largely overlooked the younger generation. As intergenerational wealth transfers continue to occur from Baby Boomers and Gen X’ers to millennials, it becomes especially important to create value and long lasting relationships with them. Moreover, the technology does have this capability by tailoring portfolios to millennials as they continue to change their investment objectives and portfolio
sizes.
Assets Under Management
The financial value of the assets under
robo-advisor management has seen incredible growth. According to Statista, the total value globally in 2018 amounted to nearly $400 billion in assets (see Figure 10). This represents a 63% YoY growth rate compared to 2017 with $244 billion in AUM (assets under
management). By 2022, there are expected to be $1.45 trillion in assets. What countries are driving this growth? While there might be a tendency to conclude that China explains the overall increasing trend due to its phenomenal user growth explained earlier, this
is not the case. It turns out that United States leads the world in the total number of assets under
management (see Figure 11). With $283 billion in assets in 2018 (a little more than 70% of the world total), China holds just $88 billion or 22% of worldwide assets. This means that although
20 Chen, Jeffrey. “Robo-Advising: The Unforeseen Challenge – Ivey FinTech: Perspectives – Medium.” Medium , Ivey
FinTech: Perspectives, 7 Apr. 2018
21 Kirakosian, Margaryta. “Geneva Adviser on Key Industry Transformations and New Banking Platform.” Citywire
Switzerland , 18 Dec. 2017
22 Cutler, Wayne. “Man vs. Machine.” Novantas , 2018
there are a lower number of users in the United States, each of them holds, on average, more assets under
management. For instance, since there are 6.6 million users, each user holds nearly $43,000 on average with robo-advisors. Compare this to China with an outstanding 17.5 million users but amounting to barely $5,000 per user on average. Why is this so? For one, China developed robo-advisors years after the United States created them back in 2008. This explains why
they are still in the very early stages of adoption. On top of that, different cultural attitudes exist. 24
For example, rich investors who would otherwise have boosted China’s AUM per user are distrusting of robo-advisors to manage their investments. In fact, only 11% of mainland China investors with investable assets of more than $477,000 support the technology. In the United States, however, there has been more faith in robo-advisors. Moreover, Chinese investors in general tend to be much more involved in their investments, taking an active approach. At the 25
same time, the scarcity of Asian ETFs has dampened the development of the passive
management approach which is a primary strategy used by robo-advisors. Lower regulation on capital flows and cheaper fees in US also make it more likely that the domestic robo-advisors have greater access to wealth than China. This greater access, of course, isn’t negligible. As 26
explained in the earlier section, many older clients (Baby Boomers and Gen X) with large portfolio sizes are attracted by these lower fees thereby boosting assets under management significantly in US. These Baby Boomers and Gen X investors represent roughly ¾ of the affluent market with investable assets of at least $100,000. Still, China’s second mover advantage, development of 27
more robo-advisor platforms by FinTech firms, and fast growing middle class providing access to more wealth positions the country to grow very fast in metrics such as assets under management.
For instance, it’s been forecasted that by 2022, China’s AUM will outperform US’s AUM (see
28
Figure 12).
24 Phoon, Kokfai, and Francis Koh. “Robo-Advisors and Wealth Management.” The Journal of Alternative Investments ,
vol. 20, no. 3, 2017, pp. 79–94., doi:10.3905/jai.2018.20.3.079.
25 Zhang, Maggie. “China’s Super Rich Are Wary towards AI ‘Robo Advisers’, Preferring Humans Instead.” South China
Morning Post , 4 Apr. 2018
26 O'Connell, Brian. “Robo-Advisors Are a Big Hit in U.s. - but Not so Much in Europe.” TheStreet , 16 Feb. 2017 27 “Boomers and Silents Represent 70% of the Wealth and Affluent Market.” Marketing Charts , 24 Feb. 2017
Market Shares and Key Participants
In this analysis, market shares will be based on the measure, assets under management (AUM)/transaction value. While market share has been traditionally calculated as sales as a percentage of an industry’s total revenues, it makes sense to use assets under
management/transaction value as a percentage of an industry’s total assets under
management/transaction values. Why? Assets under management/transaction value is a measure that is closely related to the function of revenue. Just as revenue can be thought of as the
amount of money that is brought into the business from the sale of goods and services, assets under management depends on the flow of money coming in by selling or providing financial services. Transaction value can be another term
used for assets under management and applies to industries where the value of transactions being executed determines the success of the financial service led primarily by consumer activity. In this case for robo-advisors, these services are managing assets for clients and therefore investor money flows in to provide these services. Furthermore, robo-advisor market shares will be compared to other industries within the FinTech industry primarily because the distinguishing factors here are on digitization and structural changes revolutionizing
this paper, robo-advisor market shares will be analyzed in interaction with its traditional counterpart, financial advisors, to understand the interconnectedness between the two and perform comparative evaluations. As was established earlier, robo-advisors fall under the Personal Finance industry which also includes P2P
Money Transfers. Market shares within this industry indicate that as of now, robo-advisors hold roughly 85% market share (see Figure 13). By 2022, this number increases to more than 90%. While P2P Money Transfers are in fact increasing in transaction value, the truth is that Robo-Advisors comprise a significant portion of the market and will continue to do so mainly because of stronger effects such as growing customer bases in China, the attractiveness of lower fees in US, and the possibility to developing an even stronger pool of millennial investors.
When comparing the Personal Finance industry to the other four industries in the overarching
FinTech industry, results show that this industry is
the only one to show significant market share gains over time when taking into account other industries (see Figure 14). Even if Digital Payments hold the greatest market share followed by a close tie between Alternative Lending and Personal Finance, Digital Payments starts to show noticeable declines in market share percentage over time and Alternative Lending stays relatively flat at 11%. Meanwhile, Alternative Financing stays flat at 1% and Special InsurTech flat at 4%. More importantly, it is the robo-advisor segment that contributes nearly 90% to the growth of Personal Finance. Therefore, robo-advisors are not only the fastest growing segment in Personal Finance, they are almost solely the reason why Personal Finance is the only growing industry in terms of market share compared to the other four industries under the FinTech umbrella.
Next, key robo advisor platforms are identified based on their financial value of assets under management (see Figure 16). These
robo-advisors were chosen because they have proven themselves to be market leaders and quite popular in the robo-advisor segment evidenced by their high AUM numbers. As it turns out, 90% of the top ten robo-advisors globally are from the US which is not
surprising given the large amount of platforms present there domestically. The
Vanguard Personal Advisor holds the greatest market share in the list followed by Schwab Intelligent Portfolios and
Betterment. Each robo-advisor is also classified either as automated or hybrid. These categorizations will be explained in “Future Services”. An in-depth look into each of these robo-advisors will also be developed later on under “Robo-Advisor Offerings and Differences.”
Future Services
Looking ahead, robo-advisors have much to offer in the future based on growing trends and emerging opportunities. Here are three main things to look forward to in the future:
Hybrid Robo-Advisors
Improved Artificial Intelligence Expanded Robo-Advisor Applications
Hybrid Robo-Advisors
In contrast to fully automated robo-advisors (which use computer algorithms to build and manage a client’s portfolio based on personal parameters such as risk and time horizons) that require little to no human interaction, hybrid robo-advisors are increasingly starting to gain prominence and importance in the market. This type of robo-advisor still offers automated investing but is also paired with access to a human financial advisor. What are the benefits? Essentially, pairing the 29
two strikes an optimal balance. This model utilizes the efficiency of automated investment management but also offers a personal touch which many individuals value. According to a survey, 56% of American investors value automated robo-advisors but the number jumps up to around 70% of investors who seek a blend of human and digital guidance. Being able to talk to 30
a human consultant could very well provide the much-needed advice to complement automation such as identifying important investment goals, understanding the best approaches during market volatility, learning customer behaviors, and guiding them through major life events and complex financial needs such as estate planning (arranging the transfer of assets to pass on to future heirs) . Of course, when it comes to hybrid robo-advisor fees, they do come at a premium 31
compared to purely automated robo advisors but are certainly cheaper than full-time human financial advisors. The trajectory for hybrids is also seen as more optimistic than “pure” robo advisors. By 2022, hybrids worldwide are expected to represent 66% of robo-advisory AUM compared to 25% for fully automated robo-advisors. Currently, the top hybrid robo-advisors are 32
Vanguard Personal Advisor, Betterment, E-Trade Core Portfolios, Wealthsimple, and Rebalance IRA.
Improved Artificial Intelligence
As cognitive computing, big data, and behavioral analytics continue to improve, investment opportunities will become better matched to the needs of clients. Based on historic client
behavior, artificial intelligence (AI) will be able to pick up patterns, adapt to changes, and provide necessary guidance. From gathering data about the choices the investor makes and from market
29 Voigt, Kevin. “Robo-Advisor vs. Personal Financial Advisor: How to Decide.” NerdWallet , 8 Oct. 2018
30 Anderson, Tom. “Man vs. Machine: How to Figure out If You Should Use a Robo-Advisor.” CNBC , CNBC, 13 Mar. 2017 31 Sin, Ray. “Robo-Advisors vs. Financial Advisors: Will Only One Remain? - Morningstar Blog.” Morningstar , 24 July
2018
32 “Fully-Automated Roboadvisors to Manage Nearly $1 Trillion Assets by 2022, Growing at 154% Per Annum.” Juniper
events, new investment products and services will be suggested as well. One of the biggest 33
caveats with artificial intelligence in robo-advisors as of now is the inability to deal with the emotional side of investing. However, there is hope that this will change and that AI will actually be able to assess investors’ moods to be factored into investment decisions. For instance, sensing that clients are having a difficult time remaining calm during a turbulent and declining market will actually provide opportunities to convince them to hold their portfolios. This would 34
prove to be a major improvement from ultimately being controlled by users’ emotional impulses to sell the assets completely. Furthermore, it is expected that artificial intelligence will enable robo advisors to be able to choose an investment strategy and then smoothly change strategies back and forth in real time without human interference. Lastly, machine learning will be leveraged by actually being able to predict changing market conditions and then optimizing strategies accordingly. 35
Expanded Robo-Advisor Applications
Existing wealth management services can be improved upon using the robo-advisor platform through digitization and by taking advantage of the technology’s existing strength of cost
effectiveness. As of now, very few robo-advisors assist in retirement planning for their clients and the vast majority focus on passive portfolio management. Using data analytics and simulations, the platform can become more involved in processes such as calculating actuarial (statistical) life expectancies to understand when the individual can start receiving retirement benefits. In the realm of estate planning, robo-advisor analytics and simulations can also help determine optimal intergeneration asset transfers from the client to their heirs and close ones with the most efficient tax structures. It is important to understand that clients in both retirement and estate planning tend to be very affluent, thereby making it a likely possibility that robo-advisors will pursue this to maintain and grow their existing affluent base rising from cheap fee structures. Though some robo-advisors are already helping their clients manage taxes through services such as tax loss harvesting, customized algorithms for global clients can be used to recommend asset/security combinations from different countries which are ultimately tax beneficial to clients depending on where they live. Finally, the technology can add insurance products to protect a client's’ wealth and/or income.
33 Spitz, Christian J. “How Artificial Intelligence Will Change the Role of Financial Advisors.” Accenture Capital Markets
Blog , 24 Jan. 2018
34 Berman, Larry. “Financial Planning: The Future of Artificial Intelligence and Robo Advisors.” Berman's Call , 27 Nov.
2017
A Closer Look at Robo-Advisors
Underlying Mechanics
The purpose of this section will be to take an in-depth look into the asset allocation process of robo-advisors. This process can generally be divided into three sections: Evaluation, Selection, and Adjustment.
Evaluation
To initiate the process, clients first complete an online questionnaire that touches on areas such as investment needs, financial goals, and their willingness to take on risk. What’s the purpose? Feedback from investors ultimately factors into the process of developing a tailored portfolio set up with defined investment goals, a particular risk category, and responsive portfolio breakdowns among asset classes. To get a better understanding of what particular questions are asked on the evaluation form, readily available questionnaires were
extracted from Schwab Intelligent Portfolios, Betterment, Wealthfront, E-Trade Core Portfolios, and Fidelity Go (see Figure 17), compiled, and then analyzed to identify their respective similarities. Consequently, a generic client questionnaire was created that included questions which would more or less typically be asked by a robo-advisor. This questionnaire has ten questions, which is usually the average amount listed in this kind of survey.
With regards to the first question, robo-advisors mainly ask whether the investor’s goal is to prepare for retirement, save for major expenses such as an education/vacation, a rainy day fund for emergencies, generate income to cover future expenses, or simply to build long term wealth. These are typically the options provided in order for the user to answer the question. Sometimes, robo-advisors may want the user to respond in terms of the risk they’re willing to take (see Figure 18).
Number 7 in the questionnaire asks what kind of account the investor would like to open. While there are a wide variety of accounts which can be selected from, options typically would be categorized into three types of accounts:
Brokerage IRA
Trust
Brokerage
A brokerage account is a taxable account which has no tax advantages. For example, income earned yearly from this account will not be exempt from any deductions. However, there are no rules that limit the amount and timing of the user’s contributions and withdrawals to and from the account. This account usually can either be individual or joint. Individual brokerage accounts have only one user as the sole owner whereas joint brokerage accounts are co-owned with another individual or individuals. For joint brokerage accounts, a person’s interest in the account transfers to the surviving owner(s) upon death.
IRA
IRA’s are also known as Individual Retirement Accounts. They are typically utilized for users investing in growth for a long time horizon and who don’t seek to use their investment money before retirement. IRA’s are tax-advantaged and can provide tax savings for investors. On the flip side, there are contribution limits and penalties for premature withdrawals. This account usually can either be Traditional, Roth, or SEP. Traditional IRA’s allow users to avoid paying taxes on their investment earnings until withdrawals are made. If income is below a certain level, then tax benefits could also be provided upon contribution to an account. With Roth IRA’s, contributions are made that have already been taxed so withdrawals (except early withdrawals) can be tax-free. SEP IRA’s or Simplified Employee Pension plan IRA’s are for individuals who are either
Trust
A revocable living trust is an account that the user would like to pass on to another individual after their death. This is a private legal arrangement that places the user’s assets in trust during their lifetime and specifies where they would go upon death. The user can name themselves as the only trustee or can include their heir as a second trustee to manage the account if needed. 36
Questions 8-10 help define the user’s risk profile. For question 8, a scale of 1 to 10 is incorporated for the user to manually select their risk tolerance, 1 being the least risk tolerant (minimize
short-term losses) and 10 being the most risk tolerant (maximize total returns). This question can also be posed in different ways such as determining the amount of risk that the user is willing to take to keep up with inflation (reduction in purchasing power/increase in prices) or evaluating their attitudes towards high risk and volatility (see Figures 19 and 20).
The robo-advisor provides various scenarios as options for question 9 to determine the investment outlook most ideal for the user. These include sliders/graphs to determine the preferred amount of investment value gain/loss fluctuation (volatility) given an year in % and dollar terms (see Figures 21-24). If low fluctuation is selected, the user will likely have a low risk profile and vice versa.
36 “What Type of Account Should I Open with Schwab Intelligent Portfolios®?” Charles Schwab Intelligent Portfolios , 25
Finally, question 10 assesses the investor’s risk profile by posing the question so that the options available to select would represent behavioral responses. Hypothetically, users’ reactions are evaluated during a difficult time (when the market dips). In this case, if the user chooses to “Buy more” in response to the first question and “Do nothing” in response to the second question, then the user will likely have a high risk profile (see Figures 25 and 26).
Selection
they are a commercial secret. However, it is known that these formulas are derived from 37
existing, well-known theories, models, and approaches. These primarily include: Modern Portfolio Theory
Full Scale Optimization Black-Litterman Model
Modern Portfolio Theory
The Modern Portfolio Theory is an investment theory put forth by Harry Markowitz. This theory is based on the notion that investors can optimize their stock portfolios in order to maximize returns for their given level of market risk. Its central component essentially involves looking at the expected risks of a number of stocks and then
understanding how these risks play off one another. For instance, this includes analyzing stocks that move in different directions given the same market conditions. In this way, investors can benefit from having a diversified portfolio by strategically positioning assets to reduce the portfolio’s overall risk. With the theory’s formulas, a relatively passive approach to investing is advocated. Despite this, 38
the theory shows that the risk of a portfolio cannot be entirely eliminated with diversification. For instance, the risk of an individual asset can be divided into either firm-specific and systematic risk. Firm-specific risk refers to risk associated with a particular company but can be averaged
out with diversification since the fluctuations of an asset’s return caused by firm-specific news are independent. On the other hand, systematic risk cannot be eliminated because here, fluctuations in returns are dependent on market news like economic cycles and interest rate changes.
Through diversification then, risk can be reduced in a portfolio only if individual stocks have small correlations with the rest of the stocks in the portfolio. In other words, low correlations reduce portfolio risk since this indicates that each stock has a varying risk relative to other stocks thereby eliminating firm-specific risk. However, when calculating the expected return of a portfolio, the expected return of the portfolio essentially equals a weighted average (an average of values by taking into account each value’s importance which is quantified) of the expected returns using individual stocks. Therefore, this makes it possible for diversification to yield high returns but also lower risk or volatility. Furthermore, Figure 27 shows that increasing the number of securities in a portfolio can reduce firm-specific risk significantly.
37 Ivanov, Oleskii, et al. “Implementation of Robo-Advisors Tools for Different Risk Attitude Investment Decisions .” p. 3.
One key framework included in the Modern Portfolio Theory is the concept of mean-variance optimization. This is a key strategy to developing optimal portfolios. According to the idea, two measures are required to understand this concept.
First, an expected portfolio return is calculated by performing a weighted average of individual security returns. Next, a portfolio’s variance is similarly
computed by finding the weighted average of
individual security variances. Variance can be thought of as a measure of risk or volatility. Assuming investors seek higher expected returns and lower variances, the optimal portfolio can be constructed by essentially solving a quadratic equation to maximize the expected return for a certain target variance. Maximizing
expected returns for every possible target variance provides an efficient frontier. Where does diversification come into play here? By adding more assets to a portfolio,
diversification can be increased and thereby improve the efficient frontier. Figure 28 represents the efficient frontier as a line that represents optimal portfolios for a given expected return and volatility. If portfolios fall below this line, they are not optimized. 39
Full Scale Optimization
Mean-variance optimization, as explained earlier, unfortunately has disadvantages. When calculating individual asset expected returns to be factored into the computation of a portfolio’s expected return, periodic returns for the assets (or returns calculated for a specific time interval in the assets’ history of returns) are ignored and assumes that the distribution of the expected returns are not skewed (asymmetric). In reality, returns are extreme (take the financial crisis of 2007-2008, with returns skewed to the left). Variances of individual assets also suffer from this flaw in a similar way. Furthermore, mean-variance optimization assumes that clients are indifferent to gains and losses. In reality, investors avoid risk when gains exist and seek risk when losses exist. Moreover, preferring to avoid losses outweigh seeking gains, a concept known as loss aversion. Therefore, many possible outcomes of investor preferences can be generated by tweaking the degree of loss aversion and tendencies to avoid risk as well as seek risk. With full scale optimization, any set of return distributions (skewed, normal (symmetric), etc.) and investor preferences can be accomodated. True optimal portfolios can therefore be generated rather than the mean-variance approximate optimal portfolios.
Black-Litterman Model
Another downside to mean-variance optimization is that the optimal portfolios generated have unreasonable portfolio weights. For instance, large weights are assigned to only a few assets with zero weights to a majority of assets. This is caused by extreme sensitivity to asset return assumptions as well as the difficulty of estimating asset returns. These imbalanced weights ultimately are unlikely to provide enough diversification benefits in the long run. To resolve this issue, the Black-Litterman model calculates expected individual asset returns using equilibrium returns and the views of investors. How are equilibrium returns calculated? A process known as reverse optimization is used to calculate what an asset’s expected return should be in order for mean-variance optimization to generate an optimal portfolio where the asset’s weight equals its weight in a market portfolio (a bundle of all types of assets in the world, with each asset weighted according to its market capitalization (weight)). If an investor believes the expected asset return differs from what the market calculates it to be, expected returns are adjusted. Adjustments can also respond to the degree of confidence an investor has in their own beliefs. Otherwise, expected returns equal equilibrium returns. From there on, these expected return estimates can be factored into the mean-variance optimization model to obtain the efficient frontier. One downside to this approach, however, is that it is often difficult to identify the market portfolio. 40
According to a study in 2017 (see Figure 29), nearly 41% of robo-advisors actually end up incorporating the Modern Portfolio Theory, 4.5% use the Black-Litterman model, and 2.3% use Full Scale Optimization. Taking out the 31.8% of robo advisors who have not specified a 41
methodology, these numbers change significantly. Now, 60% of robo-advisors reporting their methodology use the Modern Portfolio theory, 6.6% use the Black-Litterman model, and 3.4% use Full Scale Optimization.
After completing the questionnaire, users are navigated to a separate page which shows the algorithm-generated portfolio tailored to their needs. What does this look like? After analyzing “results” pages for each of the five robo-advisors introduced earlier, the E-Trade Core Portfolios was the one robo-advisor that was deemed to be the most optimal for understanding the
essential layout of this final page. It encompasses more or less the same elements that would be found on the other four robo-advisor sites and unlisted robo-advisors in this paper as well.
Figures 30 and 31 show these visualizations. Based on these images, users can expect to see the response structured in three parts: risk assessment, portfolio allocation breakdowns, and
hypothetical returns given the tailored portfolio.
40 Bjerknes, Line, and Ana Vukovic. “Automated Advice: A Portfolio Management Perspective on Robo-Advisors.” June
2017, pp. 14–23.
Risk Assessment
Portfolio Allocation Breakdowns
Next, the user’s portfolio would be segmented into different asset classes. Generally,
Breakdowns of core bonds could consist of US government bonds, TIPS (treasury
inflation-protected securities), municipal bonds, and securitized bonds (backed by the cash flows of a particular asset). Bonds can additionally be either domestic or international just like stocks. Typically, investments in portfolios generally consist of ETFs or exchange traded funds, with the exception of very few robo-advisors such as Fidelity Go using mutual funds for their investments. Why ETFs? By using them, robo-advisors have the ability to create a diversified, risk-adjusted portfolio for their clients, largely mimicking the Modern Portfolio Theory that many robo-advisors are based off of. By investing in ETFs, for instance, there would be a broad exposure to a
collection of stocks or bonds minimizing the risk compared to just a portfolio with a single stock. Additionally, robo-advisors incur low costs of managing a portfolio created solely with ETFs. Because of these cost savings, clients would typically experience lower management fees as well (on average between 0.3-0.5% compared to 1% or more for mutual funds). ETFs generally 42
chosen come from investment management companies such as Vanguard, Blackrock, Schwab, SPDR, and Invesco.
Hypothetical Returns
Finally, the user would be able to view speculative returns based on the portfolio that was constructed by algorithms. Figure 31 shows this by displaying the historical index returns. How is this calculated? Essentially, a weighted average is calculated using the weights determined for each asset class in the portfolio as well as market index historical returns representing each asset class. What are market indexes? Most robo-advisors utilize ETFs as investments comprising the entire portfolio. An essential component of these ETFs are their ability to track a broader index as their benchmark in order to mimic their performances. For instance, the small-mid cap stock asset class would track an index such as the S&P SmallCap 600 Index which measures the small-cap segment of the U.S. equity market. The returns that are displayed, however, assume that any 43
dividends paid out are reinvested and are rebalanced twice a year (a discussion of rebalancing is explained shortly). All three returns shown in the figure are returns in an year, or a 12-month time period. The best and worst cases use a rolling 12-month period with a one-month moving time step. Other hypothetical returns could be shown on a graph over time with average case, best case, and worst case being called average market, strong market, and poor market respectively. These returns tend to be represented cumulatively and therefore, twenty years down the road, returns could very well be greater than 100%. However, a range of returns is given to the client for bear and bull case scenarios in a 12-month period with an average annual return. Finally, clients may even directly be provided future values of their portfolio in dollar terms over time in a weak and average market. These values can be calculated by first creating a hypothetical portfolio of indexes with similar asset allocations to show its performance. For instance, a portfolio with a 80% bond, 20% stock allocation would have a comparable portfolio of indexes with these same allocations. Magnitude of values ultimately depend on the amount of money contributed to the
account and assuming non-withdrawals occur until the withdrawal date specified by the user. Again, historical data would be used and then many simulations would be run for the hypothetical portfolio under many market conditions. One caveat, however, with these numbers is that they are all conjectural and so do not represent actual performance of these custom portfolios. They are used only for an overview demonstration, help set expectations, and sometimes, do not take into consideration important factors such as past portfolio allocation changes as well as
deduction of fees and other charges. Therefore, actual returns will be different and the projections do not guarantee investment performance.
Adjustment
Even after users deposit funds into their tailored portfolios after account creation, not everything is set in stone. Stock markets can move unpredictably over time, especially with market
corrections. This may cause relative, pronounced gains or losses in several different asset class or classes comprising the portfolio throwing off asset allocations from the initial set-up. For example, if the stock market makes sizable gains over a period of time, then a 50%/50% allocation between stocks and bonds respectively could shift to a 70%/30% allocation. What happens here is that now the investor is exposed to more downside risk if the market actually corrects itself. This can be especially frustrating for individuals who are not willing to tolerate large amounts of risk. Therefore, robo-advisors rebalance or realign investors’ portfolios
automatically using proprietary algorithms so that their asset allocations do not deviate from their original positions. Rebalancing is performed by buying/selling assets that are 44
over/underrepresented in the portfolio. This is done through selling or reducing the holdings in stocks that have increased in value while buying stocks that have decreased in value, or buying low and selling high. Because of this, rebalancing can often generate gains as well, called rebalancing bonuses. This phenomenon can also occur if investors re-adjust their goals (e.g. by updating their retirement age and thereby changing the date at which funds need to be
withdrawn), their risk tolerance (choosing to tolerate more risk with increased confidence in the stock market), or for instance, simply by approaching closer to their goals after customized
portfolio creation. Rebalancing, by in large, costs nearly nothing, however, capital gains taxes may have to be paid out with the sale of appreciated assets (assets risen in value) depending on the account (a discussion of the types of accounts was discussed earlier). Additionally, there could be transaction costs for ETFs such as brokerage commissions and bid-ask spreads (the difference between the price that you can buy a fund and the price you can sell the fund). Algorithms, however, are employed to minimize these expenses during the process of rebalancing. How often does rebalancing occur? It is all up to the user. Reverting investments back to a target allocation can be done every three months, six months, annually, etc. This is called calendar rebalancing, the simplest and most common rebalancing strategy among investors and wealth managers. However, intermediate fluctuations in asset allocations are not accounted for in drift (or deviation) during the time of rebalancing. The other type of rebalancing is called
market-based rebalancing (also called opportunistic or threshold-based rebalancing). Rather than realigning the portfolio at set intervals, drift is continuously monitored. Whenever drift exceeds a pre-set percentage, rebalancing is triggered. Variations in both these strategies with regards to the level of drift that triggers readjustment and how far the portfolio is rebalanced to target asset allocations result in hybrid rebalancing strategies.
To ensure consistency with this section, research was done to understand which rebalancing strategy each of the five robo-advisors utilize (Schwab Intelligent Portfolios, Betterment, Wealthfront, E-Trade Core Portfolios, and Fidelity Go). All these robo-advisors mainly perform market-based rebalancing or share its features which is logical partly due to the fact that computers do have the capability especially today to continuously monitor the portfolio for any deviations. Everyday, portfolios are inspected for drift by a proprietary algorithm. To understand how drift is calculated, consider a simple example. Table 1 below shows a hypothetical portfolio with four asset classes.
Table 1. Hypothetical Portfolio Containing Stocks and Bonds With Four Specific Asset Classes
Asset Class Number of
shares Price per Share Shares x Price per Value (Number of Share)
Weight (Value of Each Asset Class/Total
Portfolio Value)
US Bonds 200 $40 $8,000 23.2%
International
Bonds 400 $25 $10,000 29%
US Stocks 300 $45 $13,500 39.1%
International
Stocks 100 $30 $3,000 8.7%
Total Portfolio
Value - - $34,500 100%
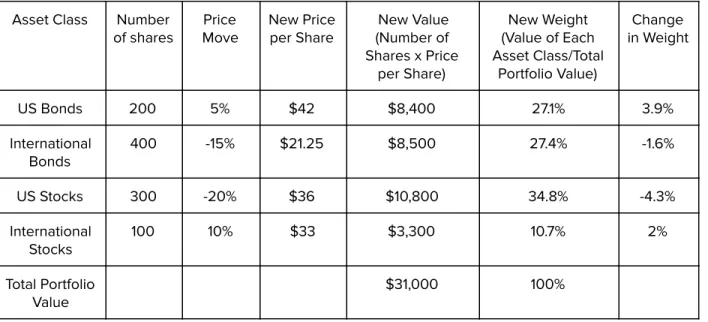
Now suppose some price movement occurs (see Table 2):
Table 2. Hypothetical Portfolio Post-Price Movement Results and Changes
Asset Class Number
of shares Move Price New Price per Share New Value (Number of Shares x Price
per Share)
New Weight (Value of Each Asset Class/Total
Portfolio Value)
Change in Weight
US Bonds 200 5% $42 $8,400 27.1% 3.9%
International
Bonds 400 -15% $21.25 $8,500 27.4% -1.6%
US Stocks 300 -20% $36 $10,800 34.8% -4.3%
International
Stocks 100 10% $33 $3,300 10.7% 2%
Total Portfolio
Value $31,000 100%
Clearly, each asset class weight has changed due to these price movements. To allow for understanding, portfolio drift could be calculated in simpler terms as follows (see Table 3):
Table 3. Portfolio Changes and Absolute Changes in Weight for Portfolio Drift Calculation
Change in Weight Absolute Change in Weight
3.9% 3.9%
-1.6% 1.6%
-4.3% 4.3%
2% 2%
Total Absolute Change in Weight: 3.9% + 1.6% + 4.3% + 2% = 11.8%
Since the four asset classes fall under two broader categories, stocks and bonds: 11.8% / 2 = 5.9%
Thus, 5.9% is the drift of the portfolio after taking into account price movements of each asset class.
To reduce drift, market-based rebalancing can occur in these three cases: Cash Flow Rebalancing
Sell/Buy Rebalancing
Cash Flow Rebalancing:
Whenever there is a cash deposit, withdrawal, or accrual of portfolio dividends (fund payouts), proceeds are used to invest in underrepresented asset classes or come from selling
overrepresented asset classes with withdrawals. If a user auto-deposits or receives dividends, robo-advisors use these cash inflows to buy underweight asset classes in order to reduce drift (in the above example, these would be US Stocks and International Bonds). Because this reduces the need to sell appreciated asset classes, capital gains taxes on proceeds are avoided. On the other hand, overrepresented asset classes such as US Bonds and International Stocks here would be sold if cash withdrawals become a priority.
Sell/Buy Rebalancing:
This happens whenever portfolio drift deviates by more than a specified amount. When cash flows (deposits, dividend reinvestments, or withdrawals) do not occur in a robo-advisor account, assets that are already in the portfolio are reshuffled through selling and buying. If cash flows are not sufficient to keep drift within a tolerance level, then some overweight asset classes are sold and the resulting proceeds are used to buy underweight asset classes to eliminate the drift. For example, refer back to Tables 1-3. Under Sell/Buy Rebalancing, US Bonds would be sold first until its weight returns back to 23.2% because this asset class increased the most in terms of change in weight. Next, International Stocks would be sold until 8.7% weight is achieved since this was the second class that also experienced gains in weight, but not as much as US Bonds. Proceeds from the sales of these classes are reinvested and first used to buy shares of the US Stocks class since it is the most underweight followed by International Bonds until target weights of 39.1% and 29% are once again accomplished. It is important to note however that sometimes, reverting back to target weights fully is not possible especially if an account is small and fractional shares are needed to satisfy this goal but the robo-advisor in question does not support this capability.
Allocation Change Rebalancing:
If a client changes their investment goals, time horizon, and/or risk preferences, then the portfolio strategic allocation will consequently change. For instance, an investor may decide to tolerate 45
less risk or become more conservative after losing confidence in the market which can then be updated in the platform. To rebalance the portfolio, securities would be sold and capital gains (profits from sales of assets) could thereby be realized as well, potentially subject to taxation. In 46
this scenario, executing trades such as selling shares of International Stocks in favor of US Bonds could be a likely possibility to satisfy the client’s changing attitude and the new target allocation.
Robo-Advisor Offerings and Differences
45 Bjerknes, Line, and Ana Vukovic. “Automated Advice: A Portfolio Management Perspective on Robo-Advisors.” June
2017, pp. 33-36.
Next, the top ten robo-advisors by AUM from Figure 16 were researched to better understand what each offered and how they compared to each other. Figures 32 and 33 display this information below.