The Interest Rate Transmission Mechanism in
China
Yiping Xu
Peng Zhang
yJanet Hua Jiang
zNov 24, 2009
Abstract
The People's Bank of China (PBC) conducts open market operations through
is-suance of central bank bills and repurchases of treasury bonds in the inter-bank market.
This paper investigates the effectiveness of PBC's policies by studying the
transmis-sion mechanism among 17 interest rates on the inter-bank and bourse markets. We nd
that there is little transmission running from repo rates to other interest rates, so that
PBC's open market operations through inter-bank repos are largely ineffective. The
central bill rates, especially the 60-day rate, have some effect on the long-term
inter-bank and bourse market rates. PBC can thus exert some control over long-term rates
by using central bank bills as the instrument for open market operations. However,
the treasury bonds rates are still the leading rates and the effect of the central bill rates
depends largely on how strongly it is correlated with the treasury bonds rates. There
is some extent of segmentation between the inter-bank and bourse markets.
Trans-mission between the two markets relies mainly on transTrans-mission between the treasury
bonds rates. Based on these ndings, we conclude that in the current situation, it is
very dif cult for PBC to affect market interest rates through open market operations.
School of International Trade and Economics, University of International Business and Economics, [email protected]
ySchool of International Trade and Economics, University of International Business and Economics,
JEL Categories: E4, E5, G12
Keywords: Interest rate transmission, Monetary Policy, Open market Operations,
Repos
1 Introduction
In the past three decades, China's monetary policy has experienced signi cant
transforma-tion. The conduct of monetary policy has moved gradually from centrally controlled credit allocation toward market allocation of funds. However, unlike in developed economies, the
channel for market allocation of loans is still clogged in China. One key problem is that interest rates are not completely driven by market forces yet. For example, deposit and
lending rates remain under direct control of the central bank (the People's Bank of China and hereafter PBC).
Marketization of interest rates has been a long-term target of China's nancial system reform.1 Via a series of reforms, PBC has laid down the foundation for conducting
mon-etary policies through market mechanisms.2 Most importantly, PBC has established two
major markets where interest rates are determined by market demand and supply: the
inter-bank market and the bourse market (which includes the Shanghai Stock Exchange and the Shenzhen Stock Exchange). At the time being, six types of securities are traded in these
markets: inter-bank lending, repos, treasury bonds, central bank bills, corporate bonds and nancial bonds.3 Five instruments – inter-bank lendings, central bank bills, repos, treasury
bonds and nancial bonds – are traded in the inter-bank market. Three instruments – repos,
1For example, the "Decisions" released by the third Plenary Session of the 16th Central Committee of
Chinese Communist Party (in 2002) states that "China's government will smoothly push marketization of in-terest rates, establish a mechanism through which inin-terest rates are determined by market supply and demand, and guided by PBC's monetary policy tools ".
2In 1993, China's nancial system underwent an overhaul reform, which freed commercial banks from
policy nancing. In 1994, the reserve requirement system was established, and PBC initiated the rediscount-ing business. In 1996, open market operations were introduced. In the same year, PBC established the nation-wide electronic trading system for inter-bank lending. The inter-bank lending rate and inter-bank repo rate were decontrolled in June 1996 and June 1997, respectively. Market issuance of policy nancing bonds, treasuries and central bank bills were conducted in 1998, 1999 and 2003. In 2007, PBC created the Shanghai Inter-bank Offer Rate (Shibor) to serve as the base market interest rate.
3Financial bonds are issued mainly by policy banks, such as China Development Bank, Export-Import
treasury bonds and corporate bonds – are traded in the bourse market. Among these secu-rities, inter-bank lendings, central bank bills and repos are short-term instruments, and the
rest are long term instruments.
PBC conducts open market operations through issuance of central bank bills and re-purchases of treasury bonds in the inter-bank market. Trading central bank bills in the
inter-bank market is a special feature of PBC's open market operations. Central bank bills were created in2003for two purposes. First, China does not issue treasury bills, and central
bank bills serve as a stand-in for treasury bills as a risk-free short-term asset. Second, in
2002, a rapid expansion of foreign exchange reserves induced a fast growth of base money.
PBC conducted open market operations (buying cash and selling treasury bonds) to ster-ilize this effect. However, persistent growth in foreign exchange reserves depleted PBC's
treasury bonds holdings. Central bank bills were introduced to make up the shortfalls of treasury bonds.
The purpose of this paper is to study whether China has established an effective
trans-mission mechanism among market interest rates after so many years of efforts. In devel-oped economies, central banks usually choose some short-term interest rate as the target
for monetary policies and rely on the transmission from short-term rates to long-term rates to in uence real economies.4 A large literature has been devoted to the study of interest
rate transmission mechanisms. Hall, Anderson and Granger (1992) nd that yields of
dif-ferent maturities can be cointegrated. Hefferman (1997) uses the Vector-Error-Correction
(VEC) model to study how four retail interest rates respond to the benchmark rate set by the British central bank. Atesoglu (2003) investigates the relationship between the US federal
funds rate and banks' lending rates. Similar research includes Rosen (2002), Hofmann and
Mizen (2004), and Nautz and Offermanns (2006). De Bond (2005) studies the interest rate
transmission in the Euro area. He nds that shocks of the of cial base rate can be com-pletely transmitted to short-term interest rates, but have only trivial impact on long-term
interest rates. Sander and Kleimeierb (2006) compare the interest rate transmission
mecha-nism in eight middle and east European new EU member countries. Other related research
4According to a study by the Bank for International Settlements, many countries (including Australia,
includes Burgstaller (2005), Betancourt, Vargas and Rodriguez (2008), Jesús, Balázs and
Reininger (2008), Weth (2002), and Bredin, Fitzpatrick and O'Reilly (2002). To the best
of our knowledge, there are only three studies on interest rate transmission mechanisms in China. Dai and Liang (2006) perform a Granger causality study between inter-bank lending
rate, repo rate, one year term deposit rate and rediscounting rate. Fan and Zhang (2006) nd
that the inter-bank repo rate is higher in the bourse market than in the inter-bank market,
which suggests that there is segmentation between the two markets. Fan and Zhang (2007)
investigate the correlation between inter-bank repo rates of different maturities.
Our paper focuses on two issues. First, we study theintra-markettransmission
mecha-nism in the inter-bank market and in the bourse market. This is achieved by an investigation of the relationship among 10 inter-bank interest rates and among6 bourse interest rates.
We are particularly interested in whether there exist leading rates in these two markets and whether the repo rate and the central bank bill rate – the two main instruments of PBC's
open market operations – can affect other rates. Second, we characterize theinter-market
transmission mechanism between the inter-bank and bourse markets. We study the
rela-tionship between4inter-bank rates and3bourse market rates. The purpose is to determine
whether or not these two markets are segmented.
Our main ndings are as follows. (1) There is little transmission running from repo rates
to long-term rates. Furthermore, the inter-bank repo rate is affected mainly by the bourse market repo rate. This suggests that PBC's open market operations through inter-bank
repos are largely ineffective. (2) Central bill rates, especially the60-day rate, have some
effect on long-term inter-bank rates and bourse market rates. PBC can thus exert some
control over long-term rates by using central bank bills as the instrument for open market operations. However, the treasury bonds rate is still the leading rate and the effect of the
central bill rate depends largely on how strongly it is correlated with the treasury bonds rate. At present, the60-day central bank bill rate generates some impact on the treasury
bonds rates, but the impact is not strong. (3) There is some extent of segmentation between
the inter-bank market and the bourse market. Transmission between the two markets relies
rates through open market operations. The instruments used in the open market operations – the repo rate and the central bank bill rate – cannot play the role of base rates as in
industrialized countries.
The paper proceeds as follows. Section2outlines the theory of term structure which
serves as the theoretical foundation for the analysis of interest rate transmission
mecha-nisms. Section3describes data and the econometric model that we use. Empirical analysis
is conducted in section4. Section5concludes.
2 Theoretical Discussion
Our analysis of interest rate transmission mechanism is based on the theory of term
struc-ture of interest rates. Let R(k; t) denote the continuously compounded yield to maturity
of a k (k = 1;2;3; :::) period pure discount bond at time t. Hall, Anderson and Granger
(1992) show that the long-term rate can be expressed as the average of expected short-term
rates:
R(k; t) = 1 k
" k X
j=1
Et[R(1; t+j 1)]
#
+L(k; t); (1)
whereEtis expectations based on information available at timet. The term L(k; t)is the
premium term, which is the sum of risk premium, liquidity premium and term premium.
Different term structure theories differ in their assumptions about the form ofL(k; t). For
example, the expectations hypothesis assumes that L(k; t) is a constant.5 It is generally
accepted that interest rates followI(1)processes. However, interest rates of different
ma-turities may be cointegrated. This can be seen by rearranging (1) as
R(k; t) R(1; t) = 1 k
"k 1 X
i=1
i
X
j=1
Et R(1; t+j)
#
+L(k; t); (2)
where R(1; s) = R(k; s) R(k; s 1). The difference between R(k; t)and R(1; t)is
stationary if R(1; s)and L(k; t) are stationary. If this is the case, any yield series can
be cointegrated with the one-period yield. For a group of interest rates with n different
maturities, there should be (n 1) cointegration relationships, or (n 1) independent
cointegration vectors.
The objective of the empirical analysis is to quantify the interest rate pass-through in the
inter-bank market, in the bourse market and between the two markets. Based on the theory of term structure of interest rates described above, we carry out the analysis in four steps.
First, we test the unit root properties of the interest rate series. In the second step, we run cointegration tests following equation(2)to nd cointegration relations among the interest
rates. We then build conditional VEC models that incorporate the cointegration relations found in step2(to improve model ef ciency). Finally, we use the conditional VEC models
to analyze variance decomposition and impulse response functions. This approach has been widely used to study interest rate pass-through within a country or across different
countries.
3 Data Description
We choose16interest rates to investigate interest rate pass-through in the inter-bank market,
in the bourse market and between the two markets. There are10inter-bank interest rates:
1-day and7-day inter-bank repo rates (IBRR1D and IBRR7D), 7-day inter-bank lending
rate (IBOR7D), 7-day, 60-day and 1-year central bank bill rates (CBB7D, CBB60D and
CBB1Y), inter-bank1-year and 3-year treasury bonds rates (IBTB1Y, and IBTB3Y), and
1-year and 3-year inter-bank nancial bonds rates (IBFB1Y and IBFB3Y). There are 6
bourse interest rates: 1-day and 7-day bourse repo rates (SETBR1D and SETBR7D), 1
-year and3-year bourse treasury bond rates (ETB1Y and ETB3Y),1-year and3-year bourse
corporate bonds rates (ECB1Y and ECB3Y). The inter-bank lending rates and repo rates
can be directly observed. Other rates are extracted from term structure curves. All data are
provided by HongDing Data Company. The sample period is from May29, 2003to May
23, 2007(trading of central bank bills started in April 2003). There are993 observations
for each series. In the sample period, some securities were not traded on some days. In these cases, we interpolate the missing observations. The statistics of the16interest rates
[Insert table1here]
The statistics in table1suggest that the behavior of the interest rates is largely consistent
with the theory of term structure of interest rates. Long-term yields are on average higher
than short-term yields, which suggests the existence of term premium. We rank securities with the same maturity according to average yield. The ranking from high to low is
corpo-rate bonds, nancial bonds and treasury bonds; this provides evidence for the existence of risk premium. The7-day inter-bank lending rate is higher than the7-day inter-bank repo
rate because the former involves higher risk. An interesting observation is that although repos are the most heavily traded instrument in the bourse market, the two bourse repo
rates – SETBR1D and SETBR7D – exhibit high volatilities. Across the sample period,
SETBR1D ranges from0:54%to20:09%and SETBR7D ranges from0:54%to13%. Fan
and Zhang (2006) provide an insightful explanation about this phenomenon. In China, IPO
stocks are very attractive to investors since on average they offer very high returns. When
large capitalization IPOs are initiated, investors scramble for liquidity in the bourse repo market to gather funds to purchase the newly issued stocks, and the repo rates skyrocket as
a result.
4 Empirical Results and Analysis
In this section, we carry out empirical analysis of interest rate pass-through mechanisms in China. As a rst step, we perform unit root tests to determine whether the16interest rates
are stationary. All three speci cations(with time trend only, with intercept only, with both time trend and intercept) of the Augmented Dickey-Fuller (ADF) test show that 12rates
– CBB7D, IBOR7D, CBB60D, CBB1Y, IBTB1Y, IBFB1Y, ETB1Y, ECB1Y, IBTB3Y,
IBFB3Y, ETB3Y and ECB3Y – follow I(1) processes. However, ADF tests show that
the other4series – IBRR1D, SETBR1D, IBRR7D and SETBR7D – are I(1) processes only
under one speci cation (with intercept only). We thus run a second set of tests, the KPSS
tests, on these4series. Based on the KPSS tests, we can reject the null hypothesis that the
4series are stationary, and cannot reject the hypothesis that their differences are stationary.
In the following, we study the interest rate transmission mechanism in three parts. First, we study the10inter-bank rates to check the effectiveness of interest rate transmission in
the inter-bank market. Second, we study the 6 bourse rates to quantify the effectiveness
of interest rate pass-through in the bourse market. Finally, we investigate the pass-through
between the two markets by studying7interest rate series selected from the two markets.
Each part of analysis follows three steps: cointegration tests of interest rates, construction
of conditional VEC models based on the cointegration tests (to improve model ef ciency) and analysis of variance decomposition and impulse response functions based on the
con-ditional VEC models.
Variance decomposition is used to analyze the dynamic responses of a system of vari-ables to random shocks. It shows the proportion of forecast error variance of a certain
variable due to one standard deviation shock of its own and other variables in the model. The results of variance decomposition indicate the importance of different variables in
ex-plaining variations in a particular variable. Variables with higher contribution are viewed as having more in uence on the dependent variable. The ordering of variables is usually
determined by Cholesky decomposition based on economic theories. Priority is given to variables that, according to theories, affect other variables. According to the term structure
theory of interest rates, short-term rates affect long-term rates. As a result, we order the interest rates by maturity from short to long-term rates. The results of variance
decompo-sition, however, are sometimes affected by the ordering of variables. For example, even though there is no relationship between two variables, the result of variance decomposition
may suggest that the variable appearing rst affects the variable appearing later, but not vice versa. To ensure the robustness of the analysis, we perform variance decomposition
with the reverse ordering.
An impulse response function describes how a variable responds to temporary innova-tions in another variable, keeping all other variables constant. It depicts how a shock to
a variable is transmitted across the economy. Traditional impulse response functions are sensitive to the ordering of variables. Pesaran and Shin (1998) introduce the notion of
analysis, so that a unique impulse response curve can be obtained. In this paper, we use the generalized impulse response functions.
4.1 Interest Rate Pass through in the Inter-bank Market
We rst investigate the interest rate transmission mechanism in the inter-bank market.
4.1.1 Cointegration Tests of Inter-Bank Rates
Since interest rates followI(1)processes, we rst determine the rank of the cointegration
vector before building VEC models. Johansen and Juselius (1990) suggest tests to
deter-mine the number of cointegration vectors in a multivariate system. Consider the following VAR model withP variables andklags:
yt=c+ k
X
i=1 Q
i
yt i+"t (3)
wherecis constant, yt and "t areP 1 matrices, and"t iid N(0; ). If all series are
I(1) and can be cointegrated, equation (3) can be restructured to give the following ECM
representation:
yt = c+ k 1 X
i=1
( i yt i) + yt k+"t
j = I j
X
i=1
i
!
= I
k
X
i=1
i
!
whereIis the identity matrix. The number of independent cointegration vectors is equal to
the rank of . According to Johansen and Juselius (1990), the rank of can be determined
by the trace test or the max eigenvalue test.
We have10inter-bank rates. As discussed earlier in section2, if the interest rate spread
a system ofndifferent interest rates. The rank of cointegration vectors for inter-bank rates
is thus9. We list the results of the Johansen test in table2. Both the trace test and the max
eigenvalue test suggest that there are only7independent cointegration vectors. The result
shows that the relationship among the inter-bank rates is somewhat different from what is
suggested by theory.
[Insert table2here]
Equation(2)suggests that there should be a cointegration relationship between any pair
of interest rates. As a result, we try to nd7pairs of interest rates that can be cointegrated
and use their cointegration vectors to expand the complete cointegration vector space. The
cointegration vectors will then be used to construct a conditional VEC model to improve model ef ciency. To determine the form of the cointegration vectors, we perform unit root
tests on selected interest differentials (test results are listed in table3). Table3shows that
all7interest differentials are stationary series, suggesting that the vector(1; 1)0 serves as
the cointegration vector for all7pairs of interest rates. The lag length is selected according
to the AIC criteria. In the regression, we include the constant term but not the time trend.
[Insert table3here]
Letxdenote the10inter-bank rates; the elements ofxare ordered as IBRR1D, CBB7D,
IBRR7D, IBOR7D , CBB60D, CBB1Y, IBTB1Y, IBFB1Y, IBTB3Y and IBFB3Y. Let i
(i = 1;2; :::;7) be the independent cointegration vectors. According to the results from
table3, we impose7constraints on the cointegration vectors of the VEC model for
inter-bank rates:
1 = (0;1; 1;0;0;0;0;0;0;0)0,
2 = (0;0; 1;1;0;0;0;0;0;0)0,
3 = (0;0; 1;0;1;0;0;0;0;0)0,
4 = (0;0;0;0; 1;0;1;0;0;0)0,
5 = (0;0;0;0;0;1; 1;0;0;0)0,
6 = (0;0;0;0;0;0; 1;1;0;0)0,
The analysis below is based on the conditional VEC model.
4.1.2 Results for Interest Pass-through in the Inter-bank Market
In the following, we provide the results from analysis of variance decomposition and im-pulse response functions for the10inter-bank rates. As shown later, the results from VEC
variance decomposition and impulse response functions are largely consistent with each other. The predominant rates among inter-bank rates are IBTB1Y and CBB60D. There is
relatively effective transmission among short-term rates or among long-term rates. Trans-mission between short-term rates and long-term rates is relatively weak, and relies mainly
on the transmission between CBB60D and IBTB1Y.
Variance Decomposition of Inter-bank Market Rates According to the term structure theory of interest rates, short-term rates affect long-term rates. We thus perform variance
composition based on the Cholesky ordering which ranks short-term rates rst: IBRR1D, CBB7D, IBRR7D, IBOR7D, CBB60D, CBB1Y, IBTB1Y, IBFB1Y, IBTB3Y and IBFB3Y.
To ensure the robustness of the analysis, we also try the reverse ordering. It turns out that changing the ordering has no signi cant effect on the results. Here we only report the
results following the Cholesky ordering. Table 4 shows the percentage of forecast error
variance of a variable due to one standard deviation shock of its own and other model
variables at selected time horizons.
[Insert table4here]
One observation that stands out is that IBTB1Y and CBB60D play a predominant role in
the inter-bank market. These two rates are very important in explaining variations in other rates, while the reverse is not true. For IBTB1Y, the most powerful explanatory variables
are itself, CBB60D, IBRR7D and IBFB3Y, with weights of 61.19%, 10.79%, 7.27% and
6.97%, respectively at period400. For CBB60D, the main determinants are IBTB1Y and
itself; other rates contribute only a small portion of its variation. In the following, we discuss the results of the decomposition of other8rates.
short-term rates, IBTB1Y and CBB60D assume signi cant weights. For example, in period
400, the weight of IBTB1Y in the analysis of IBRR1D, CBB7D, IBRR7D and IBOR7D is
20:53%, 40.88%, 39.84% and41.93%, respectively. For CBB7D, IBRR7D and IBOR7D,
the weight of IBTB1Y is even higher than their own weights at15.44%,16.13% and6.57%,
respectively. Compared with IBTB1Y, CBB60D has less signi cant effect on the short-term
rates. Its role, however, is comparable to that played by the rates themselves (except for
IBRR1D, which plays a predominant role in explaining itself and accounts for53.39% of its
own variation in period400). For CBB7D, IBRR7D and IBOR7D, CBB60D accounts for
15.23%,16.79% and15.52% of their variation in period400. The short-term rates can also
explain each other. The two inter-bank repo rates, IBRR1D and IBRR7D, play an important
role in explaining each other, suggesting that repo rates of different maturities are affected by each other to some extent. For IBOR7D, the weights of IBTB1Y, CBB60D, IBRR7D
and IBRR1D are all higher than its own weight, suggesting that inter-bank lending rates are
affected by other rates. Other than IBTB1Y, long-term rates have very limited explanatory
power over the short-term rates.
Now let us turn to the 4 long-term rates. Overall, IBTB1Y plays a predominant role
in determining other long-term rates. In period400, IBTB1Y carries the highest weights
for CBB1Y, IBFB1Y, IBTB3Y and IBFB3Y, accounting for50.32%, 52.93%, 29.64% and
56.21% of the variation respectively. Besides IBTB1Y, CBB60D also plays an important
role in explaining most long-term rates. For example, It period 400, CBB60D accounts
for12.69%,10.99%,4.47% and10.03% of the variation of CBB1Y, IBFB1Y, IBTB3Y and
IBFB3Y. The long-term rates are also affected by IBRR7D; the effect, however, diminishes
with the reverse ordering. All other short-term rates have very small weights in the
de-composition of long-term rates, suggesting that short-term rates have no signi cant effect on long-term rates. There is evidence that long-term rates affect each other. For example,
besides itself and IBTB1Y, IBTB3Y is also affected by IBFB3Y.
Impulse Response Functions of Inter-bank Rates We carry out a second set of analy-sis to study the transmission mechanism. We follow Pesaran and Shin (1998) to use the
Table 5shows the deviation of the dependent variable induced by a standard deviation of
the independent variable at selected time horizons.
In general, the IBTB1Y shock has a signi cant effect on other rates, and its impact
tends to increase over time. In period 200, when the impact stabilizes, the in uence of
IBTB1Y shocks is the most pronounced in most cases. The impulse response functions
thus suggest that IBTB1Y is the key rate, a result that is consistent with the analysis of
variance decomposition. The CBB60D rate still has a notable impact on other rates, though
less so than that is suggested by variance decomposition.
For short-term rates, the results are similar to those from variance decomposition.
The short-term rates affect each other, with CBB60D having a wider and deeper effect.
Among the long-term rates, only IBTB1Y has signi cant effect on short-term rates. For
IBRR1D, CBB7D, IBRR7D and IBOR7D, the greatest impact is from IBTB1Y followed
by IBTB3Y and CBB60D. For the leading short-term rate CBB60D, the greatest impact is
from IBEB1Y, followed by IBTB3Y and itself.
[Insert table5here]
For long-term rates, the impulse response functions also show results consistent with those from variance decomposition. The long-term rates affect each other and the
pre-dominant rate is IBTB1Y. The CBB60D rate is the only shortterm rate that exerts signi
-cant impact on long-term rates. The impulse response functions for CBB1Y, IBFB1Y and
IBFB3Y indicate that the most signi cant impact is from IBTB1Y, followed by IBTB3Y
and CBB60D. For IBTB3Y, there is a notable impact from IBTB1Y and IBFB3Y; the
im-pact from CBB60D ranks the fourth. For the leading rate IBTB1Y, the greatest impact
comes from itself, followed by IBTB3Y and CBB60D.
4.2 Interest Rate Pass through in the Bourse Market
Now we study the transmission mechanism in the bourse market. We consider6 bourse
4.2.1 Cointegration Tests of Bourse Interest Rates
The results of the Johansen cointegration tests for the6bourse rates are listed in table 6.
Both the trace and eigenvalue tests suggest that there are3independent cointegration
vec-tors. However, pair-wise cointegration tests show that only one pair of series (ETB1Y and
ECB3Y) can be cointegrated. We thus impose only one restriction on the VEC model. Let
y denote the vector of bourse interest rates. The elements ofy have the following order:
SETBR1D, SETBR7D, ETB1Y, ECB1Y, ETB3Y and ECB3Y. The restriction that we
im-pose takes the form(0;0; 1;0;0;1)0. The following analysis of variance decomposition
and impulse response functions is based on the conditional VEC model.
[Insert table6here]
4.2.2 Results for Interest Pass-through in the Bourse Market
VEC variance decomposition and impulse response functions give similar results. In the bourse market, there does not exist a predominant rate like IBTB1Y in the inter-bank
mar-ket. Comparing with the inter-bank market, the bourse interest rates are not greatly affected by other rates, suggesting that the transmission mechanism in the bourse market is weaker
than in the inter-bank market. The link between short and long-term rates is very weak. The repo rates in the bourse market affect each other with the 7-day repo rate exerting higher
impact on the1-day repo rate. There is transmission from treasury bonds rates to corporate
bonds rates, but not vice versa.
Variance Decomposition of Bourse Market Rates Table7provides the results for
vari-ance decomposition of the bourse market interest rates at selected horizons. As a robustness check, we include regression results with the Cholesky ordering and the reverse ordering.
Two features stand out. First, for bourse interest rates, self-explanation is relatively high, which suggests that there is only limited effect from other rates. Second, short-term rates
assume very small weights in the decomposition of long-term rates, which suggests that short-term rates have little impact on long-term rates. We provide a more detailed
[Insert table7here]
First let us look at the2short-term rates, SETBR1D and SETBR7D. Decomposition of
SETBR1D shows that the weight of self-explanation is very large, followed by SETBR7D,
while long-term rates assume very small weights. This suggests that the1-day repo rate is
mostly affected by itself. The7-day repo rates has some in uence on the1-day repo rate.
The long-term rates have little effect on the 1-day repo rate. For SETBR7D, the largest
weight comes from the rate itself at55.46%, the second largest weight comes from ECB1Y
at31.86%. This suggests that the7-day repo rate is affected by long-term rates.
The decomposition of the long-term rates generates the following results. For ETB1Y,
the weight from itself is very high at 82.53%. For the reverse ordering, the own weight
is reduced to49.49%; in contrast, the weight of ETB3Y rises from6.05% to34.52%. For
ETB3Y, the weight of itself is71.16% with ETB1Y accounting for25.96% of the variation.
After the ordering is changed, the own weight increases to97.22% and the weight of other
rates are negligible. Overall, the effect of ETB3Y on ETB1Y is larger than the effect of
ETB1Y on ETB3Y. Decomposition of the two corporate bonds rates – ECB1Y and ECB3Y
– shows that the own weights for both series are very high. ETB1Y and ETB3Y also play a
notable role in explaining the two rates, suggesting that corporate bonds rates are affected by treasury bonds rates. Overall, for long-term bourse interest rates, self-explanation has
the greatest power. There is some transmission effect from treasury bonds to corporate bonds, but not vice versa.
Impulse Response Functions of Bourse Market Rates Table 8 lists the results of
im-pulse response functions at selected horizons. Two patterns are observed. The rst is that for most rates, the own weight is higher than those of other rates, which suggests that bourse
interest rates are not greatly affected by other rates. The second observation is that the im-pact of short term rates on long-term rates is very small. The two patterns are consistent
with the results from variance decomposition.
[Insert table8here]
relatively speaking, ETB1Y exerts more impact than other rates. For SETB7D, innovations
of ECB1Y generate large impact on it, suggesting that ECB1Y has some in uence on
SETB7D, which is consistent with the result from variance decomposition. Overall, we
conclude that in the bourse market, long-term rates have some impact on short-term rates.
Now let us check the impulse response functions for the4long-term rates. For ETB1Y,
the largest impact is from itself, followed by ETB3Y and ECB2Y; short-term rates have
little impact on ETB1Y. ETB3Y is affected mostly by itself. Besides, ETB1Y also causes
notable changes in ETB3Y, which suggests that 1-year treasury bonds rates have some
impact on3-year treasury bonds rates. For ECB1Y, the impact from itself is most
impor-tant. ETB1Y and ETB3Y also have some impact. For ECB3Y, the largest impact is from
ETB1Y and ETB3Y. For most long-term bourse rates, the biggest impact comes from itself,
suggesting that although long-term rates exert some effect on each other, the transmission mechanism is not very effective. Finally, treasury bonds have some impact on corporate
bonds. All these observations are again consistent with the results from variance decompo-sition.
4.3 Transmission Between the Inter-bank Market and Bourse Market
Finally, we study the transmission between interest rates from both the inter-bank and bourse markets. The purpose is to check the effectiveness of transmission between the
two markets. To do this, we select 7 interest rates from the two markets: 4 inter-bank
rates (IBRR7D, CBB60D, IBTB1Y and IBFB3Y) and3 bourse market rates (SETBR7D,
ETB1Y, and ECB3Y). Among these interest rates, IBRR7D and SETBR7D are repo rates
with the same maturity, and IBTB1Y and ETB1Y are both one year treasury bond rates.
There may exist some links between these two pairs. We also include the rates of two risky assets, IBFB3Y and ECB3Y. Finally, CBB60D is included since as shown in section4:1,
4.3.1 Cointegration Tests of Interest Rates in the Inter-bank and Bourse Markets
Table shows the results of the Johansen cointegration tests of the7selected rates. Both the
trace test and the eigenvalue test suggest that there are only 4 independent cointegration
vectors. According to the analysis in previous sections, we know that the yield spreads between three pairs of series – IBTB1Y and CBB60D, IBFB3Y and IBTB1Y, and ECB3Y
and ETB1Y – are stationary. This generates3restrictions on the cointegration vectors. To
nd the 4th cointegration vector, we examine the series ETB1Y and CBB60D and nd
that the yield spread (ETB1Y-CBB60D) is stationary. In total, we impose 4 restrictions
on the cointegration vectors. Let z denote the vector of the 7 rates. In z;the 7rates are
ordered as IBRR7D, SETBR7D, CBB60D, IBTB1Y, ETB1Y, IBFB3Y and ECB3Y. Let i
(i = 1;2;3;4) denote the cointegration vector. The 4restrictions that we impose on the
VEC model take the forms below:
1 = (0;0; 1;1;0;0;0)0,
2 = (0;0;0; 1;0;1;0)0,
3 = (0;0;0;0; 1;0;1)0,
4 = (0;0; 1;0;1;0;0)0.
[Insert table9here]
4.3.2 Results for Interest Pass-through across the Inter-bank and Bourse Markets
We rst provide an overview of the major ndings. There is transmission between repo
rates from bourse market to inter-bank market; other rates have little effect on the repo rates. The transmission of long-term rates between the two markets is relatively more
effective, with treasury bonds rates serving as the critical component of the transmission mechanism. The inter-bank treasury bonds rate has great impact on the bourse treasury
bonds rate, and the treasury bonds rates have a predominant role in determining the rates of nancial and corporate bonds. The central bank bill rate has some effect on the long-term
In the following, we analyze the results of variance decomposition and impulse response functions in more detail.
Variance Decomposition of Inter-bank and Bourse Market Rates The results from
variance decomposition are presented in table 10. We report the regression results with
the Cholesky ordering and the reverse ordering. Let us look at the3short-term rates rst.
The decomposition of IBRR7D shows that a huge weight comes from itself, and a notable
weight is from SETBR7D. This suggests that SETBR7D has some effect on IBRR7D. For
SETBR7D, the weights associated with all other rates are very small, suggesting that the
bourse market repo rate is little affected by other rates. For CBB60D, the highest weights
are from IBTB1Y and ETB1Y, which suggests that inter-bank treasury bonds rates affect
central bank bill rates.
[Insert table10here]
We have the following observations for the 4 long-term rates. There are large own
weights for IBTB1Y and ETB1Y. For IBTB1Y, the own weight is larger than ETB1Y. For
ETB1Y, the weight of IBTB1Y rises over time, and the weight of ETB1Y itself decreases
over time. By the end, the weight of IBTB1Y exceeds that of ETB1Y. These results suggest
that the treasury bonds rates affect each other, and the inter-bank rate exerts a larger impact on the bourse market rate (than vice versa). Following IBTB1Y and ETB1Y themselves,
CBB60D also assumes a big weight in the decomposition of IBTB1Y and ETB1Y, which
suggests that the short-term central bank bill rate affects the treasury bonds rates in both
markets. For IBFB3Y and ECB3Y, the weights of IBTB1Y and ETB1Y are much higher
than those of other rates, which suggests that treasury bonds rates affect other long-term rates in both markets.
Impulse Response Functions of Inter-bank and Bourse Market Rates In general, im-pulse response functions and variance decomposition give similar results. Table 11 lists
the results of the generalized impulse response functions. The results on short-term rates are as follows. For IBRR7D, the impact from itself and SETBR7D is larger than from all
SETBR7D, the impact from itself is very large, and other rates have very little effect on it.
For CBB60D, the impact of IBTB1Y and ETB1Y is large, and the impact from all other
rates is very small. Comparing with ETB1Y, the impact of IBTB1Y is relatively larger. We
can thus say that the treasury bonds rates on both markets affect the short-term rate of the
central bank bills, with the inter-bank rate having a larger impact.
[Insert table11here]
Now let us investigate the impulse response functions for long-term rates. For IBTB1Y,
the biggest impact is from itself followed by ETB1Y. Comparing with other variables
(ex-cept for the two treasury bonds rates), CBB60D also has some impact on IBTB1Y. For
ETB1Y, the most important impact comes from itself and IBTB1Y. As time goes by, the
self-impact decreases, the impact of IBTB1Y increases and exceeds the self-impact.
Be-sides itself and IBTB1Y, CBBD60also has relatively high (compared with all other rates)
impact on ETB1Y. The results suggest that the inter-bank treasury bonds rate has large
ef-fect on the bourse treasury bonds rate, and the short-term central bank bill rate also has
some effect on the bourse treasury bonds rate. For EBFB3Y and ECB3Y, the effect of
IBTB1Y is the largest followed by ETB1Y. The suggests that in the two markets, the
trea-sury bonds rates affect other long-term rates, with the inter-bank treatrea-sury bonds rate playing a more important role. Other than this, there is no direct transmission among the long term
rates across the two markets. There is thus some evidence that the inter-bank and bourse markets are segmented.
5 Conclusion
In this paper, we investigate the interest rate transmission mechanism in China and we have
three main sets of results.
The rst set of results are about the relationship among interest rates in the inter-bank
market. There is relatively effective transmission within short-term rates or within long-term rates. The1-year inter-bank treasury bonds rate and the60-day central bank bill rate
The second set of results are about the interest rates in the bourse market. Unlike in the inter-bank market, no leading rates are found in the bourse market. The bourse rates are
not greatly affected by other rates, which suggests that the transmission mechanism in the bourse market is weaker than in the inter-bank market. Thethirdset of results are about the
linkage between the two markets. There is transmission between short-term rates across the two markets, with the bourse repo rate exerting a bigger in uence on the inter-bank repo
rate. There is some evidence of transmission between long-term rates on the two markets. The key channel is through treasury bonds rates. Other than this, there is no evidence of
direct transmission among other long-term rates; this suggests that there is some extent of segmentation between the two markets. The short-term central bank bill rate has some
effect on the treasury bonds rates in both markets, which serves as another channel for interest rate transmission across the two markets.
The study of the paper has important policy implications for China's monetary policy.
PBC's market open operations are conducted by issuance of central bank bills and repur-chases of treasury bonds in the inter-bank market. We nd that there is little transmission
running from repo rates to long term rates. Furthermore, the inter-bank repo rate is mainly affected by the bourse repo rate. This suggests that it is almost impossible for PBC to use
the inter-bank repo rates to affect other interest rates through open market operations. The central bill rates, especially the60-day rate, have some effect on long-term inter-bank rates
and the bourse market rates. PBC can thus exert some control over the long-term rates by using central bank bills as the instrument for open market operations. However, treasury
bonds rates are still the most important rates and the effect of the central bill rate depends largely on how strongly it is correlated with treasury bonds rates. In addition, there is
some extent of segmentation between the inter-bank and bourse markets. The transmission between the two markets relies mainly on transmission between treasury bonds rates.
Al-though the central bill rate has some impact on other rates, the impact is much weaker than the impact of treasury bonds rates. As a result, it is very dif cult for PBC to control bourse
interest rates by issuing central bank bills in the inter-bank market.
central bank bill rates and treasury bonds rates. The aim is to use central bank bills to affect treasury bonds rates, which in turn, will affect other rates. A second suggestion is to remove
market segmentation to reduce the obstacles in the interest rate transmission channel. At this stage, it is not clear what factors have contributed to the segmentation. This is a topic
Table 2: Johansen cointegration tests of interest rates – inter-bank market
Rank r=0 r=1 r=2 r=3 r=4 r=5 r=6 r=7 r=8 r=9 Cointegration rank Trace 0.00 0.00 0.00 0.00 0.00 0.00 0.00 0.21 0.60 0.38 7
Max Eigenvalue 0.00 0.00 0.00 0.00 0.00 0.00 0.00 0.16 0.76 0.38 7
Notes:
The test regressions have an intercept but no time trend; lag length is selected based on AIC. The table reports the P values of the tests.
Table 3: Unit-root tests of selected interest rate spreads – inter-bank market
ADF test
Spread Intercept Trend and intercept Results
CBB7D-IBRR7D 0 0 I(0)
IBOR7D-IBRR7D 0.001 0.002 I(0)
CBB60D-IBRR7D 0.000 0.000 I(0)
IBTB1Y-CBB60D 0.003 0.000 I(0)
CBB1Y-IBTB1Y 0.000 0.000 I(0)
IBFB1Y-IBTB1Y 0.016 0.000 I(0)
IBFB3Y-IBTB1Y 0.000 0.001 I(0)
Notes:
ADF tests are performed. The null hypothesis is that the series has a unit root. The lag length is selected based on SIC.
Table 4: Variance decomposition of interest rates – inter-bank market
Explained by innovations in
Variation In IBRR CBB IBRR IBOR CBB CBB IBTB IBFB IBTB IBFB
in period 1D 7D 7D 7D 60D 1Y 1Y 1Y 3Y 3Y
5 77.84 0.82 19.36 0.30 1.06 0.08 0.24 0.04 0.24 0.02 IBRR1D 100 55.57 1.79 8.70 1.14 11.19 0.23 12.64 0.55 0.32 7.87 400 53.39 0.68 12.28 0.51 5.64 0.09 20.53 0.32 0.45 6.12 5 0.97 88.71 2.23 0.20 3.82 2.34 1.17 0.05 0.29 0.22 CBB7D 100 4.83 32.43 8.99 0.65 18.91 1.86 20.29 1.41 1.18 9.44 400 4.79 15.44 8.35 0.77 15.23 1.07 40.88 2.42 2.25 8.79 5 27.78 1.54 66.39 0.94 2.29 0.05 0.21 0.19 0.60 0.01 IBRR7D 100 12.55 4.25 26.57 2.51 22.37 0.70 17.88 2.24 1.25 9.68 400 8.22 2.85 16.13 1.61 16.79 0.56 39.84 2.83 2.28 8.89 5 23.87 0.83 45.75 26.15 1.85 0.05 0.23 0.30 0.79 0.17 IBOR7D 100 11.97 3.29 20.21 15.02 19.99 0.69 18.47 3.53 1.28 5.54 400 7.64 2.37 12.74 6.57 15.33 0.55 41.94 3.48 2.38 7.00 5 1.18 4.97 1.25 0.09 89.84 0.90 1.03 0.19 0.23 0.32 CBB60D 100 5.60 4.10 9.03 1.33 41.14 1.36 23.46 2.03 1.30 10.64
400 5.09 2.67 8.29 1.06 23.69 0.81 44.05 2.78 2.40 9.18 5 0.32 1.77 0.19 0.32 1.68 90.46 1.39 2.17 0.57 1.14 CBB1Y 100 3.68 3.41 5.70 1.26 14.28 24.09 31.47 9.19 1.55 5.35 400 4.41 2.22 7.13 0.97 12.69 7.31 50.32 5.07 2.67 7.22 5 0.57 0.14 0.80 0.07 0.17 0.51 94.52 0.98 2.15 0.10 IBTB1Y 100 3.61 1.30 5.95 0.51 7.37 0.29 69.97 3.38 3.43 4.20 400 4.43 1.61 7.27 0.77 10.80 0.40 61.19 3.35 3.22 6.97 5 0.98 0.30 0.43 0.16 0.70 0.33 0.87 95.60 0.33 0.32 IBFB1Y 100 3.09 2.51 3.27 0.48 8.19 2.02 35.49 40.86 1.67 2.43 400 4.29 1.92 6.57 0.76 11.00 0.83 52.93 12.48 2.79 6.44 5 0.59 0.37 0.77 0.08 0.06 1.74 28.95 1.42 65.95 0.07 IBTB3Y 100 2.22 1.63 6.51 3.03 2.63 1.43 31.79 1.37 39.38 10.02
400 2.72 1.71 8.26 3.13 4.47 1.23 29.64 0.59 33.15 15.09 5 0.23 1.63 0.46 0.65 0.41 0.32 2.17 13.58 0.52 80.04 IBFB3Y 100 2.05 1.70 2.63 1.40 4.16 0.59 46.13 14.66 1.94 24.75 400 4.07 1.71 6.47 0.97 10.03 0.47 56.21 5.96 2.90 11.21
Notes
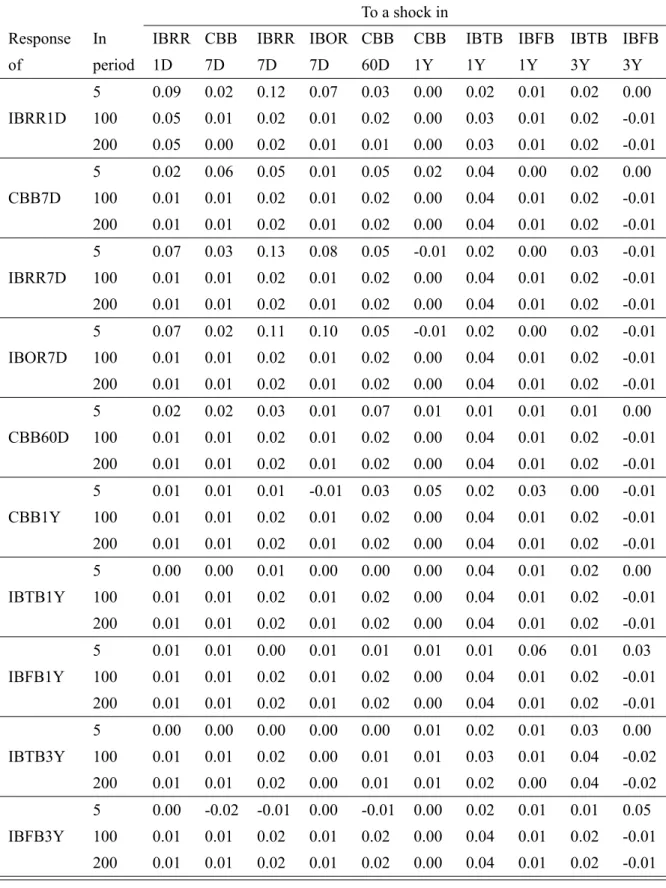
Table 5: Generalized impulse response of interest rates – inter-bank market
To a shock in
Response In IBRR CBB IBRR IBOR CBB CBB IBTB IBFB IBTB IBFB
of period 1D 7D 7D 7D 60D 1Y 1Y 1Y 3Y 3Y
5 0.09 0.02 0.12 0.07 0.03 0.00 0.02 0.01 0.02 0.00 IBRR1D 100 0.05 0.01 0.02 0.01 0.02 0.00 0.03 0.01 0.02 -0.01
200 0.05 0.00 0.02 0.01 0.01 0.00 0.03 0.01 0.02 -0.01 5 0.02 0.06 0.05 0.01 0.05 0.02 0.04 0.00 0.02 0.00 CBB7D 100 0.01 0.01 0.02 0.01 0.02 0.00 0.04 0.01 0.02 -0.01
200 0.01 0.01 0.02 0.01 0.02 0.00 0.04 0.01 0.02 -0.01 5 0.07 0.03 0.13 0.08 0.05 -0.01 0.02 0.00 0.03 -0.01 IBRR7D 100 0.01 0.01 0.02 0.01 0.02 0.00 0.04 0.01 0.02 -0.01 200 0.01 0.01 0.02 0.01 0.02 0.00 0.04 0.01 0.02 -0.01 5 0.07 0.02 0.11 0.10 0.05 -0.01 0.02 0.00 0.02 -0.01 IBOR7D 100 0.01 0.01 0.02 0.01 0.02 0.00 0.04 0.01 0.02 -0.01 200 0.01 0.01 0.02 0.01 0.02 0.00 0.04 0.01 0.02 -0.01 5 0.02 0.02 0.03 0.01 0.07 0.01 0.01 0.01 0.01 0.00 CBB60D 100 0.01 0.01 0.02 0.01 0.02 0.00 0.04 0.01 0.02 -0.01
200 0.01 0.01 0.02 0.01 0.02 0.00 0.04 0.01 0.02 -0.01 5 0.01 0.01 0.01 -0.01 0.03 0.05 0.02 0.03 0.00 -0.01 CBB1Y 100 0.01 0.01 0.02 0.01 0.02 0.00 0.04 0.01 0.02 -0.01 200 0.01 0.01 0.02 0.01 0.02 0.00 0.04 0.01 0.02 -0.01 5 0.00 0.00 0.01 0.00 0.00 0.00 0.04 0.01 0.02 0.00 IBTB1Y 100 0.01 0.01 0.02 0.01 0.02 0.00 0.04 0.01 0.02 -0.01
200 0.01 0.01 0.02 0.01 0.02 0.00 0.04 0.01 0.02 -0.01 5 0.01 0.01 0.00 0.01 0.01 0.01 0.01 0.06 0.01 0.03 IBFB1Y 100 0.01 0.01 0.02 0.01 0.02 0.00 0.04 0.01 0.02 -0.01
200 0.01 0.01 0.02 0.01 0.02 0.00 0.04 0.01 0.02 -0.01 5 0.00 0.00 0.00 0.00 0.00 0.01 0.02 0.01 0.03 0.00 IBTB3Y 100 0.01 0.01 0.02 0.00 0.01 0.01 0.03 0.01 0.04 -0.02
200 0.01 0.01 0.02 0.00 0.01 0.01 0.02 0.00 0.04 -0.02 5 0.00 -0.02 -0.01 0.00 -0.01 0.00 0.02 0.01 0.01 0.05 IBFB3Y 100 0.01 0.01 0.02 0.01 0.02 0.00 0.04 0.01 0.02 -0.01
Table 6: Johansen cointegration tests for interest rates – exchange market
Rank r=0 r=1 r=2 r=3 r=4 r=5 Cointegration rank
Trace 0 0 0.041 0.687 0.925 0.652 3
Max Eigenvalue 0 0 0.008 0.453 0.963 0.652 3
Notes:
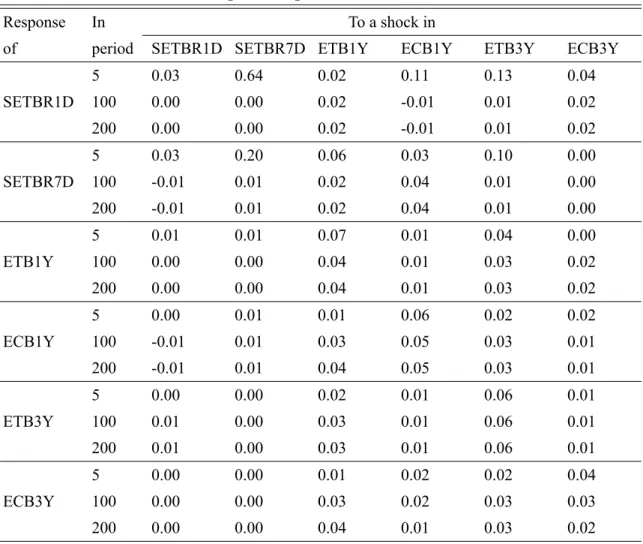
Table 8: Generalized impulse response of interest rates – bourse market
Response In To a shock in
of period SETBR1D SETBR7D ETB1Y ECB1Y ETB3Y ECB3Y
5 0.03 0.64 0.02 0.11 0.13 0.04
SETBR1D 100 0.00 0.00 0.02 -0.01 0.01 0.02
200 0.00 0.00 0.02 -0.01 0.01 0.02
5 0.03 0.20 0.06 0.03 0.10 0.00
SETBR7D 100 -0.01 0.01 0.02 0.04 0.01 0.00
200 -0.01 0.01 0.02 0.04 0.01 0.00
5 0.01 0.01 0.07 0.01 0.04 0.00
ETB1Y 100 0.00 0.00 0.04 0.01 0.03 0.02
200 0.00 0.00 0.04 0.01 0.03 0.02
5 0.00 0.01 0.01 0.06 0.02 0.02
ECB1Y 100 -0.01 0.01 0.03 0.05 0.03 0.01
200 -0.01 0.01 0.04 0.05 0.03 0.01
5 0.00 0.00 0.02 0.01 0.06 0.01
ETB3Y 100 0.01 0.00 0.03 0.01 0.06 0.01
200 0.01 0.00 0.03 0.01 0.06 0.01
5 0.00 0.00 0.01 0.02 0.02 0.04
ECB3Y 100 0.00 0.00 0.03 0.02 0.03 0.03
200 0.00 0.00 0.04 0.01 0.03 0.02
Table 9: Johansen cointegration tests of interest rates – inter-bank and bourse markets
Rank r=0 r=1 r=2 r=3 r=4 r=5 r=6 Cointegration rank
Trace 0 0 0 0.003 0.076 0.34 0.523 4
Max Eigenvalue 0 0 0.001 0.015 0.097 0.336 0.523 4
Notes:
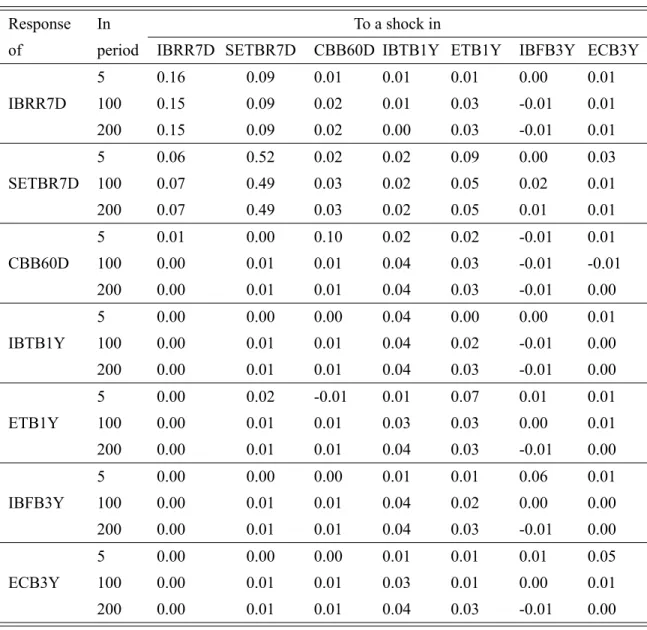
Table 11: Generalized impulse response of interest rates
– inter-bank and bourse market
Response In To a shock in
of period IBRR7D SETBR7D CBB60D IBTB1Y ETB1Y IBFB3Y ECB3Y
5 0.16 0.09 0.01 0.01 0.01 0.00 0.01
IBRR7D 100 0.15 0.09 0.02 0.01 0.03 -0.01 0.01 200 0.15 0.09 0.02 0.00 0.03 -0.01 0.01
5 0.06 0.52 0.02 0.02 0.09 0.00 0.03
SETBR7D 100 0.07 0.49 0.03 0.02 0.05 0.02 0.01 200 0.07 0.49 0.03 0.02 0.05 0.01 0.01
5 0.01 0.00 0.10 0.02 0.02 -0.01 0.01
CBB60D 100 0.00 0.01 0.01 0.04 0.03 -0.01 -0.01 200 0.00 0.01 0.01 0.04 0.03 -0.01 0.00
5 0.00 0.00 0.00 0.04 0.00 0.00 0.01
IBTB1Y 100 0.00 0.01 0.01 0.04 0.02 -0.01 0.00 200 0.00 0.01 0.01 0.04 0.03 -0.01 0.00
5 0.00 0.02 -0.01 0.01 0.07 0.01 0.01
ETB1Y 100 0.00 0.01 0.01 0.03 0.03 0.00 0.01
200 0.00 0.01 0.01 0.04 0.03 -0.01 0.00
5 0.00 0.00 0.00 0.01 0.01 0.06 0.01
IBFB3Y 100 0.00 0.01 0.01 0.04 0.02 0.00 0.00 200 0.00 0.01 0.01 0.04 0.03 -0.01 0.00
5 0.00 0.00 0.00 0.01 0.01 0.01 0.05
ECB3Y 100 0.00 0.01 0.01 0.03 0.01 0.00 0.01
References
Atesoglu H. Sonmez. 2003. Monetary Transmission: Federal Funds Rate and Prime
Rate. Journal of Post Keynesian Economics2,357-362.
Al Awad, Mouawiya and Barry K. Goodwin. 1998. Dynamic Linkages among Real
Interest Rates in International Capital Markets. Journal of International Money and Finance
17,881-907.
Bank for International Settlements Markets Committee,2008. Monetary Policy
Frame-works and Central Bank Market Operations, Document prepared by members of the
Mar-kets Committee.
Betancourt, Rocio, Vargas, Hernando and Norberto Rodriguez, 2008. Interest Rate
Pass-Through in Colombia: a Micro-Banking Perspective. Cuadernos de Economia 45,
29-58.
Bredin, Don, Fitzpatrick, Trevor and Gerard O'Reilly. 2003. Retail Interest Rate
Pass-Through: The Irish Experience. The Economic and Social Review33,223-246.
Burgstaller, Johann. 2005. Interest Rate Pass-through Estimates from Vector
Autore-gressive Models. Johannes Kepler University Economics working papers,2005-10.
Dai G., Liang F.T.,2006. An Empirical Study on Benchmark Interest Rate in China's
Financial Markets, International Economics4,3-11(in Chinese).
De Bondt, Gabe J.2005. Interest Rate Pass-through: Empirical Results for the Euro
Area. German Economic Review6,37-78.
Fan, Longzhen and Chu Zhang.2006. Beyond Segmentation: the Case of China's Repo
Markets. Journal of Banking & Finance31,939-954.
Fan, Longzhen and Chu Zhang. 2007. The Chinese Inter-bank Repo Market: An
Analysis of Term Premium. The Journal of Future Markets26,153-167.
Hall, Anthony D., Anderson, Heather M. and Clive W. J. Granger. 1992. A
Cointe-gration Analysis of Treasury Bill Yields. Review of Economics and Statistics74,116-126.
Heffernan, Shelagh A. 1997. Modelling British Interest Rate Adjustment: An Error
Hofmann, Boris and Paul Mizen. 2004. Interest Rate pass-through and Monetary
Transmission: Evidence from Individual Financial Institutions' Retail Rates. Economica
71,99-123.
Jesús, Crespo-Cuaresma, Balázs, Égert and Thomas Reininger. 2004. Interest Rate
Pass-Through in New EU Member States: The Case of the Czech Republic, Hungary and
Poland. William Davidson Institute Working Paper Number671.
Johansen, Soren and Katarina Juselius. 1990. Maximum Likelihood Estimation and
Inference on Cointegration with Application to the Demand for Money. Oxford Bulletin of Economics and Statistics52,169-210.
Nautz, Dieter and Christian J. Offermanns.2007. The Dynamic Relationship Between
the Euro Overnight Rate. International Journal of Finance & Economics,12(3),287-300.
Pesaran, H. Hashem and Yongcheol Shin. 1998. Generalized Impulse Response
Analysis in Linear Multivariate Models. Economics Letters58,17-29.
Rosen, Richard J.2002. What Goes up Must Come down? Asymmetries and
Persis-tence in Bank Deposit Rates. Journal of Financial Services Research21,173-193.
Sander, Harald and Stefanie Kleimeier. 2006. Convergence of Interest Rate
Pass-through in a Wider Euro Zone? Economic Systems30,405-423.
Uctum, Merih A.1999. European Integration and Asymmetry in the EMS. Journal of
International Money and Finance18,769-798.
Weth, Mark A.,2002. The pass-through from Market Interest Rates to Bank Lending
Rates in Germany. Economic Research Centre of the Deutsche Bundesbank Discussion