Published online October 10, 2014 (http://www.sciencepublishinggroup.com/j/ajhr) doi: 10.11648/j.ajhr.20140205.22
ISSN: 2330-8788 (Print); ISSN: 2330-8796 (Online)
Statistical modelling for risk factors of high blood
pressure in women
Muhammad Akbar Ali Shah
1, Shakila Khanum
2, Huma Qasim
31
Department of Statistics, The Islamia University of Bahawalpur, Pakistan
2
Department of Gynae & Obs, Quaid-E-Azam Medical College, Bahawalpur, Pakistan
3
Department of Statistics, The Islamia University of Bahawalpur, Pakistan
Email address:
akbar.ali@iub.edu.pk (M. A. A. Shah), anjum.sohail@live.com (S. Khanum), huma.qasim89@yahoo.com (H. Qasim)
To cite this article:
Muhammad Akbar Ali Shah, Shakila Khanum, Huma Qasim. Statistical Modelling for Risk Factors of High Blood Pressure in Women. American Journal of Health Research. Vol. 2, No. 5, 2014, pp. 298-302. doi: 10.11648/j.ajhr.20140205.22
Abstract: The main objective of the study is to find out the risk factors of high blood pressure among women. A cross
sectional survey was conducted at the public and private hospitals of Southern Punjab, Pakistan. Saturation sampling technique was utilized to gather information. SPSS version 21 was used for statistical analysis. Results showed that the risk factors of high blood pressure are age, income, employment status, physical inactivity, tea, fruit in taking habit, inherited hypertension, stress and sleeplessness.Keywords: Social Determinants, Risk Factors, Blood Pressure, Women, Hypertension
1. Introduction
High blood pressure is often known as ‘silent killer’. A person having systolic blood pressure of 140 mm Hg (millimeters of mercury) or higher and diastolic blood pressure of 90 mm Hg or higher is considered having high blood pressure. Increase in amount of blood in the circulatory system causes increase in blood pressure. Excessive use of salt and overweight are the major cause of high blood pressure. Blood pressure is also inherited from families. A person suffering from high blood pressure has the higher risk of getting stroke, kidney and heart diseases.
According to Qasim (2014) female patients falling in age group 36-48 years suffered mostly from stress that caused blood pressure in them. Main factors that affected blood pressure through stress were children marriages, family issues, inflation, low income and work load.
Vasan et al (2002) estimated the remaining life span possibility for hypertension in both male and female adult US citizens and found that 90% of respondents aging from 55 to 65 years were having high blood pressure. Women had higher chances for developing high blood pressure as compared to men.
Park and Kim (2013) obtained required data from women aged 35-55 year in Korea for analysis by using questionnaires. They applied logistic regression models and
concluded that use of OC and hypertension were directly related to each other. Korean women who used OC suffered from high blood pressure as compared to other women who never used OC.
Oliveira et al (2014) examined the causes of high blood pressure and cardiovascular among the inhabitant of a village in Brazil aged 18 years or more. They applied Univariate Poisson regression analysis with robust variance to obtain the required results. They findings showed that there were 29.5% respondents having high blood pressure and no statistically major variation was found between men and women.
Abed and Abu-Haddaf (2013) applied multiple logistic analysis on the data, that they collected through questionnaire based survey to predict the hypertension’s risk factors for residents of Gaza strip, Palestine. They inferred that hypertension was strongly linked with physical inactivity, education, obesity, low income and family history of high blood pressure. Their study also showed that women had high rate of hypertension as compared to men.
Dennison et al (2007) observed the causes of hypertension in peri-urban hypertensive South Africans. Smoking, alcohol usage and physical inactivity were the major things present in them. Over weight was one of the most influencing factor of hypertension. While in taking few antihypertensive medicines, younger age, better conformity to high blood pressure recommendations, higher educational level, less use of alcohol and private health care units were some of the factors of controlled blood pressure.
According to Shah et al (2014) hypertension, low consumption of fruits, stress, smoking education and physical inactivity causes cardiovascular disease. It was evident from their study that the major contributing factor to cardiovascular disease was high blood pressure.
2. Objective, Material and Methods
The main objective of the study is to find out the risk factors of high blood pressure among women. Hypertension is one of the pioneer diseases from which almost everyone is suffering. To find out the risk factors of high blood pressure this study was conducted. A cross sectional study was conducted at the public and private hospitals of Southern Punjab, Pakistan from women. Blood pressure level was measured at the spot by using clinical mercury manometer. Saturation sampling technique was
utilized to gather information. 120/80 is considered as normal blood pressure, where 120 correspond to systolic and 80 as diastolic. 140/90 or higher is referred as high blood pressure. Information regarding risk factors that contribute to high blood pressure was taken. Binary logistic regression was used to identify the risk factors that affect level of blood pressure. SPSS version 21 with 5% and 10% level of significance was used for statistical analysis.
Binary logistic regression model is as follows
where ‘ln’ is the natural logarithm, ‘p’ is the probability that Y for cases equals 1, p(y=1), ‘1-p’ is the probability that for Y cases equals 0, 1-p (Y=1). “p/(1-p)” is the odds and ln[p/1-p] is the log odds. ‘a’ is Y intercept, ‘b’ is regression coefficient and ‘X’ is predictor variable.
In this study binary logistic regression analysis was performed taking blood pressure as outcome variable and age, weight, locality, education, marital status, income, employment status, smoking, physical inactivity, tea, coffee, fruits in taking habit, inherited form family, stress and sleeplessness were taken as input variables.
To explore the effect of the above explained and explanatory variables the following model was used;
(equation 1)
Where a is y intercept which represents the average value of explained variable, when X is zero and b’s are the slope of regression line.
ln[p/1-p] = The log odds of blood pressure X1 = age (age in years)
X2 = weight (weights in kg)
X3 locality (area in which living either urban or rural)
X4 = education (whether educated or illiterate)
X5 = marital status (married or unmarried)
X6 = income (monthly income in rupees)
X7 = employment status (employed or unemployed)
X8 = smoking (smoke or not)
X9 = physical inactivity (physically active or not)
X10 = coffee (cups of coffee taken daily)
X11 = tea (cups of tea taken daily)
X12 = fruits in taking (take fruits regularly or not)
X13 = inherited (whether inherited form family or not)
X14 = stress (suffers from stress or not)
X15 = sleep (suffer sleeplessness or not)
3. Results
Table 1. Dependent Variable Encoding
Original Value Internal Value
no 0
yes 1
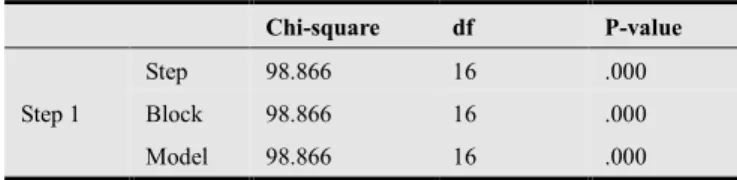
Table 2. Omnibus Tests of Model Coefficients
Chi-square df P-value
Step 1
Step 98.866 16 .000
Block 98.866 16 .000
Model 98.866 16 .000
Table 3. Model Summary
Step -2 Log likelihood Cox & Snell R Square Nagelkerke R Square
1 946.928a .116 .159
Table 4. Classification Table
Classification Table
Observed
Predicted
High Blood Pressure
Percentage Correct
no yes
Step 1 High Blood Pressure
no 99 187 34.6
yes 64 453 87.6
Overall Percentage 68.7
a. The cut value is .500
Table 5. Computation of Equation 1
B S.E. Wald df P-value Exp(B)
Step 1a
age .025 .007 13.306 1 .000 1.025
weight .003 .007 .265 1 .607 1.003
locality -.254 .189 1.818 1 .178 .775
education .282 .200 1.990 1 .158 1.326
Marital status .106 .236 .202 1 .653 1.112
income .000 .000 2.756 1 .097 1.000
Employment status .656 .215 9.288 1 .002 1.927
smoking -.312 .234 1.779 1 .182 .732
Physical inactivity -.233 .123 3.610 1 .047 .792
coffee .229 .227 1.025 1 .311 1.258
tea .302 .081 14.071 1 .000 1.353
Fruits intaking .424 .139 9.278 1 .002 1.529
inherited .273 .122 5.053 1 .025 1.314
stress .206 .120 2.929 1 .087 1.229
sleep -.613 .164 13.962 1 .000 .542
Constant -1.734 .681 6.490 1 .011 .177
4. Discussion
Table1shows that response variable (high blood pressure) is having two values, 0 indicating ‘no’, while 1 indicating ‘yes’. Omnibus test of model coefficients tell that is the model with these explanatory variables perform better predicting the outcome or not. Table 2 signifies that the model’s p-value is statistically significant. So the variables included in the model are better. Table 3 shows that R square value is 0.159, it can be said that 0.159 of variance in the data set is explained by the model which is approximately 16%. Model is adequately describing the fair amount of variation in the data. The overall percentage is the percentages of time predicted categories from the model are correct. It indicates how good the model is. Larger values give good results. Table 4 indicates the overall percentage is 68.7, which is quite larger.
In table 5 the values given in the column named ‘B’, they are for the logistic regression equation for predicting the dependent variable from the independent variable. They are in log-odds units. Wald statistic tells whether the b coefficient for the predictor is significantly different from zero. If the coefficient is significantly different it can be assumed that the predictor is making a significant contribution to the prediction of the outcome. Exp(B) is an indicator of change in odds resulting unit change in the predictor. They are the odd ratios for the predictor.
Interpretations of the effects are as follows
Age: The value of age intended to increase to 0.025 units. Explaining in terms of odd ratios exponential of 0.025 will
be 1.025. P-value shows that there is a relationship between age and high blood pressure as it is statistically significant.
Brady et al (2005) observed the impact of age and hypertensive status on several cognitive tests via multiple regression in 357 non-demented, community- settling older men (mean age= 67 years) whose hypertensive status was constant over 3 years and who had no medical co-morbidities. Age was negatively related with performance on all but 1 test. The findings suggest that uncontrolled hypertension produces specific cognitive deficits beyond those attributable to age alone.
Weight: The value of weight intended to increase to 0.003 units. Explaining in terms of odd ratios exponential of 0.003 will be 1.003. P-value shows that there is no relationship between weight and high blood pressure as it is not statistically significant.
Locality: The value of area intended to increase to -0.254 units. Explaining in terms of odd ratios exponential of -0.254 will be 0.775. P-value shows that there is no relationship between area and high blood pressure as it is not statistically significant.
Education: The value of education level intended to increase to 0.282 units. Explaining in terms of odd ratios exponential of 0.282 will be 1.236. P-value shows that there is no relationship between education and high blood pressure as it is not statistically significant.
According to Gulliford et al (2004) analysis increase in education and income had negative effect of systolic blood pressure in women.
exponential of 0.106 will be 1.112. P-value shows that there is no relationship between marital status and high blood pressure as it is not statistically significant.
Income: The value of income intended to increase to 0.000 units. Explaining in terms of odd ratios exponential of 0.000 will be 1.000. P-value shows that there is a relationship between income and high blood pressure as it is statistically significant at 1 % level of significance.
Employment status: The value of employment status intended to increase to 0.656 units. Explaining in terms of odd ratios exponential of 0.656 will be 1.927. P-value shows that there is a relationship between employment status and high blood pressure as it is statistically significant.
Rose et al (1999) applied logistic regression model on the data they collected through a survey, to check the association between hypertension and level of employment among women. They concluded that employment did not appear to increase the risk of hypertension in women. But our study shows that employment status and hypertension are associated with each other.
Smoking: The value of smoking intended to increase to -0.312 units. Explaining in terms of odd ratios exponential of -0.312 will be 0.732. P-value shows that there is no relationship between smoking and high blood pressure as it is not statistically significant.
Physical Inactivity: The value of physical inactivity intended to increase to 0.233 units. Explaining in terms of odd ratios exponential of 0.233 will be 0.792. P-value shows that there is a relationship between physical inactivity and high blood pressure as it is statistically significant.
Semlitsch et al (2013) inferred that decrease in blood pressure was shown to be a result of being physically active.
Coffee: The value of coffee intended to increase to 0.229 units. Explaining in terms of odd ratios exponential of 0.229 will be 1.258. P-value shows that there is no relationship between coffee and high blood pressure as it is not statistically significant.
Tea: The value of tea intended to increase to 0.302 units. Explaining in terms of odd ratios exponential of 0.302 will be 1.353. P-value shows that there is a relationship between tea and high blood pressure as it is statistically significant.
Fruits In taking: The value of fruits in taking habit intended to increase to 0.424 units. Explaining in terms of odd ratios exponential of 0.424 will be 1.529. P-value shows that there is a relationship between fruits in taking habit and high blood pressure as it is statistically significant.
Inherited: The value of inherited hypertension intended to increase to 0.273 units. Explaining in terms of odd ratios exponential of 0.273 will be 1.341. P-value shows that there is relationship between inherited hypertension and high blood pressure as it is statistically significant.
Stress: The value of stress intended to increase to 0.206 units. Explaining in terms of odd ratios exponential of 0.206 will be 1.229. P-value shows that there is relationship between stress and high blood pressure as it is statistically significant at 1 % level of significance.
Sleep: The value of sleep intended to increase to -0.613 units. Explaining in terms of odd ratios exponential of -0.613 will be 0.542. P-value shows that there is relationship between sleep and high blood pressure as it is statistically significant.
The value of age, income, employment status, physical inactivity, tea, fruit in taking habit, inherited hypertension, stress and sleeplessness are statistically significant, showing that these predictors have an impact on the model, while weight, locality, education, marital status, coffee, and smoking have no impact on the model because they are not statistically significant. So from table 5 it is concluded that the risk factors of high blood pressure are age, income, employment status, physical inactivity, tea, fruit in taking habit, inherited hypertension, stress and sleeplessness.
5. Conclusions
It can be concluded from the present study that the foremost cause of high blood pressure is age. The major contributing factors for high blood pressure are physical inactivity, caffeine, age, dietary plans and high blood pressure in family. People suffering from high blood pressure may get diabetes, heart disease, kidney disease or stroke. High blood pressure causes sleeplessness in patients. High blood pressure can be controlled or reduced by making one physically active, quitting smoking habits, take proper meal and reducing weight, taking minimum amount of caffeine. Proper medication also helps the person to reduce hypertension.
References
[1] Qasim, H. (2014) Socioeconomic Causes of Diseases: A Case Study of Southern Punjab, M. Phil Thesis, Department of Statistics, The Islamia University of Pakistan. And reference therein.
[2] Vasan, R. et al (2002) Residual Lifetime Risk for Developing Hypertension in Middle-aged Women and Men The Framingham Heart Study, American Medical Association JAMA, Volume 287, No. 8, pp 1003-1010. [3] Park, H. and Kim, K. (2013) Associations Between Oral
Contraceptive Use and Risks of Hypertension and Prehypertension in A Cross-Sectional Study of Korean Women, BMC Women’s Health, Volume 13, No. 39, pp1-7. [4] Oliveira, G. et al (2014) Prevalence of Hypertension and
Associated Factors in an Indigenous Community of Central Brazil: A Population-Based Study, PLOS One, Volume 9, Issue 1, pp 1-6.
[5] Abed, Y. and Abu-Haddaf, S. (2013) Risk Factors of Hypertension at UNRWA Primary Health Care Centers in Gaza Governorates, International Scholarly Research Notices Epidemiology, Volume 2013, pp 1-9.
[7] Dennison, C. et al (2007) Determinants of Hypertension Care and Control Among Peri-Urban Black South Africans: The Hihi Study, Ethnicity and Disease, Volume 17, pp 484-491.
[8] Shah, M. et al (2014) Statistical Analysis of Socio-Economic Causes of Cardiovascular Disease, International Journal of Research, Volume 1, Issue 5, ISSN 2348-6848, pp 223-230.
[9] Brady, C. et al (2005) Effects of Age and Hypertension Status on Cognition: The Veterans Affairs Normative Aging Study, Neuropsychology, Volume 19, No. 6, pp 770-777.
[10] Gulliford, M. et al (2004) Socioeconomic Inequality in Blood Pressure and its Determinants: Cross Sectional data from Trinidad and Tobago, Journal of Human Hypertension, Volume 18, pp 61-70.
[11] Rose, K. et al (1999) The Association Between Extent of Employment and Hypertension Among Women Participants of Second National Health and Nutrition Survey, Women Health, Volume 29, No. 3, pp 13-29.