*Correspondence to Author:
A. OLOULADE
Electrotechnic, Telecommunications and Informatics Laboratory (LETIA) University of Abomey-Calavi Coto-nou, Benin
How to cite this article:
A. OLOULADE, A. MOUKENGUE IMANO, A. VIANNOU, H. TAMA-DAHO. Optimization of the number, size and placement of D-STATCOM in radial distribution network using Ant Colony Algorithm. American Journal of Engineering Research and Reviews, 2018, 1:12
eSciPub LLC, Houston, TX USA. Website: http://escipub.com/
A. OLOULADE et al., AJOERR, 2018, 1:12
American Journal of Engineering Research and Reviews
(DOI:10.28933/AJOERR)
Research Article AJOERR (2018) 1:12
Optimization of the number, size and placement of D-STATCOM in
radial distribution network using Ant Colony Algorithm
This paper investigate an approach based on Ant Colony Opti-mization to identify optimal size, number, cost and placement of D-STATCOMs in radial distribution systems. Objective functions integrating power loss, voltage deviation and cost minimizations are solved by Ant Colony algorithm developed in MATLAB. This algorithm is tested on the IEEE 33- bus system and on a real distribution network of SBEE (Beninese Society of Electrical En-ergy). As results, it is observed that losses are reduced to 22.42 percent for IEEE 33-bus system with five D- STATCOMs and global installation and operating estimated cost of 3546762.35 dollars in first, and then, losses are reduced to 61.63 percent with four D-STATCOMs and cost of 2493146.29 dollars for a real distribution system of SBEE.
Keywords: D-STATCOM, optimal placement, radial network, ant colony optimization, power loss
A. OLOULADE1, A. MOUKENGUE IMANO2, A. VIANNOU3, H. TAMADAHO 1
1Electrotechnic, Telecommunications and Informatics Laboratory (LETIA) University of
Abomey-Calavi Cotonou, Benin;2 Electronic, Electrotechnic, Automatic and Telecommunications Laboratory
(LEEAT) University of Douala Douala, Cameroon;3Ecole Doctorale, Science de l’ingénieur
University of Abomey-Calavi Cotonou, Benin
ABSTRACT
INTRODUCTION
The economic development of a country depends on the availability of energy and its consumption.
In distribution systems, energy demand is continuously growing with the increase in population and changing life style in some developing countries. The energy demand, in recent years, makes serious problems related to the reliability, the technical and economic security of electrical systems. Indeed, several distribution transformers are not installed at the center of gravity of the loads and most of the lines are very overloaded and very long. For the most part, the improvement of these distribution networks require heavy investments.
As result for the operation of these networks, it is noted excessive power losses that lead to a poor quality of service offered to customers and recurring equipment failures. Indeed, some studies have recently shown that losses in some networks are close to 13 to 20% [1]. The overall losses is technical and commercial losses and represent indicators of profitability and quality of the distribution networks. However, a loss of 1% in a distribution network increases the cost of the company by 2% in order to cover the costs incurred [2].
Technical losses are the resistive losses in the windings of the transformers and in the lines. They are inherent to the operation of networks. They can therefore be reduced but can not be eliminated. As for commercial losses, they consist of fraud on electricity meter, illicit connections, billing errors.
The Beninese Society of Electrical Energy (SBEE), operator of Benin's national electricity system, has in recent years opt for the generalization of prepayment metering systems in order to reduce non-technical losses and thus improve its cash-flow. In the implementation of this directive, it was very early faced with difficulties related to the catastrophic weakening of the voltage in some areas which is not supported by these new electronic meters.
These electricity meters would reduce non-technical losses normally and increase the financial profitability of the company.
The reduction of losses in electrical systems represents an economic interest for the electric power companies and contributes to the improvement of the voltage profiles.
The conventional means of voltage regulation in distribution networks, capacitors, regulators in charge of power transformers of source substations are nowadays unreliability to cope with the growing constraints of distribution networks hence the need to resort to solutions that optimize the operation of energy systems such as the use of devices based on power electronics components known as FACTS.
D-STATCOM, a component of this family of FACTS is the most widely used for efficiently reducing the line power losses, correcting power factor and improving voltage profile of distribution systems especially [3]. The D-STATCOM (Distributed-D-STATCOM) is a shunt connected voltage source converter which have more technical features such as fast response time, small footprint, high operational flexibility and excellent dynamic characteristics to meet various operating conditions.
However, its inappropriate placement for a node and / or inadequate sizing can limit its technical performance and more weaken the operation of the network in which it would be installed.
The installation and operation cost of D-STATCOM can also limit its application in networks [3].
For a quasi-weakened network in which a D-STATCOM is installed and which during its operation is to be defective, this network will then fall into a catastrophic situation hence the need to provide for redundancies in order to ensure the guarantee of maintaining voltage parofile in the contractual ranges and while seeking an optimality of the cost.
the question of the number of D- STATCOMs in distribution networks.
Indeed, in [4], an analytical method has been developed for determining the optimum position of a D-STATCOM in a distribution network. The proposed method was tested in a 33 bus radial distribution system.
Jain et al. [5] proposed a voltage sensitivity-based method for voltage profile and losses improvements by a D- ST
Tolabi et al. [6] applied fuzzy-based ant colony optimization (ACO) for optimal allocation of photovoltaic arrays and D-STATCOM.ATCOM.
In [7], Farhoodnea et al. used firefly algorithm to identify a D-STATCOM optimum position.
In [8], a hybrid of genetic algorithm and ant colony optimization algorithm were designed for optimal allocation of STATCOM's. Three D-STATCOMs was applied to IEEE 30-bus system.
In this paper an effective algorithm based on ant colony behavior is developped in MATLAB for giving optimal number, size and placement of D-STATCOMs in radial distribution networks. The real 41-bus system of Togba of SBEE is taken as a test case in order to illustrate the proposed method.
II. OPERATING ISSUES IN DISTRIBUTION NETWORKS OF SBEE
The operation of the SBEE's distribution networks generates technical losses exceeding the operating network limits and which are an origin of the poor quality of voltage profiles. Indeed, these losses are due to overloads on
distribution transformers, imbalances, the
inadequacy of some line sections compared to the transit of load. Several customers connected to the SBEE's distribution system have concerns about the quality of the voltage served. Investments have not kept pace with population growth to the point where the limits of existing networks constraints were violate. Several household appliances are damaged by the drop in voltage. The investments to be made to renew certain old equipments of these installations require heavy budget means requiring the
support of financial partners. Given too long delays in implementing these assistance, it is necessary to resort to other innovative solutions for electrical systems optimization.
III. PROBLEM FORMULATION
The optimized criteria in this paper are the active losses in the networks, voltage deviations and cost of D-STATCOM under two constraints of voltage safety and thermal line safety.
A. Objective functions
Power losses
, are resistance and reactance of th
branch, and are power losses of th
branch, is ith node voltage, is number of
overall branches.
Voltage deviation
and are the voltage limits of
nodes, is ith node voltage, N is number of
overall nodes, is ith specified node voltage.
Installation and operating cost
The installation and operating cost of D-STATCOM in a distribution network is a very important factor and could limit the operators in their choice. This criterion includes the cost of
installation, operation and the annual
maintenance cost.
: the annual maintenance cost (USD)
: the annual percentage increment of the maintenance cost (%)
: the lifetime of the D-STATCOM to be installed (years)
: the per unit cost of the reactive power (USD / kVar)
: the size of the reactive power of D-STATCOM to be installed (kVar)
B. Constraints
Safety constraint on node voltages
While safeguarding the distribution system, all voltages must be maintained in such a range that the rate of weak nodes is equal to zero. Indeed, the RUVMN [9] is defined as the rate of the weak nodes in the network, the rate of the nodes not having their voltage in the range ± 5% of the nominal voltage. Explicitly, the RUVMN at the ith iteration is written :
: the number of weak nodes at ith iteration
: the overall nodes of network
This equality constraint is defined as :
Current constraint
: the current flowing through the ith branch
: the maximum allowable current of the ith branch.
The losses minization in distribution network require load flow which is an important and basic method for analysis, operation and planning
studies of any power system in a steady-state condition.
IV. RADIAL DISTRIBUTION SYSTEM LOAD FLOW
The load flow is an important tool for planning energy system. It shows stats of voltages, currents and losses, and if they are in normative ranges for expected future loads. The
information provided by the load flow
computation is the active and reactive power losses, voltage amplitude and their phases. Power flow equations are nonlinear and classical resolution methods, including Gauss Seidel, Newton Raphson and fast decoupled method that converge easily for transmission networks are not easy for radial distribution networks due to high R/X ratio for distribution networks.
A. Backward and Forward Sweep load flow
The backward / forward sweep is one of load flow computation method which converges very well for radial distribution networks. It is based on the laws of ohm and Kirchhoff and can be considered from the family of iterative methods of power flow. It requires the recognition of the network by the construction of a configuration matrix and then the application of a two-step process consisting of backward sweep to compute the powers in all the branches, the currents and the losses then a forward sweep to compute voltage profiles of network. Once the new values of voltages of all nodes are computed, the convergence criterion is checked. The convergence criterion is, in successive iterations, the maximum difference in voltage magnitudes.
B. Modeling of load flow
The impedance of the whole branch of the electrical network has for expression :
The apparent power of the load connected to ith node is :
: active and reactive powers at the beginning of the outgoing branch of the ith branch
: active and reactive powers at the beginning of the ith branch
is the conjugate of
: active and reactive power losses
The currents in the different branches being determined, node voltages are computing by :
is the node voltage of the incoming node of the ith branch
Finally, the convergence criterion is :
C. Test on real 41-bus system of Togba of SBEE
The single line diagram of Togba of SBEE, 15kV, 41-bus, has a 19 MVA - source substation and is shown in Figure 2.
This distribution system is applied to the load flow program and results are shown in Figure 3.
It can be seen that the lowest voltage is 0.8498 p.u at node 37 and the maximum voltage is 0.9999 p.u at node 2. The active and reactive losses are respectively 403.3832kW and 355.4047kVar.
This HVA network is out of balance because there are 24 nodes whose voltages are not in the normative ranges of 0.95 p.u to 1.05 p.u as shown in Figure 3.
Customers connected to distribution
V. OPTIMAL PLACEMENT OF MULTIPLE D-STACOMS IN DISTRIBUTION NETWORK
The optimal placement of a D-STATCOM in a distribution network enhance performance of this network. Indeed, properly placed on a node, it reduces harmonics, compensates voltage fluctuations and helps to reduce losses.
However, sometimes, only one D-STATCOM can not be effective for a network whose almost all the node voltages are out of normative range. Then, the performance of system will become more damaged if a damage occurred on the only
one installed. Hence, it would be interesting to proceed to the optimal placement of multiple D-STATCOMs in the distribution networks.
A. Steady-state modeling of D – STATCOM D-STATCOM is a shunt device which has the capability to inject or absorb reactive current. Its use on the distribution networks is more interesting because its power is proportional to the voltage rather than the square of the voltage as for a capacitor [9]. The model of D-STACOM then consists of a DC voltage source (capacitor), an AC voltage converter and a network coupling transformer as shown in Figure 4.
The Figure 4 shows an elementary network of two nodes of a distribution network on which the D-STATCOM is installed at the jth node for voltage profile regulation.
The voltage at this node j changes from to
when the D-STATCOM is set, and the phase diagram of system is shown in Figure 5.
with et
which are respectively the current injected by the D-STATCOM and the voltage at the node j after compensation;
, the voltage at the node i, respectively the current transit of branches after
placement of D-STATCOM.
are obtained by power flow computation.
Using the notations below :
Variables :
Then, equations (17) and (18) become respectively equations (19) and (20) :
We can obtain respectively in equations (19) and (20) :
By equating equations (21) and (22) and
considering , we can observe,
after an arrangement, the
following :
Where,
Thus,
After testing network balancing conditions, value
of x is :
Then, is defined from equations
(21) or (22). After determining and in
Finally, injected reactive power by D-STATCOM can be written as :
where is the conjugate of complex current
of D-STATCOM.
The D-STATCOM is modeled such that the amplitude of the voltage of the node where it is installed is assumed to 1 p.u. The phase of this node is compute by equation (26), the injected current is computed by equation (21) and the reactive power injected is determined by equation (29).
B. Ant Colony Algorithm
Ants are social insects whose physical or behavioral characteristics have long fascinated humans. The mode of communication, the most prominent in ants is their use of chemicals called pheromones. Pheromones are hydrocarbon mixtures secreted by ants, which are able to deposit their odors on their way and constitute an attractive trace for other ants. Pheromones, depending on their composition, have the property of evaporating more or less quickly with time and a trace that is not maintained is brought to disappear. In case of alarm, pheromones can mobilize a large number of ants to trigger the nest defense.
The ant algorithm is a probabilistic technique that solves difficult optimization problems. It can be reduced in search of the shortest path through graphs based on the behavior of the ants which in their displacement mark the way with pheromones [10]. The shortest path is the most marked by pheromones. The first algorithm was developed in 1991 and then many variants of this principle have been developed such as Max Min Ant System [11].
C. Adaptation of Ant Colony Algorithm to the problem of D-STATCOM placement in electrical network
Ant colony optimization is a metaheuristic method that is inspired by the synergy observed in real ants and that is able to select the shortest way to get from the nest to a food source through the deposition and tracking of pheromones. This optimization problem is put in the form of a graph G such that G = (n, C) where n is the set of nodes and C the set of paths given by active losses in the branches. However, the paths connecting two sets of nodes not successives are not eligible because they can’t present losses. High values are assigned to these ineligible paths to get them out of the basic potential solutions. In practice, ant colony algorithms have been implemented on complete graphs, i.e. where each node is connected to all other nodes. This avoids dead ends in the construction of the cycle. If the configuration of the problem requires that some arcs be avoided, rather than eliminate them, as in our example, it is enough to assign them a very large length, so that the ants borrowing them are disadvantaged. From the practical point of view, at each arc (i, j), we
associate a quantity of pheromones noted and we define the probability that the ant k placed in node i choose the node j.
visibility of ant :
pheromone and visibility influence
parameters After a complete turn ( ), each ant
leaves amount of pheromone on its
entire path, which depends on the quality of the solution found.
Return the best solution that is the previous best solution (CBPS)
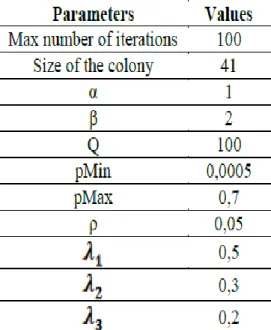
Table 1 presents the main parameters used in the ant algorithm developed for the multiple placement problem of D-STATCOMs.
VI. SIMULATION AND RESULTS
The developed Ant algorithm is tested on IEEE 33-bus radial distribution system, 12.6kV, 3.72 MW and 2.3 MVars. Its bus data and line data is given in [1].
Table 3 shows the results obtained after placement of multiple D-STATCOMs. In first, it is observed on the 33-bus system that the D-STATCOMs are positioned at nodes 32, 30, 14, 16 and 18 with respective powers of 805.67kVAR - 3.34MVAR - 1.002MVAR - 808.04kVAR - 340kVAR and the losses have become 110.95kW with an optimal cost of 3546762.35 dollars over 20 years.
From Figure 6, it is observed that all node voltages are significantly enhanced and losses are reduced by 61.63%.
For a 20-year operation, the optimal investment cost is estimated at 2493146.29 dollars. The placement of multiple D-STATCOMs in a distribution network has the advantage of securing the node voltages in the standards in case of a damage on any of the D-STATCOMs
positioned. This redundant arrangement
normally prevents the network from falling back into a disaster state in the event of any anomaly occurring on one of the installed devices.
From the simulation of the damages that could occur on the D-STATCOMs, it is noted as shown in Table 4 that, when the D-STATCOM of the node 12 is disconnected from the network, active losses become 156.74kW, a proportion of degradation of 1.27%. On the other hand, when the D-STATCOM at position 36 is disconnected,
where the D-STATCOMs at nodes 14, 12 and 38 are in the network and connected, the losses amount to 180kW, i.e. a proportion of 16.3% of degradation. Position 36 is a strategic node of the network. A possible damage of D-STATCOM of the position 36 destabilizes the network but does not bring it back to its initial state where 24 nodes were weak, out of normative ranges. The multiple placement of D-STATCOMs limits the
critical degradation of the technical
performances in case of possible D-STATCOM damage. Multiple placement of D-STATCOM limits critical damage in the event of a possible D-STATCOM failure.
VII. CONCLUSION
losses and improving the voltage profiles. With the multiple placement of D-STATCOMs in distribution networks, the security and the stability of node voltages are almost assured
around the strategic node of the network and turns out to be in the case of the network 41-bus of Togba, the node 36.
REFERENCES
[1] K. Nirmala et N. P. C. Rao, « Incorporation of Dstatcom in Radial Distribution Systems », Int. J. Comput. Eng. Res. IJCER, 2013.
[3] K. Somsai et T. Kulworawanichpong, « Cost estimation for reactive power compensation in distribution power system by using D-STATCOM », 2013.
[4] S. S. Hussain et M. Subbaramiah, « An analytical approach for optimal location of DSTATCOM in radial distribution system », in Energy Efficient Technologies for Sustainability (ICEETS), 2013 International Conference on, 2013, p. 1365–1369.
[5] A. Jain, A. R. Gupta, et A. Kumar, « An efficient method for D-STATCOM placement in radial distribution system », in 2014 IEEE 6th India International Conference on Power Electronics (IICPE), 2014, p. 1-6.
[6] H. B. Tolabi, M. H. Ali, et M. Rizwan, « Simultaneous reconfiguration, optimal placement of DSTATCOM, and photovoltaic array in a distribution system based on fuzzy-ACO approach », IEEE Trans. Sustain. Energy, vol. 6, no 1, p. 210–218, 2015.
[7] M. Farhoodnea, A. Mohamed, H. Shareef, et H. Zayandehroodi, « Optimum D-STATCOM placement using firefly algorithm for power quality enhancement », in Power Engineering and Optimization Conference (PEOCO), 2013 IEEE 7th International, 2013, p. 98– 102.
[8] A. Bagherinasab, M. Zadehbagheri, S. A. Khalid, M. Gandomkar, et N. A. Azli, « Optimal Placement of D-STATCOM Using Hybrid Genetic and Ant Colony Algorithm to Losses Reduction », Int. J. Appl. Power Eng. IJAPE, vol. 2, no 2, p. 53-60, août 2013.
[9] B. B. Sahoo et S. K. (Guide) Jain, « Analysis of Distribution Systems with DSTATCOM », Thesis, 2010.
[10] P. Siarry, Métaheuristiques. Editions Eyrolles, 2014.