*Correspondence to Author:
Shailesh Kumar
Amity Institute of Biotechnology, Amity University Rajasthan, Jaipur, India, 303007. +91-9024077116
How to cite this article:
Shailesh Kumar, Sumit Govil, and Vikram Kumar. Comparison of Se-quence with Cluster based analysis for molecular properties and com-position of Glutathione Peroxidase family proteins. American Journal of Biotechnology and Bioinformatics,
2018; 2:6 .
eSciPub LLC, Houston, TX USA. Website: http://escipub.com/
Shailesh Kumar et al., AJBB, 2018; 2:6
American Journal of Biotechnology and Bioinformatics
(ISSN:2575-999X)
Research Article AJBB (2018) 2:6
Comparison of Sequence with Cluster based analysis for molecular
properties and composition of Glutathione Peroxidase family
proteins
Glutathione peroxidase (GPx) is very important protein helps in eradication of exogenous materials from the body of human reported to do the same work in other organisms. The seleno-cysteine amino acid contributes to the structure of this protein. Here a comparative study on sequence based methods and property based methods is carried out on all curated sequences of Glutathione Peroxidase for Human. Swiss Prot database was explored and only 65 protein of GPx family was obtained out of which 18 curated sequences were used for further analysis. Se-quence based Distance method of Multiple SeSe-quence Analysis is used for finding similar groups. Then all 18 sequences were studied for number of cleavage sites analysis followed by hierar-chical clustering which represents cleavage sites based similar
groups. Further, these sequences were computed to find amino
acid composition and various properties like theoretical PI, In-stability Index, Alipahtic Index and Hydropathy, followed by Hier-archical clustering. The interesting fact obtained in this study is that on comparison with the cleavage sites based clustering and amino acid composition with properties based clustering is hav-ing similar type of groups. These similar groups are havhav-ing no relation sequence based methods groups. Hence, we conclude
that for finding functional similarity between various sequences
clustering of property based methods are more reliable as com-pared to sequence based methods phylogenetic methods.
Keywords: Glutathione Peroxidase; computational analysis;
hi-erarchical clustering; curated; hydropathy.
Shailesh Kumar1*, Sumit Govil2, Vikram Kumar1
1Amity Institute of Biotechnology, Amity University Rajasthan, Jaipur, India, 303007. 2School of Life Sciences, Jaipur National University, Jaipur, Rajasthan, India 302025.
ABSTRACT
Introduction:
Glutathione peroxidase (GPx) is very important protein for maintaining the redox balance of the body [1]. GPx protein is a family of multiple isozymes functionally responsible for Protection of hemoglobin in erythrocytes from oxidative breakdown in humans [2]. These isozymes also
catalyzes the reduction of H2O2 or organic
hydro peroxides (exogenous as well as
endogenous) to water or corresponding
alcohols by reducing glutathione which works
as an electron donor [3]. Glutathione
peroxidases are the enzymes that are responsible for eradication of free radicals from human body. They not only help in the removal of endogenous free radicals only they are also
working for exogenous free radical
eradications. Various studies on number of diseases represent about active or passive involvement GPx family of proteins. The altered activity of GPx proteins in human body is reported to cause various diseases like hypertension, cardiac dysfunction, and cancer which are very common and fatal as well. Apart from this if the gene ontology of this class of enzymes are studied it was observed that this enzyme having wide range of activity like, UV protection activity [4], heart contraction [5], regulation of apoptotic genes like Bax and Bcl-2 [6]. The Metazoan study reveals that some GPx’s have a selenium-dependent glutathione peroxidase activity, with selenocysteine being encoded by an opal codon TGA. In our previous in-silico study on Gpx family of enzymes reveals that there are significant differences in the sequence composition and structure of all eight variants of GPx whereas the function of all the variants is same [7]. This creates a question in our mind that what are the various physiochemical characteristics of these enzymes that makes them so specific and how they are different from each other. In current world, number of computational tools has been developed for making predictions with great accuracy regarding the identification and structure prediction of proteins. In this study we
used computational tools and online servers for
protein sequence analysis and their
characterization. The physicochemical and the structural properties of this family of proteins are also well understood with the use of computational tools. Here, in this study the sequence based and property based methods are used to compare the difference and similarity of all protein of GPx family. The major focus was to find that, on which method one should rely to find similarity in proteins sequence and their evolutionary relation i.e. sequence based method or properties based methods.
Materials and Methods:
Glutathione Peroxidase sequences
Glutathione Peroxidase sequences were
retrieved from the manually curated public protein database Swiss-Prot [8]. From Swiss prot we retrieved 65 Glutathione Peroxidase
sequences of Homo sapiens were retrieved.
From total 65 sequences, only reviewed 19 sequences are found are listed in Table 1. One sequence IARS is not used for further analysis to avoid variation in results, thus, only 18 unique GPx family proteins are used for analysis. The sequences are retrieved in FASTA format. The average length of Gluathione Peroxidase is found to be of 251 AA. The statistics used for a protein sequence such as number of amino acid, sequence length, and the physicochemical properties of a proteins such as molecular weight, atomic composition, extinction coefficient, GRAVY, aliphatic index, instability index, etc. The amino
acid sequences provides most of the
information required for determining and
characterizing the molecule’s function, physical
and chemical properties. Sequence analysis
and physicochemical characterization of
proteins using bio computation tools have been done by many researchers and reported.
Entropy of GPx sequences:
of the Sequence was calculated to check the randomness in the sequence [9][10]. Entropy is defined as sum of product of individual probabilities and their log for all events.
𝐻(𝑋) = ∑ 𝑃
𝑖
(𝑥𝑖)𝐼(𝑥𝑖) = − ∑ 𝑃(𝑥𝑖) log𝑏𝑃(𝑥𝑖)
𝑖
Sequence analysis:
Basic phylogenetics methods were used for sequence comparison i.e. multiple sequence alignment, distance calculation and tree preparation on the basis of distance. Windows platform based MEGA6.6 [11] software is used
for sequence comparison and distance
calculation. This software is providing facility of various genomic and proteomic analysis.
Results and Discussion:
Entropy of information:
The randomness found in GPx sequences is similar in all proteins ranging from 4.21978 to 3.64285 as shown in Table 1. The average entropy of the sequences is 4.08548, which represents that there no such variation in the information content in the sequences. The curve in Figure 1 shows stability in the information content of sequences i.e. the sequences used in the study are stable and representing to common specific category.
Table 1: SwissProt/Uniprot retrieved sequences of Glutathione Peroxidase
S.N. Gene names Entry Organism Length Shannon entropy H(X)
1. GPX1 P07203 Human 203 4.08433
2. GPX2 P18283 Human 190 4.17454
3. GPX3 P22352 Human 226 4.17409
4. GPX4 P36969 Human 197 4.21978
5. GPX5 O75715 Human 221 4.14397
6. GPX6 P59796 Human 221 4.1005
7. GPX7 Q96SL4 Human 187 4.12986
8. GPX8 Q8TED1 Human 209 4.02618
9. GSTK1 Q9Y2Q3 Human 226 4.11617
10. GSTT1 P30711 Human 240 4.05993
11. GSTZ1 O43708 Human 216 4.12569
12. HPGDS O60760 Human 199 4.18639
13. IARS P41252 Human 1262 4.17552
14. LTC4S Q16873 Human 150 3.64285
15. MGST1 P10620 Human 155 4.04231
16. MGST2 Q99735 Human 147 4.03208
17. MGST3 O14880 Human 152 4.05916
18. PRDX6 P30041 Human 224 4.0519
SOD1 P00441 Human 154 3.95354
Sequence Analysis:
For protein sequence analysis the data is rectified for outliers hence, protein id P41252 in Table 1 is not used for further Sequence and
stability in the analysis this sequence is marked as outlier in the data set. A distance matrix is calculated on the basis of positional sequence differences between all pairs of sequences. By the help of this distance matrix a neighbor joining approaches [12] was used to find
phylogenic relation among all GPx proteins. The tree in Figure 2(B) shows various groups of proteins. In common practice for finding functional relation between various proteins
researcher use a phylogenetics based
methods.
Figure 1: Entropy of GPx Family Proteins
A B
Figure 2: Distance Matrix (A) and Phylogenetics Tree (B) after MSA of 18 GPx Sequences.
Protein Digestion:
The number of proteolytic cleavages sites by various proteolytic enzymes is calculated by the
ExPasy’s peptide cutter tool [13] for all the sequences of glutathione peroxidase. The number of
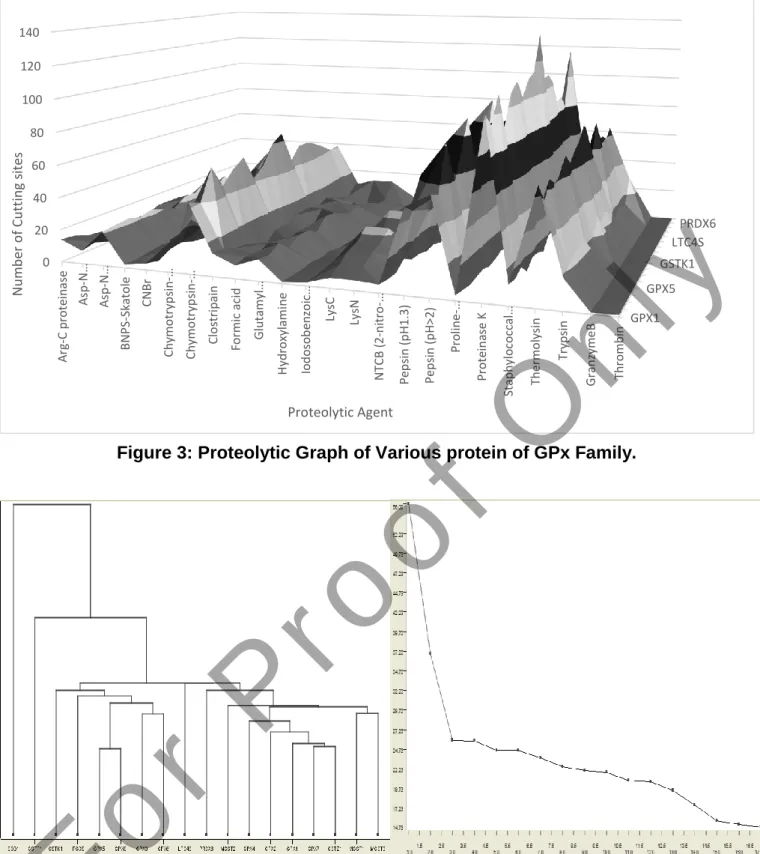
fragments produced by each enzyme is tabulated in Table 2. The graph in Figure 3 represents the similar pattern of fragmentation by proteolytic enzymes. These fragments are then subject to
hierarchical clustering [14] to find group of similarly fragmented proteins. The cluster tree
represented in Figure 4(A) shows groups by using proteolytic cleavage site information. A similar patter of cleavage is reported in the various GPx proteins. Figure 4(B) shows scores found in clustering each dot in the graph presents a node and its distance in the tree.
3.3 3.4 3.5 3.6 3.7 3.8 3.9 4 4.1 4.2
4.3 Entropy
Table 2: Number of proteolytic sites available on Glutathione peroxidases family proteins.
GPx
Type
Enzyme GPX1 GPX3 GPX2 GPX4 GPX5 GPX6 GPX7 GPX8 GSTK
1
GSTT
1
GSTZ
1
HPGDS LT
C
4
S
MG
ST1
MG
ST2
MG
ST3
PR
DX6
SOD1
Arg-C
proteinase 14 10 13 9 5 2 9 9 12 12 12 10 13 11 8 6 12 4
Asp-N
endopeptidase 8 7 10 11 9 6 8 6 7 15 10 15 1 8 2 1 16 11
Asp-N endopeptidase + N-terminal Glu
21 23 22 21 23 20 18 23 23 28 20 27 6 13 7 6 32 21
BNPS-Skatole 2 3 2 4 3 3 5 3 5 5 2 6 3 0 3 2 3 1
CNBr 4 6 2 7 4 3 2 1 11 5 6 6 1 7 2 3 4 1
Chymotrypsin -high specificity
16 26 20 18 24 29 20 22 14 20 13 21 19 19 21 17 16 5
Chymotrypsin -low specificity
43 59 40 45 53 58 42 48 60 65 43 52 52 49 45 40 41 23
Clostripain 14 10 13 9 5 2 9 9 12 12 12 10 13 11 8 6 12 4
Formic acid 8 7 10 11 9 6 8 6 7 15 10 15 1 8 2 1 16 11
Glutamyl
endopeptidase 13 16 12 10 14 14 10 17 16 13 10 12 5 5 5 5 16 10
Hydroxylamin
e 1 1 1 2 1 2 0 0 0 0 0 0 0 0 1 0 1
Iodosobenzoic
acid 2 3 2 4 3 3 5 3 5 5 2 6 3 0 3 2 3 1
LysC
6 15 10 17 23 16 11 24 13 16 12 12 1 7 7 8 18 11
LysN
6 15 10 17 23 16 11 24 13 16 12 12 1 7 7 8 18 11
NTCB
(2- nitro-5-thiocyanobenz oic acid)
5 4 4 9 5 5 3 4 2 3 5 3 2 1 3 4 2 4
Pepsin
(pH1.3) 50 63 45 38 53 73 43 57 53 77 41 50 63 43 52 39 47 18
Pepsin (pH>2) 58 82 55 52 70 90 61 69 67 94 55 73 77 58 72 54 56 19
Proline-endopeptidase [*]
3 1 2 2 3 1 2 4 2 2 3 3 0 0 0 1 1 0
Proteinase K
103 111 95 90 108 113 102 111 114 136 107 108 102 87 89 81 118 65
Staphylococca
l peptidase I 12 14 11 8 13 12 9 16 16 13 8 12 5 5 5 5 13 8
Thermolysin 67 65 53 60 62 71 64 70 73 82 69 53 76 64 63 59 65 42
Trypsin
18 24 22 25 26 17 19 30 23 27 23 20 14 18 15 14 30 14
GranzymeB 1 0 1 0 0 0 0 0 0 0 0 0 0 0 0 0 0 0
Thrombin
1 0 0 0 0 0 0 0 1 0 0 0 0 0 0 0 0 0
Figure 3: Proteolytic Graph of Various protein of GPx Family.
Figure 4: Hierarchical Clustering of GPx Proteins on the basis of proteolytic site, node are represented in dot form its distance in the tree.
Amino Acid Composition:
The amino acid composition of all proteins is
calculated by ProtParam [15]
tool(http://us.expasy.org/tools/ protparam.html) of ExPASy . This tool represents percentage composition of Amino Acids of individual protein
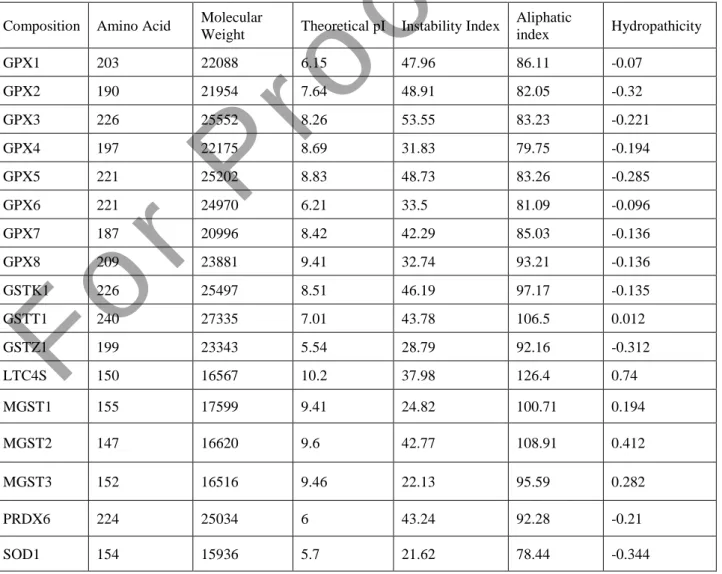
is represented in Table 3 and Figure 5. ProtParam tool also calculates various other molecular properties like Molecular Weight, Theoretical pI (Isoelectric point), Instability index, aliphatic index, Grand average of hydropathicity (GRAVY) of a protein sequence.
GPX1 GPX5 GSTK1 LTC4S PRDX6 0 20 40 60 80 100 120 140 A rg -C p ro te in as e A sp -N … A sp -N … BN PS-S kato le CN Br Ch ymo tr yp si n -… Ch ymo tr yp si n -… Cl o str ip ain Fo rmi c ac id G lu tamyl… H yd ro xyl ami n e Io d o so b en zo ic … Lys C Lys N N TCB ( 2-n itr o -… Pe p si n (p H 1.3) Pep si n ( p H > 2) Pro lin e -… Pro te in as e K St ap h yl o co cc al… Th ermo lys in Tryp si n G ra n zyme B Th ro mb in N u m b er o f Cu tt in g s ites Proteolytic Agent
Table 3: Percentage of Amino acid composition for all GPx proteins.
Type Ala Arg Asn Asp Cys Gln Glu Gly His Ile Leu Lys Met Phe Pro Ser Thr Trp Tyr Val Sec
GPX1 11.8 6.9 4.9 3.9 2.5 3.4 6.4 8.4 1 3 11.3 3 2 5.4 7.4 5.4 3.4 1 2 6.4 0.5
GPX2 4.2 6.8 5.8 5.3 2.1 4.2 6.3 5.8 1.1 5.8 9.5 5.3 1.1 7.9 7.4 4.7 5.3 1.1 3.7 6.3 0.5
GPX3 4.4 4.4 4 3.1 1.8 4.9 7.1 10.2 1.8 4.9 11.1 6.6 2.7 6.2 5.3 5.8 4 1.3 4.4 5.8 0.4
GPX4 8.1 4.6 5.1 5.6 4.6 2.5 5.1 8.6 2.5 5.1 9.1 8.6 3.6 5.1 4.6 3.6 2.5 2 3 5.6 0.5
GPX5 3.6 2.3 3.6 4.1 2.3 5 6.3 7.2 3.2 4.1 10 10.4 1.8 6.3 6.3 5 4.5 1.4 4.1 8.6 0
GPX6 5 0.9 5.4 2.7 2.3 7.7 6.3 8.1 2.3 2.7 10.4 7.2 1.4 9.5 5.4 5 4.1 1.4 3.2 8.6 0.5
GPX7 11.2 4.8 3.2 4.3 1.6 6.4 5.3 5.3 2.1 2.7 9.1 5.9 1.1 5.9 4.8 5.9 4.8 2.7 3.2 9.6 0
GPX8 5.7 4.3 3.3 2.9 1.9 2.4 8.1 4.8 1.4 4.8 10.5 11.5 0.5 7.7 7.2 6.7 2.4 1.4 2.9 9.6 0
GSTK1 8 5.3 4 3.1 0.9 3.5 7.1 6.6 3.1 5.3 14.6 5.8 4.9 3.1 7.1 5.3 4 2.2 2.2 4 0
GSTT1 10 5 1.2 6.2 1.2 5.4 5.4 3.8 2.5 4.2 15 6.7 2.1 4.6 6.7 2.5 5 2.1 2.9 7.5 0
GSTZ1 6.5 5 4.5 7.5 1.5 4.5 6 3.5 2.5 7 11.6 6 3 4 5 2.5 7 3 4.5 4.5 0
LTC4S 18.7 8.7 0.7 0.7 1.3 3.3 3.3 5.3 1.3 1.3 21.3 0.7 0.7 6.7 5.3 4 3.3 2 4.7 6.7 0
MGST1 9 7.1 3.2 5.2 0.6 1.3 3.2 5.2 1.9 5.2 13.5 4.5 4.5 6.5 4.5 5.8 6.5 0 5.8 6.5 0
MGST2 10.9 5.4 3.4 1.4 2 4.8 3.4 7.5 0.7 6.8 14.3 4.8 1.4 7.5 2.7 5.4 4.1 2 6.1 5.4 0
MGST3 9.2 3.9 2.6 0.7 2.6 2 3.3 11.8 3.9 5.3 10.5 5.3 2 4.6 4.6 7.2 3.9 1.3 6.6 8.6 0
PRDX6 7.1 5.4 3.1 7.1 0.9 0.9 7.1 6.2 1.3 5.4 11.2 8 1.8 5.4 8.5 4 6.2 1.3 1.8 7.1 0
SOD1 6.5 2.6 4.5 7.1 2.6 1.9 6.5 16.2 5.2 5.8 5.8 7.1 0.6 2.6 3.2 6.5 5.2 0.6 0 9.1 0
Figure 5: Amino Acids Composition represents a similarity in composition among all GPx Proteins.
GPX1 GPX5
GSTK1 MGST1
SOD1
0 5 10 15 20 25
A
la
A
rg
A
sn
A
sp
Cys Gln Glu Gly His Ile
Le
u
Lys
Me
t
Phe Pro Ser Thr Trp Tyr
V
al
Se
c
%
COMPOS
IT
IO
N
AMINO ACID
Chart Title
0-5 5-10 10-15 15-20 20-25
(A) (B)
Figure 6: Cluster tree (A) based on composition and Cluster group and score graph (B).
Table 4: Various Parameters computed using Expasy’s ProtParam tool of human glutathione peroxidase.
Composition Amino Acid Molecular
Weight Theoretical pI Instability Index
Aliphatic
index Hydropathicity
GPX1 203 22088 6.15 47.96 86.11 -0.07
GPX2 190 21954 7.64 48.91 82.05 -0.32
GPX3 226 25552 8.26 53.55 83.23 -0.221
GPX4 197 22175 8.69 31.83 79.75 -0.194
GPX5 221 25202 8.83 48.73 83.26 -0.285
GPX6 221 24970 6.21 33.5 81.09 -0.096
GPX7 187 20996 8.42 42.29 85.03 -0.136
GPX8 209 23881 9.41 32.74 93.21 -0.136
GSTK1 226 25497 8.51 46.19 97.17 -0.135
GSTT1 240 27335 7.01 43.78 106.5 0.012
GSTZ1 199 23343 5.54 28.79 92.16 -0.312
LTC4S 150 16567 10.2 37.98 126.4 0.74
MGST1 155 17599 9.41 24.82 100.71 0.194
MGST2 147 16620 9.6 42.77 108.91 0.412
MGST3 152 16516 9.46 22.13 95.59 0.282
PRDX6 224 25034 6 43.24 92.28 -0.21
SOD1 154 15936 5.7 21.62 78.44 -0.344
The abundance of GPx proteins may vary from tissue to tissue in a human body but they have high similarity in their composition and functions. The main aim of this is to study to find relation between various different GPx proteins. In this study firstly we have calculated the Shannon Entropy of all the curated proteins to represent the randomness of the sequence. Randomness in the sequence information reveals that the sequences have same randomness level as shown in Figure 1. The information content of each GPx have low variation so the evolutionary difference between the sequences were calculated. To find the evolutionary differences and similarity we have used two different methods, one is Sequence based in figure 2 and other is property based Figure 3-6. The property based study method is further divided in to number cleavage site based and composition based studies. The results of sequence based analysis reveals that most of the glutathione peroxidase is forming similar groups but in property based methods showing wide variations in comparison to sequence based analysis. The similarity found in cluster analysis based on composition is
between MGST3/MGST1, GPX1/GPX7,
GSK1/GSTT1, and
HPGDS/GPX8/GPX3/GPX5/GPX6. The
similarities obtained by using number of proteolytic sites are between MGST1/MGST3,
GPX1/GPX7, GSTT1/GSTK1, and
HPGDS/GPX5/GPx8/GPx3/GPX6. These
results obtained by both the methods are of
high similarity. But when we are trying to compare both the property based tree with the Multiple sequence analysis base tree then there are lot of variations are obtained showing the non reliability of the sequence based methods. Table 4 represents property based differences between various GPx proteins.
Conclusion:
The compositional and cluster based analysis of GPx have high similarity and have immense potential to find similar acting GPx or any proteins. The MSA based methods are always supposed to be best for evolutionary studies but we found non-significant results in sequence based methods for GPx proteins. By using property clustering methods, we found good relation between sequences defining the similarity between sequence. On comparing the results obtained by both the methods we found that clustering based methods are working better than sequence based. This provide us evidence that sequence based methods are less relevant as compared to cluster and composition based for evolutionary studies of proteins. According to our finding the clustering and property based methods are more reliable and realistic and should be used for evolutionary studies of proteins.
Acknowledgement:
The work is supported by Amity Institute of Biotechnology, Amity University Rajasthan, India, for providing the lab facilities to carry out this research.
References:
1 J. R. Arthur, "The glutathione peroxidases." Cellular and Molecular Life Sciences CMLS ,2001, 57.13-14, 1825-1835.
2 Gordon C. Mills, "Hemoglobin catabolism I. Glutathione peroxidase, an erythrocyte enzyme which protects hemoglobin from oxidative breakdown." Journal of Biological Chemistry 1957, 1, 229, 89-197.
3 Aqib Iqbal, et al. "Hydroperoxide reduction by thioredoxin‐specific glutathione peroxidase isoenzymes of Arabidopsis thaliana." FEBS Journal 2006, 273.24, 5589-5597.
4 L Yu, S Venkataraman, M C Coleman, D R Spitz, P W Wertz, F E Domann. Glutathione
peroxidase-1 inhibits UVA-induced AP-2alpha expression in human keratinocytes. Biochem Biophys Res Commun. 2006, 4 ,35, 1066-71. 5 S Blankenberg, H J Rupprecht, C Bickel, M
Torzewski, G Hafner, L Tiret, M Smieja, F Cambien, J Meyer, K J Lackner, Glutathione peroxidase 1 activity and cardiovascular events in patients with coronary artery disease. N. Engl. J. Med., 2003,349,1605-1613.
6 K Faucher, H Rabinovitch-Chable, J Cook-Moreau, G Barriere, F Sturtz, M Rigaud, Overexpression of human GPX1 modifies Bax to Bcl-2 apoptotic ratio in human endothelial cells. Mol. Cell. Biochem, 2005,277, 81-87.
7 S Kumar, K Bhadhadhara, S Govil, N Mathur, A. N. Pathak, In-Silico studies for comparative analysis of glutathione peroxidaes isozymes in homo sapiens. International Journal of Pharma and Bio Sciences, 2014, 4(B), 5, 352 – 363. 8 The UniProt Consortium-Activities at the
Universal Protein Resource (UniProt) Nucleic Acids Res. 2014, 42: D191-D198.
9 Pedro Romero, et al. "Sequence complexity of disordered protein." Proteins: Structure, Function, and Bioinformatics, 200, 1, 42, 38-48. 10 J. A. Tenreiro Machado, Shannon Entropy
Analysis of the Genome Code. "Mathematical Problems in Engineering, 2012.
11 K. Tamura,, G. Stecher, D. Peterson, A. Filipski, & S Kumar, MEGA6: molecular evolutionary genetics analysis version 6.0. Molecular biology and evolution, 2013,12,30, 2725-2729.
12 William J. Bruno, D. Socci Nicholas, and L. Halpern Aaron, "Weighted neighbor joining: a likelihood-based approach to distance-based phylogeny reconstruction." Molecular Biology and Evolution, 2000,1,17, 189-197.
13 ExPASy PeptideCutter tool: Gasteiger E., Hoogland C., Gattiker A., Duvaud S., Wilkins M.R., Appel R.D., Bairoch A.;Protein Identification and Analysis Tools on the ExPASy Server;(In) John M. Walker (ed): The Proteomics Protocols Handbook, Humana Press (2005). 14 Berkhin, Pavel. "A survey of clustering data
mining techniques." Grouping multidimensional data. Springer Berlin Heidelberg, 2006. 25-71. 15 Gasteiger E., Hoogland C., Gattiker A., Duvaud
S., Wilkins M.R., Appel R.D., Bairoch A.;Protein Identification and Analysis Tools on the ExPASy Server;(In) John M. Walker (ed): The Proteomics Protocols Handbook, Humana Press (2005)-(ProtParam).