1Fac 2F Abstr electron contrib Perceiv consum is the m that lea Keyw Intenti 1. 1.1. Inter fastes enhan servic book popu 566.4 user that highe Afric (2007 the (34% *Corre DOI: h Print I Copyri School Th
Attit
Ritz culty of EconFaculty of E
ract. Virtual sto nic commerce. U bution to the are ved Usefulness (P mers in Indonesia
mediating effect o ad a user’s behav
words : Attitud ion
Introduct
Virtual Sho rnet-based
st growing i ncement in ces. Based k 2013, t ulation was 4% increase in 2000. Th
in past 10 est penetrat ca (3,606%)
7) shows als highest gl %), followed esponding autho http://dx.doi.or ISSN: 1978-6956 ight@2014. Pub l of Business an
he Asian Journ
tudinal Ex
zky Karina M nomy, Univ Economics a
ores provide great Understanding the ea of e-commerce (PU) as the fact a indicate that T on the relationship vioural intention
dinal, Task Tec
tion
opping Issues industry is industry wit n terms of
d on Worl the worldw
2.4 billion compared he present sc
0 years, As tion growth ). Internet so that globa
lobal onlin d by Europe
or. Email: kikybr rg/10.12695/ajt 6; Online ISSN: blished by Unit R nd
Management-nal of Technol
xplanatio
M.R. Brahm versitas Krist
and Business Sarawa
t efficiency in the e intention of con e. This research tors that drive c TTF affects PEoU
ip between TTF to use a virtual s
chnology Fit, Pe
s the worl th an extens products a ld Bank fa wide inter
in 2012. It to the inter cenario depi sia scores h (800%) af
World St ally Asia sco ne percenta
e (29.2%) a
rahmana@gmai tm.2014.7.1.3
2089-791X. Research and K -Institut Teknol
logy Managem
n on Virtu
mana1* and Ra ten Petra, Si s, Universiti ak, Malaysia
retail value chai nsumers to shop
proposes Task consumers’ inten U and PU signif
and Intention. T shop.
erceived Ease of
ld’s sive and acts rnet t is rnet icts the fter tats ores age and No int In Ta hig tw hig wi pro int exp Ch pe gro est 20 20 il.com Knowledge ogi Bandung.
ment Vol. 7 No
ual Shopp
ayenda Khr iwalankerto, i Malaysia Sa
, 94300
in, and their exis online in attitu Technology Fit, tion. The result ificantly. Our hie The resulting mod
f Use, Perceived
orth Americ ternet usage
donesia giv able 1 shows
gh growth o wo digit grow
gher than o th the e ojected th ternet users
pected from hina, India, enetration of
owth of inte timated to 005 to $329 005).
o. 1 (2014):
19-ping Inten
esna Brahm , Surabaya, I arawak, Kot
stence has tremen udinal perspective , Perceived Ease ts from our surv erarchical model del explains a la
d Usefulness, Re
ca (24.9%). in Asia-Pac ves an in s Indonesia of internet p
wth in 2012 other countr eTForecast hat enormo
s in near m populous Brazil and f internet is ernet shopp grow from billion in 20
-30
ntion
mana2 Indonesia, 6 ta Samarahan
ndously paved the e will provide im e of Use (PEoU vey study of 310
also reports that arge portion of th
etail, Virtual S
Considering cific region a nteresting f
still maintai enetration. I 2, which is
ries. This is (2004) w ous growth
future coul countries su d Indonesia. s followed b ping where i m $172 billio
010 (see Joh 0236 n,
The Asian Journal of Technology Management Vol. 7 No.1 (2014): 19-30
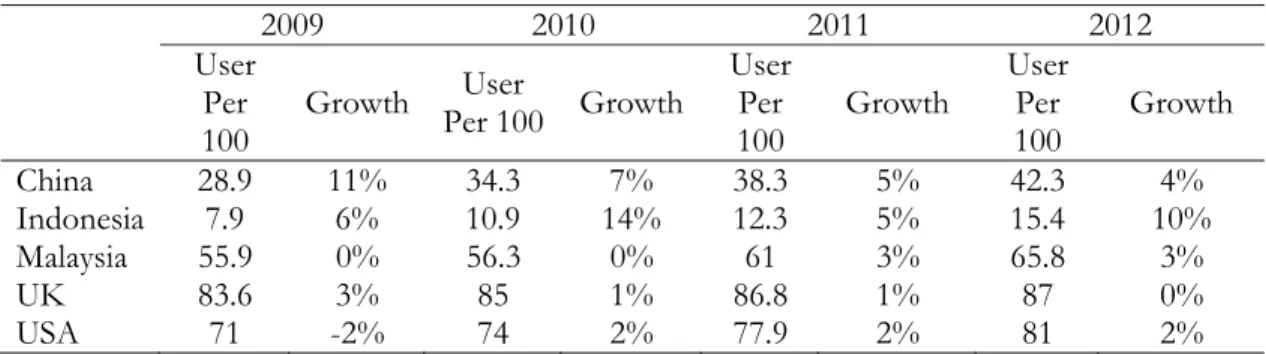
Another interesting phenomenon from Indonesia is that even though Indonesia was ranked 10th as the biggest GDP (2014) in the world and has consumption driven economy, it still has low penetration of internet use per 100 people (see Table 1). According to survey of A.C Nielsen, Indonesia is one of the countries with highest demand of smartphone, and the
growth rate of smartphone user is up to 23%. In fact, marketresearch.com portrays Indonesia as a land of opportunity for telecommunication industry as their cost of service (including Internet data packets), is decreasing most sharply in the ASEAN region even in the midst of economic recession.
Table 1 . World Bank Internet user data
2009 2010 2011 2012
User Per
100 Growth
User
Per 100 Growth
User Per
100 Growth
User Per
100 Growth
China 28.9 11% 34.3 7% 38.3 5% 42.3 4%
Indonesia 7.9 6% 10.9 14% 12.3 5% 15.4 10% Malaysia 55.9 0% 56.3 0% 61 3% 65.8 3%
UK 83.6 3% 85 1% 86.8 1% 87 0%
USA 71 -2% 74 2% 77.9 2% 81 2%
Source: World Bank
This phenomenon creates another opportunity, which is online shopping. Online stores are the party that offers services in virtual goods sales. Characteristics of online stores usually come in a form of a website with transaction functions like a real store, such as storefront, shopping cart, until the payment process. Examples of famous online shops in Indonesia are
Bhinneka.com, blibli.com, Tokopedia.com, Tokobagus.com, or from
abroad such as Amazon.com and Ebay.com
Internet shopping adoption has initiated the research in recent years, apart from attracting consumers either from a consumer oriented or technology oriented view (e.g. Jarvenpaa and Todd 1997). Reinforcement of these views focuses on consumer’s beliefs of internet purchases integrating with the technical specifications of these internet purchases (i.e. Zhou et al., 2007). Consumer research is critical to the success of any market. However, there might be differential adoption patterns among the consumers,
due to a completely new and innovative place (internet) of purchase (see Wang et al., 1998).
Discussing the association between the e-shopping and consumption has to start from the motive of buying. Motive on buying is all the consumer needs to be driven for do shopping just for the sake of satisfying their needs and wants (Grewal and Levy, 2010). For instance, Akinyele (2010) addresses that the needs satisfaction can influence an individual to be more commit and effective. It is in line with Maslow (1954) hierarchy whereas motive is a hierarchy needs to be fulfilled accordingly to their physiological, safety, love, esteem, and self-actualization. Based on those needs, many people have different intention while they are going to decide where to buy the product. This intention is moved by attitudinal motivation.
is commonly explained by Technological Acceptance Model of Davies (1989), The advance of information technology has changed the interaction of human to human. It becomes one of the most important inventions of the decades. For example is the used of IT on education area. Onasanya et al., (2010) shows how technology can change the attitude of lecturer in Nigeria higher institution. Farahbakhsh et al. (2007) documents the role of health information system on the performance of organization. In medical science, the information technology might also be the prevention for obesity elevated blood pressure (see Shehu et al., 2010).
There are many on-line shops or virtual shops that have been created. This is the result of people conduct their consumption process virtually nowadays. It would be very interesting to investigate whether the attitudinal motives of consumers in technology use is driven by their perception on the usefulness. To make it more robust, we introduce the task technology fit whereas it can picture the “usefulness” of virtual shop when it fits the task a user is engaged in. In line with Berthon, Pitt & Watson (1996), Yeh and Yan (2010), Lee et al. (2011), and Montinaro and Sciascia (2011), suggestion, we address the following question: what are the attitudinal factors on determining the consumers’ intention to use virtual shop?
2. Literature Study
This research defines virtual shopping as the use of online stores by consumers for purchasing transactional event. We adopt Technology Acceptance Model (TAM) to explain the behavioural intention of consumers to shop on internet. Davis (1989) has shown that TAM can explain the usage of information technology in attitudinal approach. He applied the theory of Ajzen and Fishbein (1980) about reasoned action to show that beliefs influence attitudes which lead to
intentions, and therefore generate behaviors. Davis thus conceived that TAM’s belief–attitude–intention–behavior relationship predicts user acceptance of IT.
TAM originally proposes two determinants of persons’ attitude toward shopping online. First determinant is Perceived Usefulness (PU) which refers to the degree to which a person believes shopping online will accomplish shopping task more quickly (Davis, 1993); and another one is Perceived Ease of Use (PEoU) which refers to the extent to which a person believes that shopping online will be Free of efforts (Davis, 1993). We also introduce an antecedent of consumers’ intention as our contribution which is Task Technology Fit (TTF).
Davis (1993) defines Perceived Usefulness (PU) as degree to which a person believes that a particular information system would enhance his or her job performance, i.e., by reducing the time to accomplish a task or providing timely information. Within TAM, PU is a major factor, in determining system usage. Meanwhile, Davis (193) defines Perceived Ease of Use (PEoU) as degree to which a person believes that using a particular system would be free of effort.
The Asian Journal of Technology Management Vol. 7 No.1 (2014): 19-30
contribute positively and statistically significant to intention to use.
The contribution in this research is the role of Task Technology Fit or TTF as antecedent. It is the matching of the capabilities of the technology to the demands of task, that is, the ability of IT to support a task (Goodhue and Thompson, 1995; Lo, 2010). Goodhue (1995) develops and tests a model that determined TTF based on task needs and found TTF as important factor in technology use. It was viewed as the extent to which technology functionally matched task requirements and individual abilities. It was assumed that users can successfully evaluate TTF and that a higher fit would eventually result in better performance. From Goodhue (1995) model, we modify that TTF is a relevant concept to predict information success, fit to determine an appropriate interplay between tasks, technology, and individual characteristic. Following Zigurs and Buckland (1998), we hypothesize that particular technology with a particular kind of tasks will influence the PU and PEoU of consumers. Goodhue (1995) shows that TTF was a better indicator of the value of an information system other evaluation system. Further, He performed an empirical study and found that TTF can explain the user perceived on task of technology.
3. Methodology
3.1. Data
This paper is survey-based research where the questionnaire is built by adopting and adapting similar previous research. The items in the questionnaire were validated first before using it in testing the research model and its hypothesis. It is noteworthy that the questionnaire was pre-tested by using 20 postgraduate students who had
experiences in doing online shopping. Then, 310 questionnaires were distributed and voluntarily filled (out of 1000 disseminated questionnaires) in 5 big cities of Indonesia (Jakarta, Surabaya, Medan, Denpasar, and Bandung). The data were collected over period of March 2011 until August 2011.
Table 2 reports that the respondents were dominated by young-age group where 38% of respondents are aged between 18-23 years old, 33% respondents are between 24-29 years old, 21% respondents are between 30-34 years old, and 8% is categorized as others (more than 34 years old). The number of respondents who owned credit card (45.7%) is relatively less than the number of respondents who do not own credit card (54.3%), yet there is no huge difference between the groups. This might because the study consisting respondents from different level of ages. As most of them are on early young age, they might use their younger sibling or parent’s credit card as the media for transaction.
Table 2. Demography of Respondents
Dimension Frequency Dimension Frequency
Age Demography 18-23 Years Old 24-29 Years Old 30-34 Years Old >34 Years Old
38% 33% 21% 8%
Credit Card Ownership Having credit card
Do not have credit card 45.7% 54.3%
Number of used online shop 1-2 sites
3-5 sites >5 sites
40.3% 39.3% 20.4%
Time to spend for online shop transaction
0-5minutes 6-15minutes 16-30minutes 31-60minutes More than 1 hour
17.4% 26.7% 26.5% 22.9% 6.5% Purchased Products in Online
shop Airline Hotel Clothing Accessories Gadgets Other
38% 23% 22% 12% 9% 12%
3.2. Questionnaire design, reliability test, and validity test
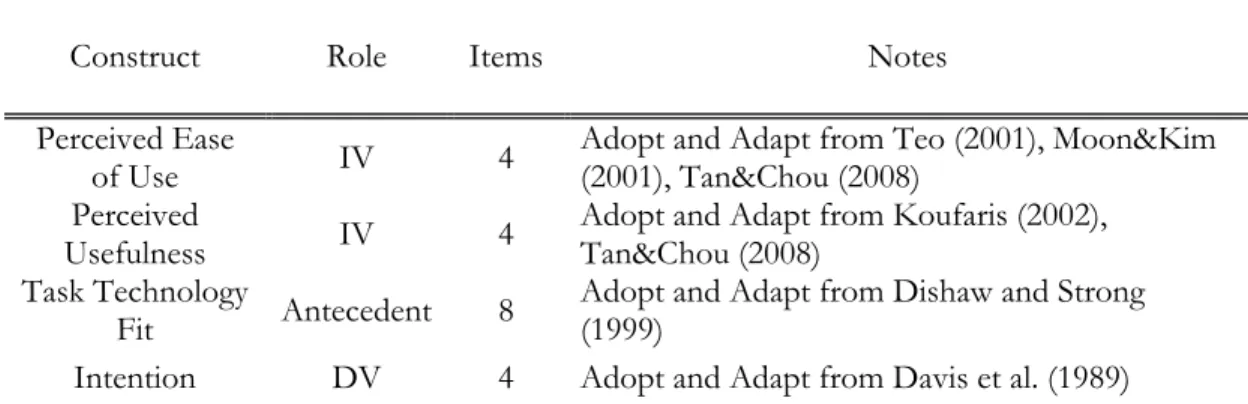
The questionnaire was designed based on previous works on Technological Acceptance Model (TAM). There are 20 items in the questionnaire, and the reliability of each items were tested under cronbach alpha. The dimensions on this paper are Task Technology Fit (TTF), Perceived Usefulness (PU), Perceived Ease of Use (PEoU), and Intention to Use. All items were constructed by adopting-and-adapting previous research on a 5-Point Likert scale. We conducted a pilot test first because previous studies investigated western context, meanwhile our study is on eastern. We validate the items by running the Factor Analysis. The detail of questionnaire development is described in Table3.
The questionnaire was translated in two ways. First, we translated into Bahasa
Indonesia. After that, we translated it again to English to match it. We found minor differences during this two-ways translation, and ignored it as the meaning of the question remains the same. For confirmation, we consulted it again to two Professors (one from Psychology, and another from Economics).
The Asian Journal of Technology Management Vol. 7 No.1 (2014): 19-30
Table 3. Questionnaire Development
Construct Role Items Notes
Perceived Ease
of Use IV 4 Adopt and Adapt from Teo (2001), Moon&Kim (2001), Tan&Chou (2008) Perceived
Usefulness IV 4
Adopt and Adapt from Koufaris (2002), Tan&Chou (2008)
Task Technology
Fit Antecedent 8 Adopt and Adapt from Dishaw and Strong (1999)
Intention DV 4 Adopt and Adapt from Davis et al. (1989)
Note: IV denotes independent variable, DV denotes dependent variable
We further conduct factor analysis to achieve data reduction or retain the nature and character of the original items, and to delete those items which had lower factor loadings (see Hair et al, 2006 for the detail). The criteria is the loading has to be
higher than 0.50. Table4, Table5, Table6 document that the Task Technology Fit, Perceived Usefulness, Perceived of Ease of Use, and Intention behaviour pass the validity test, respectively.
Table 4. Factor Analysis result of Task Technology Fit
Component
Task Technology Fit
I found the functionalities of online shopping sites were very
adequate .857
I found the functionalities of online shopping sites were very
appropriate .834
I found the functionalities of online shopping sites were very
useful .801
I found the functionalities of online shopping sites were very
compatible with the task .685
I found the functionalities of online shopping sites were very
helpful .773
I found the functionalities of online shopping sites were very
sufficient .610
I found the functionalities of online shopping sites made the task
very easy .758
In general, the functionalities of online shopping sites were best
fit the task .743
Cronbach Alpha .922
Table 5. Factor Analysis results of Independent Variables (PU and PEoU)
X1: Perceived Usefulness Component
Using online shop sites enable me to look for products quickly .714
Using online shop sites improved my consumption choice .662
Using online shop Sites to look for products was very effective .644
Using online shop site made it easier for me to look for products .697
Cronbach Alpha .885
Note: Adopt and Adapt from Koufaris (2002), Tan&Chou (2008)
X2: Perceived Easy of Use
Learning to online shop sites was easy for me .760
I found it easy to do what I want to do in online shop Sites .720
My interaction with online shop sites was clear and understandable .575
My interaction with online shop sites was clear and understandable .565
Cronbach Alpha .885
Note: Adopt & Adapt from Teo (2001), Moon&Kim (2001), Tan&Chou (2008)
Table 6. Factor Analysis Result of Intention to Use
Intention to Use Component
The Likelihood that I would use online shop site for purchasing is high .857
I am willing to use online shop site for buying products .834
In the near future, I would consider using online shop sites for buying
products .801
I regularly use online shop site for buying products .743
Cronbach Alpha .901
Note: Adopt and Adapt from Davis et al. (1989)
3.3. Descriptive Statistics
There are two important remarks from Table 7. First, the Pearson correlation shows there is no inter-correlation variables among the independent variables as the correlation between PU and PEoU is low (0.311) and not statistically significant. The Pearson correlation also indicates a strong relationship between the TTF and PU (where the correlation is 0.422 and statistically significant), TTF and PEoU (where the correlation is 0.532 and statistically significant), and TTF and Intention (where the correlation is 0.421
The As Table Task (1) Perc Perc Use Inte Use
4. R
The r are p and effec in th attitu shop relati Figur Our TTF 1% l there single playe estim as th almo TTF half estim signif Depi
sian Journal of Tec
e 7. Descrip
Varia k Technolog ceived Usefu ceived Ease /PEoU (3) ention to /Intention(4 Results
results of th presented in Kenny (19 ct. Hence, w his research
udinal belief ping. The f ionship bet
re 1. Hierarc
first-step i has signific evel. The be e is 72.8%
e unit of ed importan mation mode
he R2 is 37. ost the same
alone alrea of variatio mation mode ficant influe icted on Fig
chnology Managem ptive Statistic able gy Fit/TTF ulness/PU ( of 4)
he test of hie Figure1. W 86) about we have thr to investiga f on intent first step est tween TTF
chical Mode
investigation cant associa
eta value is contributio PU. In sh t role on PU el itself is r .4.0%; and e (37.2%). ady can expl on in PU. el shows tha ence on PEo
gure1, TTF
ment Vol. 7 No.1
c Results
1 1 0.4 (2)
erarchal mo We follow Ba the mediati ree-step mo ate the role tion of onl
timation is F and PU.
el Result
n reports t ation to PU 0.728 signif n of TTF hort, TTF h
U. Further, robust enou
adjusted R2 It means t lain more th
The seco at TTF also h oU in 1% lev F beta value
(2014): 19-30
Pearson C 2
422*** 0.5
1 0
odel arry ion odel of line the It ex dir PE the sh the an on by that U in fies on has the ugh 2 is that han ond has vel. e is 0.6 sin 0.3 var mo thi rel Th 0.4 var 0.3 sta Correlation 3 532*** 0. 0.311 0.
1 0
amines how rectly. The EoU. It inve
e user-frien op. Lastly, e factors o nd PEoU. T
ne hierarchi y Barry and K
612 indicati ngle unit of 361 meanin riation in PE odel 1 R2 bu ird model lationship b he R2 is co 401 meanin riation in 361 to int atistically sig 4 .421*** .477*** 0.321** 1
w TTF can i second is estigates the ndly attribut there is the f intention This three-s cal model Kenny (1986 ing 61.2% PEoU. The ng TTF can
EoU. It is sl ut still cons is by in between TT onsiderably ng TTF can
intention. T tention to gnificant at 1
Mean DS
3.4497 .61 3.6703 .72
3.3415 .81
3.1538 .75
influence th TTF effec e role of TT tes of the v investigatio from TTF step model which sugg 6). contributio e model has n explain 3 lightly lower sidered high nvestigating TF and inten
high where n explain 4 TTF contri use and 1% level. Std. Dev 1398 2844 1637 5293 he PU ts on TF on virtual on on , PU, build gested on on R2 of 36.1% r than h. The g the
ntion. e it is
The last estimation model is by taking PU, and PEoU altogether as regressors. This step has to be done to confirm our hierarchical model. The results of model 4 are F-test is significant in 1% level, and the R2 is 0.530. The R2 improves up to 20% indicating those 3 factors are the loading factor for the intention model. In terms of significance of result, we found only 2 variables (TTF and PU) have significant relationship to intention to online shopping. Meanwhile, we reject the hypothesis of the relationship between PEoU and Intention. In a nutshell, we conclude that our hierarchical model found PU is the mediating effect on the relationship between TTF and Intention. Moreover, PEoU does not have any mediating effect on the relationship between TTF and Intention. Intention to online shopping was driven by the usefulness of website not a user-friendly website.
5. Discussion and Implication
Our research found the significantly positive association between Task Technology Fit (TTF) and Perceived Usefulness (PU). It indicates that TTF can increase the PU of consumers during online shopping, which is consistent to Goodhue and Thompson (1995). This result reminds us to the result of Dishaw and Strong (1999) where TTF actually is an extended version of TAM model. This result tells us that the experience on the virtual shop, optimization of virtual shop functionality, and the utilization of virtual shop features, might boost the perceived of usefulness of the consumers’. By stressing on the improvement of these TTF, consumers’ would increase their perception on the usefulness of the virtual shop.
However, the PU did not have any significant relationship to the intention to shop online. It is a contrary result with other previous result in TAM studies. The quality, productivity, and performance of
virtual store did not have any affects on the intention of consumer. They did not look after how useful the website is. The usefulness of the site had not taken into the perception account of consumers; an interesting finding that need to explore more.
Meanwhile, the association between TTF and PEoU shows the visualization, tools functionality, and tools experience can enhance the PEoU of consumers. It is consistent to Mathieson and Keil (1998), and Lee et al (2011). By providing these TTF features, consumers should feel friendlier to use the online shopping as alternative of traditional purchase. Moreover, the internet-literacy in Indonesia is not that high. TTF feature would help them to understand the features in virtual shop easily. In short, when a system of internet is easily to use and do not bring any problems for consumer when they want to shop online, consumers will tend to shop via online.
The Asian Journal of Technology Management Vol. 7 No.1 (2014): 19-30
This paper reported there is only 1 mediating effect on the model, which is the Perceived Ease of Use (PEoU) effect. Meanwhile, Perceived Usefulness (PU) has been found without any mediating effect; an evidence of the importance of PEoU on the intention to shop online.
This research has impact on the e-marketers and e-retailers, since it enables them to assess the features that specifically attract consumers to shop on the internet. Understanding intention to shop online is very important for those entities due to make adequate strategic, technological, and marketable decision. Moreover, those 2 entities can pay attention on their website improvement to increase consumer attraction. In simple example, our research shows that consumers’ intention to shop online is influence by perceived ease of use. E-marketers and e-retailers should emphasize on improving their virtual shop in the user-friendly perspective. Moreover, our study shows that Task Technology Fit is another important feature in intention to online shop. TTF can give strong evaluation tools to e-retailers whether the services of virtual shop are meeting user needs.
6. Conclusion
The usage of online shopping has become popular in Indonesia due to the impressive increase of online users. Even though so, a research of the determinants of consumers’ intention to shop online is left behind. In virtual shop context, Perceived Ease of Use is the most important aspect. It gives highest magnitudes on the association, especially on the mediation effect. Therefore, virtual shop should notice that their sites need to provide user-friendly website. Furthermore, the role of Task-Technology fit is also important on the intention. Giving the features of TTF would increase the level of user-friendly a virtual store. As PEoU is a mediator, it also enhances the intention to shop inline. Our hierarchical
model suggests it is important to pay closer to this area.
This research enriches the literature of technology acceptance model by introducing Task Technology fit constructs as another driver. In terms of industrial practice, it gives an insight about what the drivers to catch consumer’s intention in terms of usefulness are. From consumer’s perspective, virtual shops will give benefits such as broader options for product, convenience (Janal, 1997; Jarvernpaa & Todd, 1997) competitive pricing and information richness (Peterson, Balasubramanian & Bronnenberg, 1997).
Moreover, Bettman, Luce & Payne (1998) stated that consumer prefer to choose virtual shop than conventional shop because in virtual shop, the consumer can find the any product’s information easily and can process it in one click for any selection that they want. This is in line with our findings. Note that giving a better service will enhance the intention of consumer and satisfaction (Carlson and O’Cass, 2010; Turk and Avcilar, 2010). By our findings it will deliver a better strategy for virtual shop to enhance more on their user-friendly features and its task-technology fit. Future research can examine the role of personality as the antecedents of the PU or PEoU, and also the psychological factors in the interaction of human behaviour in using internet as their shopping behaviour.
References
Ajzen, I., & Fishbein, M. (1980). Understanding attitudes and predicting social behaviour.
Akinyele, S.T. (2010) Needs satisfaction: An effective tool for workers commitment to work. Research Journal of Business Management, 4(1), 83-90.
Berthon, P., Pitt, L. F., & Watson, R. T. (1996). The World Wide Web as an advertising medium. Journal of advertising research, 36(01), 43-54. Bettman, J. R., Luce, M. F., & Payne, J. W.
(1998). Constructive consumer choice processes. Journal of consumer research, 25(3), 187-217.
Carlson, J., & O’Cass, A. (2010) Exploring the relationships between E-Service quality, satisfaction, attitudes, and behaviour in content-driven E-Service websites. Journal of Service Marketing, 24(2),
112-127. DOI 10.1108/08876041011031091
Davis, F. D. (1989). Perceived usefulness, perceived ease of use, and user acceptance of information technology. MIS quarterly, 319-340. Davis, F. D., Bagozzi, R. P., & Warshaw,
P. R. (1989). User acceptance of computer technology: a comparison of two theoretical models. Management science, 35(8), 982-1003.
Dishaw, M.T., and Strong, D.M. (1999). Extending the technology acceptance model with task technology fit constructs. Information and Management, 36(1), 107-120
Farahbakhsh, M., Fozounkhah, S., Sadeghi-Bazargani, H., & Zakeri, A. (2007) The study of health information system performance from managers and experts’ viewpoints. Information Technology Journal, 6(2), 227-231.
Goodhue, D.L. (1995). Understanding User Evaluation of Information Systems. Management Science, 41(12), 1827-1844
Goodhue, D.L., and Thompson, R.L. (1995). Task Technology fit and individual performance. MIS Quarterly, 19(2), 213-236
Grewal, D. & Levy, M. (2010). Marketing 2nd Ed., New York : McGraw – Hill USA.
Hendrickson, A. R., & Collins, M. R. (1996). An assessment of structure and causation of IS usage. ACM SIGMIS Database, 27(2), 61-67. Janal, D. (1997). Online Marketing
Handbook-How to Promote. Advertise, and Sell Your Products and Services on the Internet.
Jarvenpaa, S. L., & Todd, P. A. (1997). Is there a future for retailing on the Internet. Electronic marketing and the consumer, 139-154.
Koufaris, M. (2002). Applying the technology acceptance model and flow theory to online consumer
behavior. Information Systems
Research, 13(2), 205–223.
Lee, M.K.O., Shi, N., Cheung, C.M.K., Lim, K.H., and Sia, C.L. (2011). Consumer’s decision to shop online: the moderating role of positive informational social
influence. Information and
Management, 48, 185-191
Lo, Chih-Yao. (2010) Analytical approach of virtual auction scheme to joint purchase of leisure farms. Research Journal of Business Management, 4(2), 126-135.
DOI:10.3923/rjbm.2009.6.15 Mathieson, K. (1991). Predicting user
intentions: comparing the technology acceptance model with the theory of planned behavior. Information systems research, 2(3), 173-191.
Montinaro, M., & Sciascia, I. (2011) Market segmentation models to obtain different kinds of customer loyalty. Journal of Applied Science,
11(4), 655-662. DOI:10.3923/jas.2011.655.662
Morris, M. G., & Dillon, A. (1997). How user perceptions influence software use. Software, IEEE, 14(4), 58-65.
Nunnaly, J.C., & Bernstein, I.H. (1994). Psychometric Theory. New York: McGraw Hill
The Asian Journal of Technology Management Vol. 7 No.1 (2014): 19-30
institution lecturers’ attitude towards integration of ICT into teaching and research in Nigeria. Research Journal of Information Technology, 2(1), 1-10
Peterson, R. A., Balasubramanian, S., & Bronnenberg, B. J. (1997). Exploring the implications of the Internet for consumer marketing. Journal of the Academy of Marketing Science, 25(4), 329-346.
R. Thompson, Extending the technology acceptance model with motivation and social factors, Proceedings of Association for Information Systems Annual Conference
Sekaran, U. (2003). Research methods for business: A skill building approach (4td ed).New York: John willey and Sons
Shih, H. P. (2004). An empirical study on predicting user acceptance of e-shopping on the Web. Information & Management, 41(3), 351-368. Tan, F.B., & Chou, J.P.C. (2008). The
Relationship between mobile service quality, perceived technology compability, and users’ perceived playfulness in the context of movile information and
entertainment services. International Journal of Human-Computer Interaction, 24(7), 649-671
Teo, T.S.H. (2001). Demographic and motivation variables associated with internet usage Activities. Internet Research: Electronic Networking Applications and Policy, 11 (2): 125-37.
Turk, Z., & Aveilar, M.Y. (2010) The effects of perceived service quality of audit firms on satisfaction and behavioural intentions: A research on the Istanbul stcok exchange listed companies. Research Journal of Business Management, 4(2), 156-166. DOI: 10.3923/rjbm.2009.36.46 Yeh, R., and Yan, R. (2010). An Applied
Logistic Model for Online Purchase Decision via Web-Building Experiments. International Journal of Data Analaysis Techniques and Strategy, 2(1), 73-84