Design a T2DM-Meal Plan by Enhancing Current Practice using Linear
Programming
*
Hanan Abdul Karim, Noraini Noordin and Noor Zaini Yasok
Faculty of Computer and Mathematical Sciences, Universiti Teknologi MARA, MALAYSIA
Abstract
Changing lifestyles, ignorance of nutritional knowledge and low health consciousness among Malaysians have promoted the alarming increase of diabetes cases today. Currently, an optimal palatable meal for T2DM-affected individuals is not achievable because dieticians have to perform tedious manual calculations; differentiated views on meal plan; and limited consultation time. In addition, none of the few researches on T2DM-meal planning have applied exchange lists currently practiced by dietitians. To provide a mathematical solution to the problem, this research has used linear programming to develop a meal plan as it has the ability to find the best optimal solution when all the constraints are satisfied, and also as an alternative to the current practices. A Malaysian food exchange list for T2DM-affected individuals based on available information in the Atlas was created for this purpose. Adapting the current standard dietitian practice and available guidelines has also made design of T2DM-meals more direct and logical with the production of two different models, Exchange Planner and Meal Planner. These models can translate dietary recommendations into actual food exchange plans as well as suggest the amount of food intakes for each meal or snack. In conclusion, the resultant meal plans have successfully minimized energy intakes and satisfied specified restrictions which may simultaneously improve glycaemic control and lessen risk of complications for individuals with T2DM.
Keywords: Atlas, exchange list, Exchange Planner, Meal Planner, T2DM
Introduction
When beta () cells in the pancreas fails to produce sufficient insulin to transmit sugar to body cells for energy and abnormally high levels of sugar arise, a
metabolic disease called diabetes mellitus
(or diabetes) takes place (Coates & Flannery, 2010; MedicineNet, 2013). Recent 2013 statistics estimated doubling of current world diabetic population of 382 million people to 592 million before 2038 (International Diabetes Federation, 2013). The incidence of diabetes has exhibited an alarming rate of increase over the years. In Malaysia, an increase in number of diabetics from 11.6% in 2006 to 15.2% in 2011 has been reported in the National Health and Morbidity Survey (NHMS) and a further increase to 21.6% by 2020 have been estimated (Mustapha & Azmi, 2013).
Meal planning for diabetics in Malaysia are affected by: poor nutritional understanding and low health consciousness among diabetics (Lim et al., 2010); public not only unaware of the existence of Malaysian Dietary Guidelines (MDG) but also not able to understand key words and key messages (Norimah et
al., 2010); older adults face difficulty understanding the food pyramid (Shahar et al., 2012); experts differ in opinion on meal plans (Sharkawi et al., 2014); and dietitians lack of time to build proper meal plans for patients (Bader et al., 2013). In addition, diabetics are not able to determine their own meal (Swift, 2012); difficult to balance food intakes because food selections are based on habits, preferences, ethnics and traditions (Bawadi & Al-Sahawneh, 2008; Brown et al., 2001); and individuals are incapable of translating conflicting nutrition guidelines (Dotson, 2011; Swift, 2012). Besides, meal planning should focus on both calories and intakes of nutrients (Dotson, 2011; Maillot et al., 2010).
Mathematical modelling may be an excellent approach to translate dietary recommendations into actual food plans and to develop food-based dietary guidelines (Masset et al., 2009).
Thus far, none of the few researches focused on meal planning problems for T2DM-affected individuals have applied the exchange lists currently practiced by dietitians. By using linear programming (LP), the current research has enhanced the current standard dietitian practice to design meals for T2DM-affected
individuals in a more straightforward and
understandable manner. In particular, it aimed at creating a database on exchange lists of Malaysian food with corresponding nutrient and energy contents for T2DM patients; and formulating LP model that will minimize the energy intakes while satisfying all specified requirement for them.
Methodology
Focus of Research
Four categories of diabetes mellitus exist: type 1 diabetes mellitus (T1DM), type 2 diabetes mellitus (T2DM), gestational diabetes mellitus and other specific types of diabetes. (American Diabetes Association, 2013, 2014). T2DM, most common type of diabetes, develops gradually most often among overweight individuals or obese and thin elderly. 99.3% of the 657 839 registered patients from 2009 to 2012 currently receiving diabetes care at healthcare clinics operated by Malaysian Ministry of Health (MOH) are diagnosed with T2DM. Figure 1 displays three highly populated groups of T2DM patients: age 45-54 (32.6%), age 55-64 (28.7%) and age 30-44 (20.1%) (Mustapha & Azmi, 2013).
Figure 1: Distribution of T2DM Patients in Malaysia. Retrieved from National diabetes registry report, p. 14, by Mustapha & Azmi, 2013, Kuala Lumpur: Ministry of Health.
T2DM is not prevalent in patients aged less than 18 years old. In addition, cognitive and physical
impairments of individuals aged 65 years and older increase with age (American Association of Diabetes Educators, 2009). Therefore, focus group for this research was T2DM adults aged 18 to 64 years old only but, with normal body weight and more importantly not treated with insulin.
Data used in research
Three lists referred in this research included: list of food items for meal planning; list of nutrient requirements for T2DM-affected individuals; and list of
food group requirements for T2DM-affected
individuals. The first list was extracted from the exchange lists of commonly consumed foods by Malaysians compiled by Shahar et al. (2009) from the Malaysian Food Composition Table in the Atlas of Food Exchanges and Portion Sizes (Atlas). By filtering items unsuitable for T2DM-affected individuals from the original exchange list of 109 food items from different food groups, a database of Malaysian food exchange list for T2DM-affected individuals was created. Final list containing 173 foods from different food groups and different meals and snacks along with types of food items (cooked or raw); household measurements (cup, bowl, spoon, etc.); weight of food per item; food energy; macronutrient (carbohydrate, protein and fat) contents; and sodium contents were compiled in a spreadsheet using Microsoft Excel 2010. The second list was sourced from Medical Nutrition Therapy: Guidelines for Type 2 Diabetes Mellitus (2nd
ed.) (Malaysian Dietitian's Association, 2013); Clinical Practice Guidelines: Management of Type 2 Diabetes Mellitus (4th ed.) (MOH, 2009); and Clinical Practice
Guidelines: Management of Type 2 Diabetes Mellitus (5th ed.) (MOH, 2015). The last list used information
from the Malaysian food pyramid (MOH, 2010).
Model development
This research has adopted the four stages in the Atlas by Shahar et al. (2009) and the model formulation by
Hamzah et al. (2011) with some suggested
modifications.
Stage 1 - Determine the Body Mass Index (BMI)
BMI was determined using the following equation (MOH, 2010):
BMI (kg m⁄ 2)=weight (kg)
height (m)2 (1)
Classifying individual’s weight according to the Atlas, the BMI for normal weight should be 18.5 to 24.9.
0.2 2.1
20.1 32.6
28.7
15.2
1.1 0
5 10 15 20 25 30 35
< 18 18-29 30-44 45-54 55-64 65-79 > 80
Distr
ibut
ion (%)
Stage 2 - Determine energy needs
The research has adopted the quick method equation from Shahar et al. (2009)
Energy requirement, E
= weight (kg) x quick method factor (kcal/kg) (2)
The quick method factor (QMF) differs by an individual’s activity level based on his weight status, thus only column 3 of Table 1 was applicable in calculating energy requirements for an individual with normal weight.
Table 1: QMF for Individual Based on Weight Status
Factor (kcal/kg)
Physical activity levela Underweight Normal Overweight
Sedentaryb 35 30
20-25
Moderate 40 35
Marked 45 40
Notes. Retrieved from Atlas of food exchanges and portions sizes (2nd ed.), p.
109, by Shahar et.al, 2009, Kuala Lumpur: MDC Publisher Sdn.Bhd.
a Categorized physical activity according to type, frequency, duration and
intensity
b Minimal body movement (reading, working at computer, watching television)
Energy distribution of carbohydrate, protein and fat in gram units were calculated using general factors 4,4, and 9 and the following equations (Shahar et al., 2009):
Grams of carbohydrate
=total energy allowed (kcal) × % carbohydrate
4 kcal/g
(3)
Grams of protein
=total energy allowed (kcal) × % protein
4 kcal/g
(4)
Grams of fat
=total energy allowed (kcal) × % fat
9 kcal/g
(5)
Stage 3: Development of linear programming model for exchange planner (LPMEP) — Convert Calories Allowances into Exchanges
Modifications were made to suit T2DM-affected individuals, thus energy was the main objective considered subject to all requirements of specific individual. Notations used were:
z = energy level, z = 1, 2, or 3; z = 1 (1500 kcal);
z = 2 (2000 kcal); and z = 3 (2500 kcal)
i = exchange group, i = 1, 2 or 3; i = 1 (carbohydrate);
i = 2 (protein); and i = 3 (fat)
j = food group, j = 1, 2,…,7; j = 1 (rice, cereal, grain products and starchy vegetables, Rc); j = 2 (fruits, Fr); j = 3 (non-fat milk, Mk); j = 4 (lean meat, poultry and meat substitute, Mt); j = 5 (fish, Fs);
j = 6 (legumes, Lg); and j = 7 (fat, Ft)
k = nutrient, k = 1, 2, and 3; k = 1 (carbohydrate);
k = 2 (protein); and k = 3 (fat)
Ez = minimum energy intakes at z energy level
ei,j = energy content for each j food group in i exchange group
xi,j = exchange portion for each j food group in i exchange group
yi,jk = nutrient k content for each j food group in i exchange group
LLz,k = lower limit of nutrient k at z energy level ULz,k = upper limit of nutrient k at z energy level LLz,i,j = lower limit of exchange portion requirement for
each of j food group in i exchange group at
z energy level
ULz,i,j = upper limit of exchange portion requirement for
each of j food group in i exchange group at
z energy level
Table 2 shows the summary of the proposed constraints in LPMEP based on guidelines from the second and third list mentioned earlier on.
Table 2: Summary of Constraints in LPMEP (in Stage 3)
Constraints Recommended
Food group requirements a
Rice, cereal, grain products and starchy vegetables ≥8 and ≤16
Fruits =2
Non-fat milk ≥1 and ≤3
Lean meat, poultry and meat substitute ≥1 and ≤4
Fish =2
Legumes ≥½ and ≤1
Macronutrient requirements b
Carbohydrate ≥45 and ≤60
Protein ≥15 and ≤20
Fat ≥25 and ≤35
Exchange group requirements c
Carbohydrate ≥45 and ≤60
a Varies according to energy level (i.e. 1500 kcal/d; 2000 kcal and 2500 kcal/d)
b, c In percentage of energy
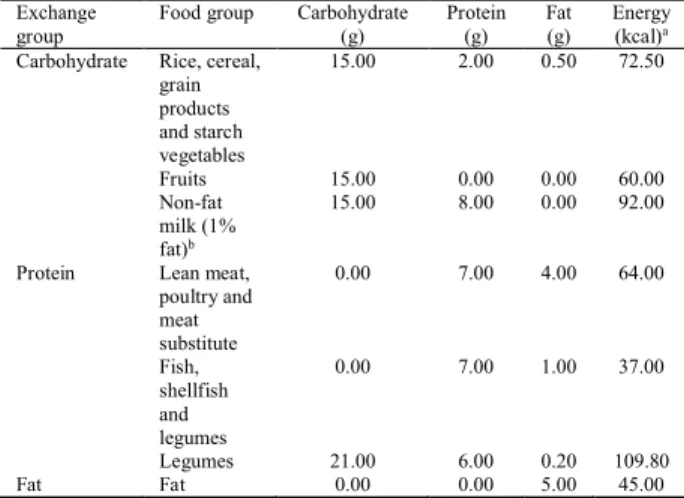
Table 3 shows macronutrients (carbohydrate, protein and fat) with a revised set of energy contents for each food group used to design the LPMEP.
Table 3: Food Exchange List with Macronutrient Content
Exchange group
Food group Carbohydrate
(g) Protein (g) Fat (g) Energy (kcal)a
Carbohydrate Rice, cereal,
grain products and starch vegetables
15.00 2.00 0.50 72.50
Fruits 15.00 0.00 0.00 60.00
Non-fat milk (1% fat)b
15.00 8.00 0.00 92.00
Protein Lean meat,
poultry and meat substitute
0.00 7.00 4.00 64.00
Fish, shellfish and legumes
0.00 7.00 1.00 37.00
Legumes 21.00 6.00 0.20 109.80
Fat Fat 0.00 0.00 5.00 45.00
Notes. Retrieved from Atlas of Food Exchanges and Portions Sizes (2nd ed.),
p. xiii, by Shahar et.al, 2009, Kuala Lumpur: MDC Publisher Sdn.Bhd.
a Energy was calculated using general factors of 4, 4 and 9.
b Non-fat milk has been considered as part of carbohydrate exchange group as it
fits the criteria by containing similar amount of carbohydrate
For each energy level, z (z = 1, 2, or 3):
minimize
= , ,
= , , + , , + , , (6)
subject to:
Macronutrient constraints
(Carbohydrate)
, ≤ , , + , , + , , ≤ , (7)
(Protein)
, ≤ , , + , , + , , ≤ , (8)
(Fat)
, ≤ , , + , , + , , ≤ , (9)
Exchange group constraint
(Carbohydrate exchange group)
, ≤ , , ≤ , (10)
Food group constraints
, , ≤ , ≤ , , if z = 1 or 2; j = 1, 3, 4 and 6 (11)
, = , , for j = 2 and 5; and if z = 3; j = 1, 2, 3,…,6 (12)
Non-negativity constraint
, ≥ 0 for i = 1, 2 and 3; j = 1, 2,…,7 (13)
Stage 4: Development of linear programming model for meal planner (LPMMP)—Convert the Exchanges into a Meal Plan
Different objectives were considered and applied to six different meals (breakfast, morning tea, lunch, evening tea, dinner, and supper). The overall 173 selected food items from different food groups, and different meals and snacks along with food energy; the macronutrient (carbohydrate, protein and fat) contents; and sodium contents were used to design the LPMMP. The notations used in stage 4 are presented below:
p = type of meal, p = 1, 2,…,6; p = 1 (breakfast);
p = 2 (morning tea); p = 3 (lunch); p = 4
(evening tea); p = 5 (dinner); and p = 6 (supper)
q = food code, q = 1, 2,…,173; q = 1, 2,…,26 for breakfast; q = 27, 28,…,36 for morning tea;
q = 37, 38,…,94 for lunch; q = 95, 96,…,105 for
evening tea; q = 106, 107,…,163 for dinner; and
q = 164, 165,…,173 for supper
r = nutrient, r = 1, 2,…,4; r = 1 (carbohydrate);
r = 2 (protein); r = 3 (fat); and r = 4 (sodium) E = minimum energy intakes
ep,q = energy content for each q food item in p type
of meal
xp,q = exchange portions for each q food item in p type of meal
yp,qr = nutrient r contents for each q food item in p type of meal
Lr = recommended requirements for nutrient Lp,q = recommended exchange portion for respective
q food item in p type of meal
The LPMMP has been mathematically formulated to achieve a palatable meal with realistic solutions as follows:
minimize
= , ,
= , , + , , + , ,
+ , , + , , + , , (14)
subject to:
Macronutrient constraints
(Carbohydrate)
, , + , , + , ,
+ , , + , , + , ,
≥ (15)
(Protein)
, , + , , + , ,
+ , , + , , + , ,
≥ (16)
(Fat)
, , + , , + , ,
+ , , + , , + , ,
Sodium constraint
, , + , , + , ,
+ , , + , , + , ,
≤ (18)
Food group constraint
, ∈
= , for p = 1, 2,…,6;
Q = {q|q = 1, 2,…, nj} (19)
Repetition constraint
, + , ≤ 1 (20)
Non-negativity constraint
, ≥ 0 for p = 1, 2,…,6;
q = 1, 2,…,173
(21)
Results and Discussion
Verification and validation of both LP models were done based on the analysis of results solved using the Solver Add-in function in Microsoft Excel 2010.
Investigating the outcomes of LPMEP
Different requirements of exchange portions comply with different levels of energy, z: 1500, 2000 and 2500 calories per day. Therefore, a sample data of three different individuals were used to investigate the outcomes of the model based on three different levels of energy allowances of respective individuals (see Table 4).
Table 4: Data of Three Different Individuals
Individual A Individual B Individual C
Height (m) 1.50 1.50 1.60
Weight (kg) 50.00 50.00 62.50
Physical activity level Sedentary Marked Marked
Energy allowances (kcal/d)a 1500 2000 2500
a Calculated using quick method formula based on weight and activity level of
an individual
Table 5 shows the optimal solution of the exchange portions for each food group according to each level of energy which corresponds to the imposed constraints. Since the solution has demonstrated minimal differences from the actual recommendations in MDG and the suggested exchanges portions of the model have
almost satisfied the minimum recommended
requirements for each food group, the optimal solution of the exchange portions (in stage 3) have succeeded at different energy level.
Table 5: Comparison of Optimal Solution of the Model Based on Three Different Individuals to the Recommended Requirements as in MDG
1500 kcal/d 2000 kcal/d 2500 kcal/d
Results MDG Model MDG Model MDG Model
Rice, cereal, grain products and starchy vegetables
8.00 8.13 12.00 12.00 16.00 16.00
Fruits 2.00 2.00 2.00 2.00 2.00 2.00
Non-fat milk 1.00 1.13 2.00 2.00 3.00 3.00
Lean meat, poultry and meat substitute
1.00 2.00 2.00 2.14 4.00 4.00
Fish 2.00 2.00 2.00 2.00 2.00 2.00
Legumes 0.50 0.50 1.00 1.00 1.00 1.00
Fat - 5.50 - 7.76 - 8.65
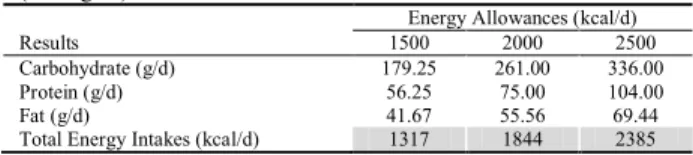
Based on the suggested exchange portions for each food group of the respective individuals, the optimal solution for macronutrient and energy intakes per day is presented in Table 6. Here, the energy intakes at each energy level were lower than the energy requirements of the respective individuals. Therefore, the objective of the model to obtain the solution at the least combination of energy contents for each food group has been achieved.
Table 6: Optimal Solution of the Macronutrient and Energy Intakes (in Stage 3)
Energy Allowances (kcal/d)
Results 1500 2000 2500
Carbohydrate (g/d) 179.25 261.00 336.00
Protein (g/d) 56.25 75.00 104.00
Fat (g/d) 41.67 55.56 69.44
Total Energy Intakes (kcal/d) 1317 1844 2385
Table 7 presents a detailed distribution of energy intakes (carbohydrate, protein and fat) at each different level of energy. Results indicate that LPMEP has achieved the recommended requirements of the macronutrient with all percentage values complying with the recommended proportions for T2DM-affected individuals at the least intakes of energy and has reached 100% of the energy requirements for those individuals.
Table 7: Contribution of the Macronutrient to the Total Energy Intakes
Energy Allowances (kcal/d)
Results Recommended 1500 2000 2500
Carbohydrate (%) ≥45 and ≤60 54.44 56.62 56.35
Protein (%) ≥15 and ≤20 17.08 16.27 17.44
Fat (%) ≥25 and ≤35 28.47 27.11 26.21
Total Energy Intakes (%) 100 100 100 100
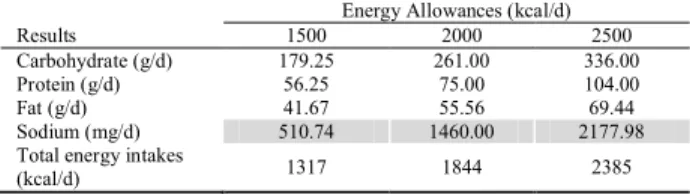
Investigating the outcomes of LPMMP
advised requirements in LPMEP with the exception of sodium which was introduced as one of the constraint for LPMMP. The solution for sodium intakes was possible to be found even when it was constrained below the maximum of 2400 milligrams per day as recommended requirements for diabetic patients.
Table 8: Optimal Solution of Nutrients and Energy Intakes of Model (in Stage 4)
Energy Allowances (kcal/d)
Results 1500 2000 2500
Carbohydrate (g/d) 179.25 261.00 336.00
Protein (g/d) 56.25 75.00 104.00
Fat (g/d) 41.67 55.56 69.44
Sodium (mg/d) 510.74 1460.00 2177.98
Total energy intakes
(kcal/d) 1317 1844 2385
The above discussions have concluded that daily intakes of food were feasible at the lowest intakes of energy, while also satisfying specified nutrients requirements and other restrictions on the model. Therefore, LPMMP has succeeded at fulfilling the objective of finding an optimal solution on food intakes for different meals and snacks at the minimum intakes of energy mainly for individuals with T2DM.
Conclusions
In general, this research has successfully used LP approach to mathematically formulate the current practices by dietitians in Malaysia. Both LPMEP and LPMMP have produced significant results that have satisfied the aim of this research to plan food intakes for T2DM patients at the least intakes of energy while fulfilling all prescribed requirements of respective individuals. The models are able to maintain consistency of meals or snacks consumptions, and appropriate choices of food and amounts; as well as observe intakes of energy and nutrients of a variety of food selection, thus the developed models may be helpful to individuals with T2DM. More importantly, research findings have enhanced the current slow iterative process and tedious manual calculations to plan meals for T2DM-affected individuals, thus dietitians can spend more time on educating, and relaying health messages to patients.
Acknowledgment
The authors appreciate the contribution of dietitians and all the staff at Department of Nutrition and Dietetic, Hospital Tuanku Fauziah, Kangar for their cooperation and valuable ideas throughout the process of doing this research.
References
American Association of Diabetes Educators. (2009). Special considerations in the management and education of older persons with diabetes. The Diabetes
Educator, 35(Supplement 3), 60S-63S. doi:
10.1177/0145721709349592
American Diabetes Association. (2013). Standards of medical care in diabetes—2013. Diabetes Care, 36(Supplement 1), S11-S66.
American Diabetes Association. (2014). Standards of medical care in diabetes—2014. Diabetes Care, 37(Supplement 1), S14-S80.
Bader, A., et al. (2013). Nutritional education through internet-delivered menu plans among adults with type 2 diabetes mellitus: Pilot study. JMIR Research Protocols, 2(2), e41. doi: 10.2196/resprot.2525
Bawadi, H. A., & Al-Sahawneh, S. A. (2008). Developing a meal-planning exchange list for traditional dishes in Jordan. Journal of the American Dietetic Association, 108(5), 840-846. doi: 10.1016/j.jada.2008.02.016
Brown, M. D., et al. (2001). Controlling calories—the simple approach. Diabetes Spectrum, 14(2), 110-112. doi: 10.2337/diaspect.14.2.110
Coates, P., & Flannery, T. (2010). Exercise your way to health: Type 2 diabetes: Exercise plans to improve your life. London, United Kingdom: Bloomsbury Publishing PLC.
Dotson, K. (2011). United States Patent No. 7,908,181 B2.
Hamzah, P., et al. (2011). Two-stage LP diet model for Malay households. Paper presented at the Humanities, Science and Engineering (CHUSER), 2011 IEEE Colloquium.
International Diabetes Federation. (2013). IDF Diabetes Atlas (6th ed.). Brussels, Belgium: International Diabetes Federation.
Maillot, M., et al. (2010). Individual diet modeling translates nutrient recommendations into realistic and individual-specific food choices. The American Journal of Clinical Nutrition, 91(2), 421-430. doi: 10.3945/ajcn.2009.28426
Malaysian Dietitian's Association. (2013). Medical nutrition therapy guidelines for type 2 diabetes mellitus (C. S. Tan & H. Kaur Eds. 2nd ed.): Ministry of Health, Malaysia
Masset, G., et al. (2009). Diet optimization methods can help translate dietary guidelines into a cancer prevention food plan. The Journal of Nutrition, 139(8), 1541-1548. doi: 10.3945/jn.109.104398
MedicineNet. (2013). Diabetes Guide - Introduction. Retrieved Jul 24 2015, 2015
Ministry of Health, Malaysia. (2009). Clinical practice guidelines: Management of type 2 diabetes mellitus (4th ed.). Putrajaya.
Ministry of Health, Malaysia. (2010). Malaysian dietary guidelines (2nd ed.). Malaysia: National Coordinating Committe on Food and Nutrition.
Ministry of Health, Malaysia. (2015). Clinical practice guidelines: Management of type 2 diabetes mellitus (5th ed.). Putrajaya.
Mustapha, F. I., & Azmi, S. (2013). National diabetes registry report (Vol. 1, 2009-2012). Kuala Lumpur: Ministry of Health, Malaysia.
Norimah, A. K., et al. (2010). Messages of the newly proposed Malaysian Dietary Guidelines (MDG): Do adults in Kuala Lumpur understand them? Malaysian Journal of Nutrition, 16(1), 113-123.
Shahar, S., et al. (2012). Development and analysis of acceptance of a nutrition education package among a rural elderly population: An action research study. BMC Geriatrics, 12, 24. doi: 10.1186/1471-2318-12-24
Shahar, S., et al. (2009). Atlas Makanan: Saiz Pertukaran dan Porsi (2nd. ed.). Kuala Lumpur: MDC Publisher Sdn Bhd.
Sharkawi, I., et al.(2014). Healthy eating: The preventive factors among Malaysians. Journal of Economics, Business and Management, 2(4), 257-261. doi: 10.7763/JOEBM.2014.V2.135
Soden, P. M., & Fletcher, L. R. (1992). Modifying diets to satisfy nutritional requirements using linear programming. British Journal of Nutrition, 68(03), 565-572. doi: 10.1079/BJN19920115