Fall Detection and Activity Recognition with Machine Learning
Mitja Luštrek and Boštjan Kaluža
Jožef Stefan Institute, Department of Intelligent Systems Jamova cesta 39, SI-1000 Ljubljana, Slovenia
E-mail: [email protected], [email protected]
Keywords: fall detection, activity recognition, posture and movement reconstruction, machine learning
Received: July 16, 2008
Due to the rapid aging of the European population, an effort needs to be made to ensure that the elderly can live longer independently with minimal support of the working-age population. The Confidence project aims to do this by unobtrusively monitoring their activity to recognize falls and other health problems. This is achieved by equipping the user with radio tags, from which the locations of body parts are determined, thus enabling posture and movement reconstruction. In the paper we first give a general overview of the research on fall detection and activity recognition. We proceed to describe the machine learning approach to activity recognition to be used in the Confidence project. In this approach, the attributes characterizing the user’s behavior and a machine learning algorithm must be selected. The attributes we consider are the locations of body parts in the reference coordinate system (fixed with respect to the environment), the locations of body parts in a body coordinate system (affixed to the user’s body) and the angles between adjacent body parts. Eight machine learning algorithms are compared. The highest classification accuracy of over 95 % is achieved by Support Vector Machine used on the reference attributes and angles.
Povzetek: Članek opisuje zaznavanje padcev in prepoznavanja aktivnosti nasploh ter izvedbo prepoznavanja aktivnosti s strojnim učenjem za potrebe projekta Confidence.
1
Introduction
The European population is aging due to the increase in life expectancy and decrease in birth rate. The percentage of population aged over 65 years is anticipated to rise from 17.9 % in 2007 to 53.5 % in 2060 [7]. As a consequence, the number of the elderly will exceed the society’s capacity for taking care of them. Thus an effort needs to be made to ensure that the elderly can live longer independently with minimal support of the working-age population. This is the primary goal of the EC Seventh Framework project Confidence [4].
The Confidence project will develop a ubiquitous care system to unobtrusively monitor the user, raise an alarm if a fall is detected and warn of changes in behavior that may indicate a health problem. This will improve the chances of a timely medical intervention and give the user a sense of security and confidence, thus prolonging his/her independence.
The user of the Confidence system will wear small inexpensive wireless tags on the significant places on the body, such as wrists, elbows, shoulders, ankles, knees and hips. The precise number and placement of tags will be defined during development. The tags may even be sewn into the clothes. The locations of the tags will be detected by a base station placed in the apartment and a portable device carried outside. This will make it possible to reconstruct the user’s posture and movement and to recognize his/her activity. Some tags may be placed in the user’s environment at locations such as bed
and chair to recognize activities such as the user lying in a bed and sitting in a chair. Finally, the user’s behavior will be interpreted as normal or abnormal. An alarm or warning will be raised in the latter case.
This paper describes machine learning methods for activity recognition [12][13] to be used in the Confidence project. We focus on the selection of attributes and machine learning algorithm to maximize the recognition accuracy. The activities to recognize are falling, the process of lying down, the process of sitting down, standing/walking, sitting and lying. Falling is important in itself because fall detection is one of the main goals of the project. For the processes of lying down and sitting down, we wanted to see whether they can be distinguished from falling. The recognition of standing/walking, sitting and lying is needed to detect changes in behavior, such as the user walking less and lying more, which may indicate a health problem.
2
Related work
We divide the work on fall detection and activity recognition into four approaches presented in the following four subsections. They are distinguished by the equipment used and by the features extracted from sensor data.
The first approach is based on accelerometers. An accelerometer is a device for detecting the magnitude and direction of the acceleration along a single axis or along multiple axes. Three-axis accelerometers are typically used. By detecting the acceleration caused by the earth’s gravity, one can also compute the accelerometer’s angle with respect to the earth.
The second approach uses gyroscopes, which measure orientation. A gyroscope consists of a spinning wheel whose axle is free to take any orientation. It can measure the orientation along one axis or multiple axes. By equipping an object with the gyroscope(s) to measure the orientation along three axes, it is possible to exactly determine the object’s orientation and the changes in orientation, from which the angular velocity can be computed.
The third approach is denoted visual detection without posture reconstruction. It is based on extracting input data from still images or from video. Various computer vision techniques are applied to the input data, but the human posture is not reconstructed explicitly.
The fourth approach, named visual detection with posture reconstruction, is based on 3D locations of markers placed on an object, typically human body. The approach also uses video recordings, but, in contrast to the third approach, the visual information is used only to reconstruct the 3D locations of the markers. Additional processing uses the markers’ coordinates as input data. If a sufficient number of markers are provided, it is possible to reconstruct the shape of an object, which in our case means the human posture.
2.1
Accelerometers
The most common and simple methodology for fall detection is using a tri-axial accelerometer with threshold algorithms [3][10]. Such algorithms simply raise the alarm when the threshold value of acceleration is reached. There are several sensors with hardware built-in fall detection [1][5][15], having the accuracy of over 80 %.
Zhang et al. [25] designed a fall detector based on Support Vector Machine (SVM) algorithm. The detector was using one waist-worn accelerometer. The features for machine learning were the accelerations in each direction, changes in acceleration etc. Their method detected falls with 96.7 % accuracy. Researches embedded an accelerometer in a cell phone [24] and detected falls with the proposed method. The cell phone was put in a pocket of clothes or hanged around the neck, which made the detection more difficult as with the body-fixed sensor. The cell-phone system correctly raised the alarm in 93.3 % of the cases.
Tapia et al. [18] presented a real-time algorithm for automatic recognition of not only physical activities, but also, in some cases, their intensities, using five wireless accelerometers and a wireless heart rate monitor. The accelerometers were placed at shoulder, wrist, hip, upper part of the thigh and ankle. The features, e.g., FFT peaks, variance, energy, correlation coefficients, were extracted from time and frequency domains using a predefined window size on the signal. The classification of activity was done with C4.5 and Naïve Bayes classifiers into three groups: postures (standing, sitting etc.), activities (walking, cycling etc.) and other activities (running, using stairs etc). For these three classes they obtained the recognition accuracy of 94.6 % using subject-dependent training and 56.3 % using subject-independent training.
Willis [21] developed a fall detection system based on belief network models, which enable probabilistic modeling of scenarios (e.g., normal walking, tripping/stumbling and running) and the transitions between them. The sensors were placed under the heel and toe, which made it possible to reconstruct gait cycle and to detect falls. The accuracy was not reported.
Researchers using accelerometers give a lot of attention to the optimal sensor placement on the body [3][10]. A head-worn accelerometer provides excellent impact detection sensitivity, but its limitations are usability and user acceptance. A better option is a waist-worn accelerometer. The wrist did not appear to be an optimal site for fall detection. Some researchers made a step further and used accelerometers for trying to recognize the impact and posture after the fall [11].
In the Confidence system, accelerations could in principle be derived from the movement of tags. However, we believe this approach to be unreliable: first, because the acceleration is the second derivative of tag location and as such strongly affected by sensor noise, and second, because the data acquisition frequency in Confidence is expected to be relatively low. The studies of sensor placement may be valuable for deciding where to place tags in Confidence.
2.2
Gyroscopes
Bourke and Lyons [2] introduced a threshold algorithm to distinguish between normal activities (sitting down and standing up, lying down and standing up, getting in and out of a car seat, walking etc.) and falls. The ability to discriminate was achieved using a bi-axial gyroscope mounted on the torso, measuring pitch and roll angular velocities. They applied a threshold algorithm to the peaks in the angular velocity signal, angular acceleration and torso angle change. The system proved 100 % successful in fall detection.
2.3
Visual detection without posture
reconstruction
Vishwakarma et al. [20] presented a video approach for fall detection. First, they eliminated the background of the video and extracted a set of features from the remaining objects’ bounding boxes, e.g., the aspect ratio, horizontal and vertical gradients etc. In the next step they detected falls based on the angle between an object’s bounding box and the ground. The final step was fall confirmation, which was rule-based, e.g., the abovementioned angle had to be less than 45°. The method achieved 95 % accuracy on single-object fall detection and 64 % accuracy on multiple objects.
Fu et al. [8] described a vision system designed to detect accidental falls in elderly home care applications. They used a temporal contrast vision sensor, which extracts changing pixels from the background. An algorithm was observing the dynamic of motion and reported falls when it indicated significant changes in the vertical downward direction. They were able to distinguish falls from normal human behaviors, such as walking, crouching down and sitting down. The accuracy was not reported.
The proposed methods are quite capable of dealing with fall detection, but it is not clear how to adapt them to the sensor data available in the Confidence system.
2.4
Visual detection with posture
reconstruction
Wu [23] studied unique features of the velocity during normal and abnormal (i.e. fall) activities so as to make the automatic detection of falls during the descending phase of a fall possible. Normal activities included walking, rising from a chair and sitting down, descending stairs, picking up an object from the floor, transferring in and out of a tub and lying down on a bed. The study provides exhaustive velocity parameters for fall detection, gathered by three markers placed on the posterior side of the torso, recorded by three cameras with the sampling rate of 50 Hz. The aim of the study was to suggest velocity characteristics, so the author did not actually implement automatic fall detection.
Qian et al. [16] introduced a gesture-driven interactive dance system capable of real-time feedback. They used 41 markers on the body recorded by 8 cameras with the frame rate of 120 Hz to construct a human body model. The model was used to extract features such as torso orientation, angles between adjacent body parts etc., which was used to represent different gestures. Each gesture was statistically modeled with a Gaussian random vector defined as the statistical distribution of the features for that gesture. To recognize a new pose, the likelihood of its feature vector given the vector of each known gesture was computed. The new pose was classified as the gesture for which this likelihood was the largest. Experimental results with two dancers performing 21 different gestures achieved gesture recognition rate of 99.3 %.
Sukthankar and Sycara [17] presented a system that reconstructs the users’ posture and recognizes pre-defined behaviors. The data were captured with 43 body markers and 12 cameras with the sampling rate of 120 Hz. They constructed a human body model from the raw marker coordinates, and computed features, e.g. the angles between body parts, limb lengths, range of motion etc. from the model. Learning was performed using SVM. The method achieved 76.9 % accuracy in detecting the following elementary activities: walking, running, sneaking, being wounded, probing, crouching, and rising. Behavior was defined as a sequence of elementary activities and was modeled with Hidden Markov models. The authors defined a number of behavior models and classified a new sequence of activities into the model that fit it best.
The markers in the proposed systems have the same role as the tags in the Confidence system. The methods by Qian et al. and even more so by Sukthankar and Sycara inspired the approach we used for activity recognition in Confidence. We are not aware of anybody having used this kind of methods for fall detection, though.
3
Input data
The goal of our research was to classify the user’s behavior into one of the following activities: falling, lying down, sitting down, standing/walking, sitting and lying. To obtain training data for a classifier to recognize these activities, we recorded 45 examples of the behavior of three persons. Each recording consisted of multiple activities:
3 × 15 recordings of falling, consisting of standing/walking, falling and lying.
3 × 10 recordings of lying down, consisting of standing/walking, lying down and lying. 3 × 10 recordings of sitting down, consisting of walking, sitting down and sitting.
3 × 10 recordings of walking.
4
Attributes for machine learning
Finding the appropriate representation of the user’s behavior activity was probably the most challenging part of our research. The behavior needs to be represented with simple and general attributes, so that the classifier using these attributes will also be general and work well on behaviors different from those in our recordings. It is not difficult to design attributes specific to our recordings; such attributes would work well on them. However, since our recordings captured only a small part of the whole range of human behavior, overly specific attributes would likely fail on general behavior.
The attribute vector from which the classifier infers the user’s activity consists of ten consecutive snapshots of the user’s posture, describing one second of activity. When multiple activities took place within a given second, the attribute vector was assigned the longest one.
We designed three sets of attributes describing the user’s behavior. Reference attributes are expressed in the reference coordinate system, which is fixed with respect to the user’s environment. Body attributes are expressed in a coordinate system affixed to the user’s body. Angle attributes are the angles between adjacent body parts.
4.1
Reference attributes
When selecting reference attributes, we ignored x and y coordinates. These coordinates describe the user’s location in the environment, but the activities of interest can generally take place at any location.
In the list of reference attributes, the upper index t
indicates the time within the one-second interval: t = 1 ... 10. The lower index i indicates the tag: i = 1 ... 12. The lower index R indicates the reference coordinate system and distinguishes reference attributes from those belonging to the other two sets.
ztiR … z coordinate of tag i at time t
vtiR … the absolute velocity of the tag
vtziR … the velocity of the tag in the z direction
dtijR ... the absolute distance between the tags i and j; j = i + 1 ... 12
dtzijR ... the distance between tags i in j in the z direction
4.2
Body attributes
Body attributes are expressed in a coordinate system affixed to the user’s body. This makes it possible to observe x and y coordinates of the user’s body parts, since these coordinates no longer depend on the user’s location in the environment.
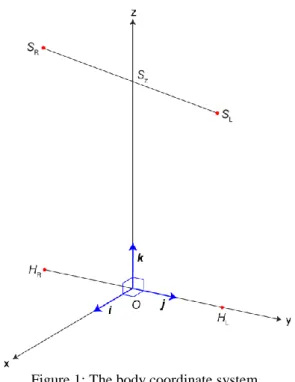
The body coordinate system is shown in Figure 1. Its origin O is at the mid-point of the line connecting the hip tags (HR and HL for the right and left hip respectively). This line also defines the y axis, which points towards the left hip. The z axis is perpendicular to the y axis, touches the line connecting both shoulder tags (SR and SL for the right and left shoulder respectively) at point Sz, and points upwards. The x axis is perpendicular to the y and z axes and points forwards.
Figure 1: The body coordinate system.
In order to translate reference coordinates into body coordinates, we need to express the origin O and basis (i,
j, k) of the body coordinate system in the reference coordinate system. Note that bold type denotes vectors and x denotes a vector from the origin to the point X. Equation (1) expresses the origin of the body coordinate system in the reference coordinate system.
(1) Equation (2) gives us the basis vector j.
(2) To obtain k, Equation (3) is first used to calculate sz.
(3)
Once sz is calculated, Equation (4) gives us k. (4) Finally we obtain i using Equation (5).
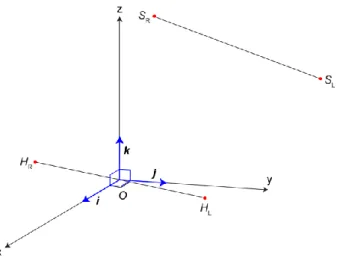
Figure 2: The body coordinate system with reference z axis.
In the body coordinate system with the reference z axis, the origin is again calculated with Equation (1). The basis vector k equals the basis vector k in the reference coordinate system: k = (0, 0, 1). The basis vector i is perpendicular to k and to the vectorfrom O to HL, which is expressed with Equation (6).
(6) The basis vector j is obtained with Equation (7).
(7) To finally translate the coordinates in the reference coordinate system into the coordinates in either of the body coordinate systems, Equation (8) is used. The vector pR = (xR, yR, zR, 1) corresponds to the point (xR, yR,
zR) in the reference coordinate system. The vector pB = (xB, yB, zB, 1) corresponds to the point (xB, yB, zB) in a body coordinate system. TR→B is the transformation matrix from the reference to the body coordinate system. Notation i(B)R refers to the basis vector i belonging to the body coordinate system, expressed in the reference coordinate system.
(8)
Body attributes (in either of the body coordinate systems) are labeled with a lower index B:
(xtiB, ytiB, ztiB) ... coordinates of the tag i at the time t
vtiB … absolute velocity of the tag (φt
iB, θ t
iB) … the angles of movement of the tag with respect to the z axis and xz plane
If a body coordinate system is used, the attributes describing its location, orientation and movement with respect to the reference coordinate system are added to the attribute vector:
ztOR ... z coordinate of the origin of the body coordinate system
(Φt OR, Θ
t
OR) ... the direction of the x axis of the body coordinate system with respect to the z axis and xz plane
vtOR … absolute velocity of the origin of the body coordinate system
(φt
OR, θtOR) ... the angles of movement of the origin of the body coordinate system with respect to the z axis and xz plane
So far we expressed body attributes in the body coordinate system of each snapshot of the user's posture. However, the attributes in all ten snapshots within a one-second interval can be expressed in the coordinate system belonging to the first snapshot in the interval. This captures the changes in the x and y coordinates between snapshots within the interval. First-snapshot body attributes are the same as body attributes, except that they are labeled with Bf instead of B. The attributes describing the location and orientation of the first-snapshot body coordinate system with respect to the reference coordinate system are somewhat different, though:
zOfR … z coordinate of the origin of the first-snapshot body coordinate system
(ΦOfR, ΘOfR) … the direction of the x axis of the first-snapshot body coordinate system with respect to the z axis and xz plane
4.3
Angle attributes
The paper will not delve into the details of the computation of body angles. The angles between body parts that rotate in more than one direction are expressed with quaternions:
qtSL and qtSR ... left and right shoulder angles with respect to the upper torso at the time t qtHL and qtHR ... left and right hip angles with respect to the lower torso
qtT ... the angle between the lower and upper torso
αt EL, α
t ER, α
t
KL and α t
KR ... left and right elbow angles, left and right knee angles
5
Machine learning experiments
Forest, Bagging and Adaboost M1 boosting. The algorithms were implemented in Weka [22], an open-source machine learning suite. Default parameter settings were used in all cases, except for Adaboost M1, where the algorithm to train the base classifier was replaced with Fast Decision Tree Learner. Machine learning experiments proceeded in two steps.
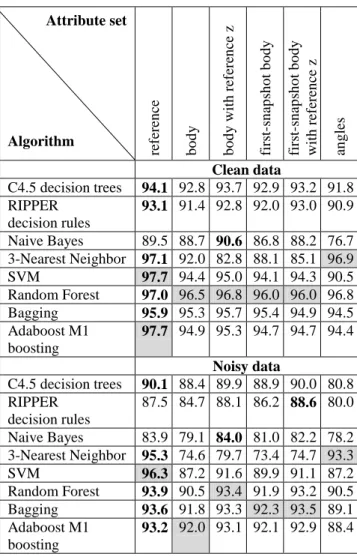
In the first step of machine learning experiments we compared the classification accuracy of the eight machine learning algorithms and of all single attributes sets described Section 4: reference, body, body with reference z, first-snapshot body, first-snapshot body with reference z and angles. The results are shown in Table 1. The accuracy was computed with ten-fold cross-validation. The accuracy of the best attribute set for each algorithm is in bold type; the accuracy of the best algorithm for each attribute set is on gray background.
Attribute set
Algorithm
ref
er
en
ce
body bo
d
y
with
r
ef
er
en
ce
z
fir
st
-s
n
ap
sh
o
t b
o
d
y
fir
st
-s
n
ap
sh
o
t b
o
d
y
with
r
ef
er
en
ce
z
an
g
les
Clean data
C4.5 decision trees 94.1 92.8 93.7 92.9 93.2 91.8 RIPPER
decision rules
93.1 91.4 92.8 92.0 93.0 90.9 Naive Bayes 89.5 88.7 90.6 86.8 88.2 76.7 3-Nearest Neighbor 97.1 92.0 82.8 88.1 85.1 96.9 SVM 97.7 94.4 95.0 94.1 94.3 90.5 Random Forest 97.0 96.5 96.8 96.0 96.0 96.8 Bagging 95.9 95.3 95.7 95.4 94.9 94.5 Adaboost M1
boosting
97.7 94.9 95.3 94.7 94.7 94.4 Noisy data
C4.5 decision trees 90.1 88.4 89.9 88.9 90.0 80.8 RIPPER
decision rules
87.5 84.7 88.1 86.2 88.6 80.0 Naive Bayes 83.9 79.1 84.0 81.0 82.2 78.2 3-Nearest Neighbor 95.3 74.6 79.7 73.4 74.7 93.3 SVM 96.3 87.2 91.6 89.9 91.1 87.2 Random Forest 93.9 90.5 93.4 91.9 93.2 90.5 Bagging 93.6 91.8 93.3 92.3 93.5 89.1 Adaboost M1
boosting
93.2 92.0 93.1 92.1 92.9 88.4
Table 1: Classification accuracy for all the algorithms and all single attribute sets.
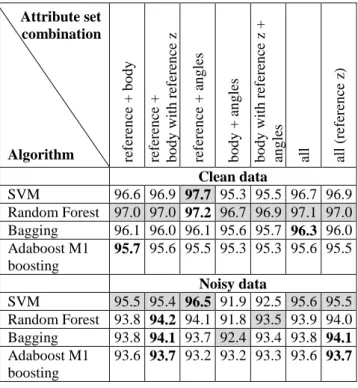
For the next step of machine learning experiments, we retained the best algorithms and the best attribute sets. To rank them, we compared the classification accuracies of all pairs of algorithms and all pairs of attribute sets. Table 2 shows the number of comparisons in which a given algorithm statistically significantly (p < 0.05) wins over another algorithm, minus the number of comparisons where it loses. Table 3 shows the same for
the attribute sets. The accuracies of the algorithms and attribute sets selected for the second step are on grey background; the accuracies of the best algorithm and attribute set are in bold type. Since the second step consisted of combining the attribute sets, the selection of the sets to retain was based more on redundancy than classification accuracy. Thus we retained angles, but not the two first-snapshot body attributes (even though the latter have a higher accuracy), because first-snapshot body attributes are very similar to regular body attributes. We chose body attributes with the body z axis over body attributes with the reference z axis (even though the latter again have a higher accuracy), because the reference z coordinates are already included in the reference attributes. The comparison between every-snapshot and first-snapshot body attributes slightly favors the latter, but we nevertheless retained the former because they are computed more quickly.
Algorithm Wins – losses
Clean Noisy
C4.5 decision trees –12 –10
RIPPER decision rules –18 –21
Naive Bayes –38 –34
3-Nearest Neighbor –13 –16
SVM 13 11
Random Forest 38 23
Bagging 17 25
Adaboost M1 boosting 13 22
Table 2: The number of wins – the number of losses of every algorithm against the others for clean and noisy
data
Attribute set Wins – losses
Clean Noisy
reference 25 28
body –2 –21
body with reference z 9 20
first-snapshot body –11 –9
first-snapshot body with reference z –2 12
angles –19 –30
Table 3: The number of wins – the number of losses of every single attribute set against the others for clean and
noisy data
Attribute set combination
Algorithm refer
en
ce
+
b
o
d
y
ref
er
en
ce
+
b
o
d
y
with
r
ef
er
en
ce
z
ref
er
en
ce
+
an
g
les
b
o
d
y
+
an
g
les
b
o
d
y
with
r
ef
er
en
ce
z
+
an
g
les
all all
(r
ef
er
en
ce
z
)
Clean data
SVM 96.6 96.9 97.7 95.3 95.5 96.7 96.9 Random Forest 97.0 97.0 97.2 96.7 96.9 97.1 97.0 Bagging 96.1 96.0 96.1 95.6 95.7 96.3 96.0 Adaboost M1
boosting
95.7 95.6 95.5 95.3 95.3 95.6 95.5 Noisy data
SVM 95.5 95.4 96.5 91.9 92.5 95.6 95.5 Random Forest 93.8 94.2 94.1 91.8 93.5 93.9 94.0 Bagging 93.8 94.1 93.7 92.4 93.4 93.8 94.1 Adaboost M1
boosting
93.6 93.7 93.2 93.2 93.3 93.6 93.7
Table 4: Classification accuracy for the retained algorithms and combinations of attribute sets.
6
Conclusion
We first investigated the work done so far in the area of fall detection and activity recognition. Fall detection methods were based on the accelerations and velocities of body parts and on visual cues. These data will not be available in the Confidence system, at least not directly. What will be available are the locations of body parts. Accelerations and velocities can be computed from the changes in these locations, but with questionable accuracy. We decided to use velocities, since they are expected to be more accurate than accelerations, and the locations of body parts themselves. Some work on activity recognition was also based on accelerations and velocities, but there were approaches better suited to Confidence as well. We were mostly inspired by the work of Sukthankar and Sycara [17], who used machine learning on attributes representing the body posture.
We then examined various attributes and machine learning algorithms to detect six common activities. The attributes were the coordinates of body parts in the reference coordinate system, the coordinates of body parts in four different body coordinate systems and the angles between adjacent body parts. We first compared the attribute sets in isolation and then in combinations. The reference coordinates were the best single attribute set. In combination with the angles, they gave the highest overall classification accuracy, although it should be noted that all the combinations were close in performance. We compared eight machine learning algorithms, from which Support Vector Machine produced the most accurate classifier: the accuracy on clean data was 97.7 % and on noisy data 96.5 %. It was closely followed by Random Forest, Bagging and Adaboost M1 boosting.
There are four directions for future work. The first is tuning the machine learning algorithms discussed in this paper and augment them with feature selection techniques. This is done relatively easily, but will probably not contribute much to the classification accuracy. The second direction is to take into account the temporal information: each activity takes usually lasts for some time and some transitions between activities are more likely than others. This information can help us correct some erroneous classifications, e.g., a single falling in a long sequence of walking must be an error. The third direction is using fewer than 12 tags, since a potential product resulting from the Confidence project is unlikely to use the full complement of tags. The last direction for future work is experimenting with recordings of additional behaviors. These may be variations of the existing ones to test the robustness of the classifier or entirely new activities to increase the classifier’s scope.
Concerning the Confidence project, the results described in this paper are encouraging. The classification accuracy of over 95 % leads us to believe that once the planned improvements are implemented, the frequency of false alarms will be low enough for the Confidence system to be useful.
Acknowledgement
This work was supported by the Slovenian Research Agency under the Research Programme P2-0209 Artificial Intelligence and Intelligent Systems. The research leading to these results has also received funding from the European Community's Framework Programme FP7/2007–2013 under grant agreement nº 214986. Consortium: CEIT (coordinator), Fraunhofer Institute for Integrated Circuits (IIS), Jožef Stefan Institute, Ikerlan, COOSS Marche, University of Jyväskylä, Umeå Municipality, eDevice, CUP2000 S.p.A/Ltd., ZENON S.A. Robotics & Informatics. We would like to thank Matjaž Gams for suggestions and discussion and Barbara Tvrdi for help with programming.
References
[1] AlertOne Services, Inc. iLife™ Fall Detection
Sensor. http://www.falldetection.com, 2008-07-18. [2] Bourke, A. K., and Lyons, G. M. A threshold-based
fall-detection algorithm using a bi-axial gyroscope sensor. Medical Engineering & Physics, vol. 30, issue 1, pp. 84–90, 2006.
[3] Bourke, A. K., Scanaill, C. N., Culhane, K. M., O'Brien, J. V., and Lyons, G. M. An optimum accelerometer configuration and simple algorithm for accurately detecting falls. In Proceedings of the 24th IASTED international Conference on Biomedical Engineering, pp. 156–160, 2006. [4] Confidence. http://www.confidence-eu.org,
[5] Doughty, K., Lewis, R., and McIntosh, A. The design of a practical and reliable fall detector for community and institutional telecare. Journal of Telemedicine and Telecare, vol. 6, pp. 150–154, 2000.
[6] eMotion. Smart motion capture system. http://www. emotion3d.com/smart/smart.html, 2008-09-15. [7] Eurostat. http://epp.eurostat.ec.europa.eu,
2008-09-09.
[8] Fu, Z., Culurciello, E., Lichtsteiner, P., and Delbruck, T. Fall detection using an address-event temporal contrast vision sensor. In Proceedengs of the IEEE International Symposium on Circuits and Systems – ISCAS 2008, pp. 424–427, 2008. [9] Kaluža, B., and Luštrek M.. Fall Detection and
Activity Recognition Methods for the Confidence Project: A Survey. In Proceedings of the 12th International Multiconference Information Society 2008, vol. A, pp. 22–25, 2008.
[10] Kangas, M., Konttila, A., Lindgren, P., Winblad, P., and Jamsa, T. Comparison of low-complexity fall detection algorithms for body attached accelerometers. Gait & Posture, vol. 28, issue 2, pp. 285–291, 2008.
[11] Kangas, M., Konttila, A., Winblad, I., and Jamsa, T.
Determination of simple thresholds for accelerometry-based parameters for fall detection. In Proceedings of the 29th Annual International Conference of the IEEE, Engineering in Medicine and Biology Society, pp. 1367–1370, 2007.
[12] Luštrek, M., and Gams, M. Posture and movement recognition from locations of body tags. European Conference on Ambient Intelligence, "Ambient Assisted Living" and "Personal Health" – between Paragdigms, Projects and Products workshop, 2008. [13] Luštrek, M., and Gams, M. Prepoznava položaja
telesa s strojnim učenjem. In Proceedings of the 12th International Multiconference Information Society 2008, vol. A, pp. 30–33, 2008.
[14] Maybeck, P. S. Stochastic models, estimation, and control. Mathematics in Science and Engineering 141, 1979.
[15] Noury, N., Barralon, P., Virone, G., Boissy, P., Hamel. M., and Rumeau, P. A smart sensor based on rules and its evaluation in daily routines. In Proceedings of the 25th Annual International
Conference of the IEEE, Engineering in Medicine and Biology Society, vol. 4, pp. 3286–3289, 2003. [16] Qian, G., Guo, F., Ingalls, T., Olson, L., James, J.,
and Rikakis, T. A Gesture-Driven Multimodal Interactive Dance System. In Proceedings of the International Conference on Multimedia and Expo, Taipei, Taiwan, 2004.
[17] Sukthankar, G., and Sycara, K. A Cost Minimization Approach to Human Behavior Recognition. In Proceedings of the Fourth international Joint Conference on Autonomous Agents and Multiagent Systems 2005, pp. 1067–1074, 2005.
[18] Tapia, E. M., Intille, S. S., Haskell, W., Larson, K., Wright, J., King, A., and Friedman, R. Real-Time Recognition of Physical Activities and Their Intensities Using Wireless Accelerometers and a Heart Rate Monitor. In Proceedengs of the 11th IEEE International Symposium on Wearable Computers, pp. 37–40, 2007.
[19] Ubisense. http://www.ubisense.net, 2008-09-15. [20] Vishwakarma, V., Mandal, C., and Sura, S.
Automatic Detection of Human Fall in Video.
Pattern Recognition and Machine Intelligence: Automatic Detection of Human Fall in Video, pp. 616–623, 2007.
[21] Willis, D. J. Ambulation Monitoring and Fall Detection System using Dynamic Belief Networks. PhD Thesis, School of Computer Science and Software Engineering, Monash University, 2000. [22] Witten, I. H., and Frank, E. Data Mining: Practical
machine learning tools and techniques, 2nd Edition. Morgan Kaufmann, San Francisco, USA, 2005. [23] Wu, G. Distinguishing fall activities from normal
activities by velocity characteristics. Journal of Biomechanics, vol. 33, issue 11, pp. 1497–1500, 2000.
[24] Zhang, T., Wang, J., Liu, P., and Hou, J. Fall Detection by Embedding an Accelerometer in Cellphone and Using KFD Algorithm. International Journal of Computer Science and Network Security, vol. 6, issue 10, 2006.