A Fuzzy Coding Approach to Data
Processing Using the Bar
Angelos Markos
∗†
doi:10.23755/rm.v33i0.387
Abstract
The bar is an alternative to Likert-type scale as a response format option used in closed-form questionnaires. An important advantage of using the bar is that it provides a variety of data post-processing options (i.e., ways of partitioning the values of a continuous variable into discrete groups). In this context, continuous variables are usually divided into length or equal-area intervals according to a user-specified distribution (e.g. the Gaussian). However, this transition from continuous into discrete can lead to a signif-icant loss of information. In this work, we present a fuzzy coding of the original variables which exploits linear and invertible triangular member-ship functions. The proposed coding scheme retains all of the information in the data and can be naturally combined with an exploratory data analysis technique, Correspondence Analysis, in order to visually investigate both linear and non-linear variable associations. The proposed approach is illus-trated with a real-world application to a student course evaluation dataset.
Keywords: Likert scale; Bar; Correspondence Analysis; fuzzy coding; tri-angular membership functions
2010 AMS subject classifications: 62P25.
∗Department of Primary Education, Alexandroupolis, Greece; [email protected] †cAngelos Markos. Received: 31-10-2017. Accepted: 26-12-2017. Published: 31-12-2017.
1
Introduction
The closed-form questionnaire is the most commonly used data collection tool or instrument in quantitative studies. Likert scales are commonly used to measure attitude, providing a range of responses to a given question or statement (see e.g., [5]). Typically, Likert scales have an odd number of response categories, 3, 5
or 7, representing the degree of agreement with the corresponding statements. For example, a five-point scale ranges from1= strongly disagree to5= strongly agree. Although the response categories have a rank order, the invervals between values are frequently presumed equal. This assumption is often convenient in that it permits the calculation of descriptive and inferential statistics suitable for continuous variables.
The processing of questionnaire data obtained via Likert scales has certain ad-vantages, but there are also major shortcomings [4, 5, 13, 27]. Firstly, the desicion on the number of categories of a Likert-type scale may affect the outcome of sta-tistical analysis. Too many or too few response categories, may cause respondent fatigue with a corresponding drop-off in response rate and reliability [3]. Second, there is evidence that participants would give different ratings when using differ-ent versions of the same Likert-type scale [12]. This indicates that the decision on the verbal labels that will be used to describe the numerical values of a Likert scale is not a trivial one. Such a problem also involves a number of social and psychologica factors. [27]. A third issue is related to the legitimacy of assuming a continuous or interval scale for Likert-type categories, instead of an ordinal level of measurement. In fact, many authors advocate against this practice, given that the appropriate descriptive and inferential statistics differ for ordinal and interval variables [13]. Therefore, if the wrong statistical technique is used, researchers increase the chance of coming to the wrong conclusions about their findings. Fi-nally, the fixed number of response categories limits the options for data process-ing and does not allow the direct comparison with the results of similar studies, where the same questions but with a different number of response categories were used [27].
Conse-quently, the bar marks a transition from discrete into continuous and from single valued into fuzzy or multivalued [27].
A series of studies, mostly in quantitative linguistics [15, 16, 17, 18, 19], have shown that the bar can be widely used to a broad range of populations and settings due to its simplicity and adaptability. A questionnaire developed using the bar instead of a Likert scale takes less time to complete and no training or special skill of the participants is required other than to possess an understanding of distance on a ruler. Moreover, minimal translation difficulties can easily lead to a cross-cultural adaptation of a questionnaire. Recently, [19] developed a software for using the bar in online questionnaires.
The most important merit of using the bar, however, is the flexibility it of-fers to practitioners with regard to data analysis, without having to re-administer the questionnaire. After data collection, the analyst can decide how to split each variable at appropriate intervals. Instead, in the case of Likert-type scales, such a decision has to be taken before data collection and does not give any room for testing alternative ways of data processing. The number of groups per variable is chosen according to the distribution of the variable at hand. In this context, continuous variables are usually divided into equal-length or equal-area intervals according to a desirable distribution (e.g., the Gaussian or the parabola). A de-tailed justification of such a discretization scheme is given in [27]. Hereafter, we will refer to this procedure by crisp coding.
Crisp coding of a continuous value to a category obviously loses a substantial part of the original information and, subsequently, the advantage of continuity pro-vided using the bar. This is because the original values are usually not uniformly distributed in the newly created intervals. To alleviate this problem, we discuss an alternative, fuzzy coding of the original data, which exploits linear and invertible triangular membership functions. A side advantage of the proposed fuzzy coding scheme is that the resulting data matrix can be given as input to Correspondence Analysis, a multivariate technique that can visualize both linear and non-linear variable associations.
Section 2 presents the rationale behind utilizing a fuzzy instead of a crisp cod-ing scheme to data obtained from questionnaires uscod-ing the bar. Section 3 offers a brief introduction to Correspondence Analysis applied on fuzzy coded data. The proposed approach is illustrated with a real-world application in Section 4. Sec-tion 5 concludes the paper.
2
Crisp versus fuzzy coding of continuous variables
LetA, B, C, . . .be a number of continuous variables whose values range from
the bar. A common discretization scheme is to split each variable into five inter-vals of equal length,1to5, as follows:
1 : [0−12.4],2 : [12.4−24.8),3 : [24.8−37.2),4 : [37.2−49.6),5 : (49.6−62].
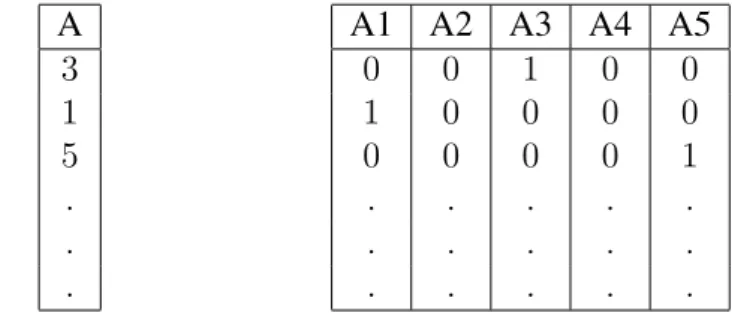
Then, for each subject a binary vector can be formed to summarize any value of each variable. For example, the value35.7for variableAlies in the third interval and can be coded into [0 0 1 0 0]. This type of binary coding is commonly referred to ascrisp coding(e.g. see [1]) and a row-wise concatenation of all binary vectors forms a table,ZA, for variableA. The row margins ofZAare the same, equal to a column of ones. The so-called indicator matrix, denoted by Z, is composed of a set of subtables,ZA,ZB,ZC, . . .stacked side by side, one for each variable. Table 1 shows an example of crisp coding for some subjects on variable A with five categories (on the left), and their coding into a dummy variable (on the right). The matrix on the right is the subtable ZAandZ = [ZA;ZB;ZC;. . .]denotes the full indicator matrix. This matrix can be subsequently analyzed with Correspondence Analysis, a well-established exploratory data analysis technique (see e.g., [9] and Section 3).
Table 1: An example of crisp coding of a categorical variable with five categories into a dummy or indicator variable
A
3 1 5 . . .
A1 A2 A3 A4 A5
0 0 1 0 0
1 0 0 0 0
0 0 0 0 1
. . . . .
. . . . .
. . . . .
In the case of crisp coding, it is assumed that the original continuous values are uniformly distributed within each interval. However, this is a strong assumption to make and the discrete assignment of continuous values to categories obviously loses a substantial part of the original information. This problem can be alleviated by using a fuzzy instead of crisp coding scheme. Fuzzy coding (codage flou in French) has been successfully used in a variety of data analysis techniques and settings (see e.g., [1, 10, 11, 26].
functions that will be used for fuzzification. Following [1], we adopt the sys-tem of the so-called “three-point triangular membership functions”, also known as piecewise linear functions, or second order B-splines [26]. Triangular member-ship functions have two nice properties that will be further illustrated below: they are linear and invertible.
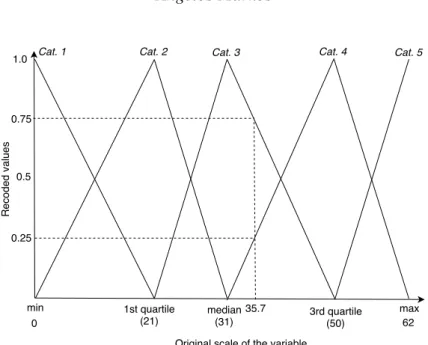
A simple example of triangular membership functions is shown in Figure 1, defining a fuzzy variable with five categories. On the horizontal axis is the scale of the original variable and five hinge points or knots, chosen as the minimum, 1st quartile, median, 3rd quartile and maximum values of the variable. This choice of hinge points is a simple one and corresponds to the quantiles of the distribution; it has been argued that such a choice ensures robustness [24]. The five functions shown in Figure 1 are used for the recoding, and35.7is graphically shown to be recoded as 0for category1, 0 for category2, 0.75for category3, 0.25for cate-gory4and0for category5. This coding scheme is linear and invertible, as shown below:
35.7 = 0.0×0 + 0.0×21 + 0.75×31 + 0.25×50 + 0.0×62. (1)
Given the fuzzy observation [0 0 0.75 0.25 0], the value of the original variable is unique and equals to35.7.
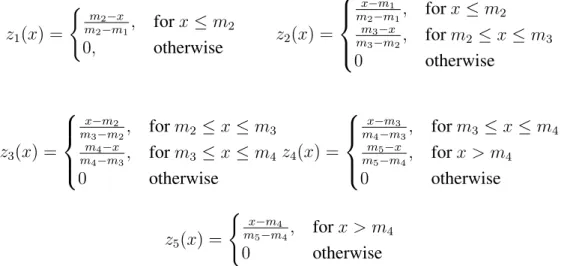
An algebraic description of the proposed scheme is given below. Using tri-angular membership functions, the fuzzy valuesz1, z2, . . . , z5 for a five-category fuzzy coding, wherexis the original value on the continuous scale and the hinge points arem1, m2, . . . , m5 are given by:
z1(x) =
(
m2−x
m2−m1, forx≤m2
0, otherwise z2(x) =
x−m1
m2−m1, forx≤m2
m3−x
m3−m2, form2 ≤x≤m3
0 otherwise
z3(x) =
x−m2
m3−m2, form2 ≤x≤m3
m4−x
m4−m3, form3 ≤x≤m4
0 otherwise
z4(x) =
x−m3
m4−m3, form3 ≤x≤m4
m5−x
m5−m4, forx > m4
0 otherwise
z5(x) =
( x−m
4
m5−m4, forx > m4
0 otherwise
Figure 1: Triangular membership functions to code a continuous variable (hori-zontal axis) into five fuzzy categorical variables. An example is shown of a value on the orginal scale (35.7) being fuzzy coded as [0 0 0.75 0.25 0].
composed of a set of subtables stacked side by side, one for each fuzzy indicator variable. As it is obvious from Eq. 1, fuzzy coding transforms continuous ables into fuzzy categories with no loss of information, since a fuzzy-coded vari-able can be back-transformed to its original value. This is an improvement over crisp coding, where the information about the value of the variable within each interval is lost. Alternatives to triangular membership functions can be, for ex-ample, trapezoidal, Gaussian and generalized Bell membership functions [1, 25]. A thorough investigation of their properties in the context of questionnaire data obtained using the bar is beyond the scope of this work.
Table 2: An example of fuzzy coding of a continuous variable into a fuzzy indi-cator variable with five categories
A
35.7 43.1 25.0
. . .
A1 A2 A3 A4 A5
0 0 0.75 0.25 0
0 0 0.36 0.64 0
0 0.60 0.40 0 0
. . . . .
. . . . .
3
Correspondence Analysis on fuzzy-coded data
The fuzzy coding scheme described in Section 2, can be combined with Corre-spondence Analysis (CA), a well-established method of Geometric Data Analysis [23] for visualizing the rows and columns of a matrix of nonnegative data as points in a spatial representation. For a detailed treatment of CA we refer the reader to [9], for example. As¸an and Greenacre [1] showed that CA on the fuzzy indicator matrix Z∗ (see Table 2) can visualize nonlinear relationships between variables and that this property holds for all forms of membership functions. The core of the CA algorithm is the Singular Value Decomposition (SVD) of a suitably trans-formed matrix. Next, we briefly present the algorithmic steps of CA on the fuzzy indicator matrixZ∗ [20].
Step 1. Given a data table with continuous variables, apply the fuzzy coding scheme of Section 2 to obtain the fuzzy indicator matrix,Z∗.
Step 2. Compute the matrix P as Z∗ divided by its grand total, with row and column sums of Pdefined as r = P1, cT = 1TP, where 1 denotes a column
vector of 1’s of appropriate order andT denotes vector and matrix transpose. The elements ofrandcare called row and columnmasses in CA terminology.
Step 3. Compute the matrix of standardized residualsS:
S =D−1/2r (P−rc)TD−1/2c
whereDrandDcdenote diagonal matrices of the respective masses.
Step 4. Compute the SVD ofS:
S=UDαVT
where the singular vectors in Uand V are normalized as UTU = VTV = I,
and Dα is the diagonal matrix of the singular values, which are positive and in descending order,α1 ≥α2 ≥. . . >0.
Step 5. Compute the coordinates of the row and column points to obtain the so-called “symmetric” CA map:
rows: F=D−1/2r UDα, columns:Γ=D −1/2 c VDα.
4
Application to real data
How much has each of the following contributed to your understanding of the main ideas covered in this course?
A: The tutor’s description of the aim, syllabus content and course objectives. B: The tutor’s encouragement of students to ask questions.
C: The connection of the course material with everyday life examples. D: Your own effort and engagement in the course.
E: Your own consistency in attending classes.
The original five-point Likert-type scale was substituted by the bar (0to62mm). After data collection, each one of the five statements was coded into five fuzzy categories using triangular membership functions, as described in Section 2. Data analysis was perfomed using the R package ca[22] and R code written by the author.
The Correspondence Analysis symmetric map for these data (first and second dimension) is shown in Figure 2. This map explains a total of 27.3% of the vari-ance (or inertia) in the data. Triangle points correspond to the fuzzy categories of each variable (A1 to A5, B1 to B5, etc). Variable category points close to each other indicate similar response profiles to the corresponding statements. The origin of the map corresponds to the average response profile.
The main interpretation of the CA map is carried out by evaluating the posi-tions of the category points to each axis. On the left part of the first dimension (horizontal axis) lies a group of students who attribute their understanding of the course content to the tutor’s quality of teaching and practices (strong agreement with statements A, B and C) but not to their own efforts and consistency in attend-ing classes (strong disagreement with statements D and E). On the right part of the first dimension, there is a group of students that contrasts the one on the left. These students express strong agreement with statements D and E but strong dis-agreement with statements A, B and C. The second dimension, when projected on the vertical axis, separates extreme values on top from moderate responses below the cross of the axes. The resulting parabolic shape or “horse shoe” is a typical structure in CA that has a unidimensional structure and confirms that the items are articulated around a hierarchical scale (for more details on the horseshoe effect, see [23]). To sum up, CA on the fuzzy-coded data obtained using the bar, reveals an interesting negative association between statements{A, B, C}and{D, E}.
5
Conclusions
−1.0 −0.5 0.0 0.5 1.0 1.5 2.0
−1.0
−0.5
0.0
0.5
1.0
1.5
CA factor map
Dim 1 (15.36%)
Dim 2 (11.94%)
A1
A2 A3
A4
A5 B1
B2
B3 B4
B5 C1
C2
C3 C4
C5 D1
D2
D3
D4
D5 E1
E2
E3
E4 E5
Figure 2: Correspondence Analysis symmetric map (1st and 2nd dimension).
References
[1] As¸an, Z. and Greenacre, M. (2011). Biplots of fuzzy coded data.Fuzzy Sets and Systems, 183(1), pp.57–71.
[2] Chvalina, J. and Hoskova, S. (2007). Modelling of join spaces with proximi-ties by first-order linear partial differential operators.Italian Journal of Pure and Applied Mathematics, 21, pp.177–190.
[3] Birkett, N. J. (1986). Selecting the number of response categories for a Likert-type scale, In: Proceedings of the American Statistical Association, pp.488–492.
[4] Blaikie, N. (2003).Analyzing quantitative data: From description to expla-nation, Sage.
[5] Cohen, L., Manion, L. and Morrison, K. (2017). Research methods in edu-cation. New York: Routledge.
[6] Crichton, N. (2001). Visual analogue scale (VAS).Journal of Clinical Nurs-ing, 10, pp.697–706.
[7] Corsini, P., and Leoreanu, V. (2003). Applications of Hypergroup Theory. Kluwer Academic Publishers.
[8] Davvaz, B. and Leoreanu, V. (2007). Hyperring Theory and Applications. Int. Academic Press.
[9] Greenacre, M. (2007). Correspondence Analysis in Practice. Chapman & Hall/CRC.
[10] Greenacre, M. (2013). Fuzzy coding in constrained ordinations. Ecology, 94(2), pp.280–286.
[11] Greenacre, M. J. (2014). Data doubling and fuzzy coding. In: J. Blasius and M. Greenacre, ed.,Visualization and verbalization of data. Boca Raton: CRC Press, pp.239–270.
[12] Hartley, J. and Betts, L. R. (2010). Four layouts and a finding: the effects of changes in the order of the verbal labels and numerical values on Likert-type scales. International Journal of Social Research Methodology, 13(1), pp.17–27.
[14] Kambaki-Vougioukli, P. and Vougiouklis, T. (2008). Bar instead of scale.
Ratio Sociologica, 3, pp.49–56.
[15] Kambaki-Vougioukli, P., Karakos, A., Lygeros, N. and Vougiouklis, T. (2011). Fuzzy instead of discrete, Annals of Fuzzy Mathematics and Infor-matics, 2(1), pp.81–89.
[16] Kambaki-Vougioukli, P. (2012). SILL revisited: confidence in strategy effec-tiveness and use of the bar in data collecting and processing. In:Proceedings of the 10th ICGL, pp.342–353.
[17] Kambaki-Vougioukli, P. (2013). Bar in SILL questionnaire for multiple re-sults processing: Users’ frequency and confidence.Sino-US English Teach-ing, 10(3), pp.184–199.
[18] Kambaki-Vougioukli, P. and Mamoukari, P. (2015). Frequency and evalua-tion of strategy use in SILL quesevalua-tionnaire through an innovative electronic application. In:Proceedings of the 12th ICGL, pp.16–19.
[19] Kambaki-Vougioukli, P., Nikolaidou, P. and Vougiouklis, T. (2017). Ques-tionnaires in Linguistics Using the Bar and the Hv-Structures. In: Recent Trends in Social Systems: Quantitative Theories and Quantitative Models, Springer International Publishing, pp.257–266.
[20] Markos, A., Menexes, G. and Papadimitriou, T. (2009). Multiple Corre-spondence Analysis for ”Tall” Data Sets. Intelligent Data Analysis, 13(6), pp.873–885.
[21] Maturo, A., Sciarra, E. and Tofan, I. (2008). A formalization of some aspects of the Social Organization by means of fuzzy set theory.Ratio Sociologica, 1, pp.5–20.
[22] Nenadic, O. and Greenacre, M. (2007). Correspondence Analysis in R, with Two- and Three-dimensional Graphics: The ca Package.Journal of Statisti-cal Software, 20(3), pp.1–13.
[23] Le Roux, B. and Rouanet, H. (2011).Geometric Data Analysis. Dordrecht: Springer.
[24] Schumaker, L. L. (1981).Spline functions: basic theory. John Wiley & Sons, New York.
[26] van Rijckevorsel, J. L. A. (1988). Fuzzy coding and B-splines, In: J.L.A. van Rijckevorsel, J. de Leeuw, ed., Component and Correspondence Analysis. Chichester, UK: Wiley, pp. 33–54.