Runoff generation on abandoned fields in the Central Ebro Basin. Results from rainfall simulation experiments
18
0
0
Full text
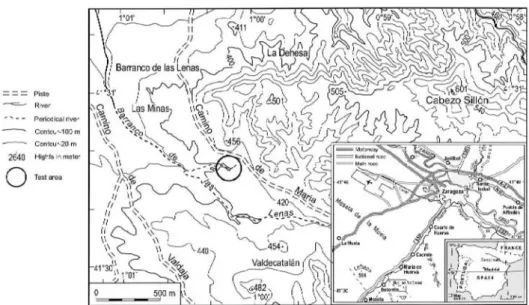
(2) Johannes B. Ries & Margarete Langer. diendo de otros parámetros como la pendiente y la actividad del suelo. El inicio de la escorrentía se midió entre el minuto 5 y el 15. Un hecho nota ble es que la producción de sedimento no disminuye significativamente con el aumento de la cubierta vegetal. Sólo cuando la cubierta vegetal supera el 60% la pérdida de material disminuye claramente. Las tasas de escorrentía muestran los mismos órdenes de magnitud que las registradas por Lasanta et al. (2000) en campos abandonados cerca de Peñaflor, aunque las tasas de erosión de María de Huerva son significati vamente menores. Key-words: Rainfall simulation, Runoff, Erosion, Abandoned fields, Fallow land, Ebro Basin. Palabras clave: Simulación de lluvia. Escorrentía, Erosión, Campos abandonados, Barbecho, Cuenca del Ebro. 1. Introduction In the research project EPRODESERT – the acronym stands for Evaluation of Processes Leading to Land Degradation and Desertification under Extensified Farming Systems in North-East Spain - the interaction of vegetation succession and geomorphodynamics in different test areas is investigated along a transect from the High Pyrenees to the Central Ebro Basin. This transect follows a strong topographic and climatic gradient from perhumid climate in a High Mountain Region to a semi-arid climate in the lowlands in front of them (Ries, Seeger and Marzolff , 1997). This paper presents the results from rainfall simulations for determining the sitespecific erodibility of soil and runoff generation on fallow land of different ages. It explains the wide range of results by the vegetation distribution, the zoological influences of soil fauna and the role of soil crusts for runoff coefficients and soil erosion rates. It is strongly related to the paper written by Manuel Seeger in the same issue, which shows some parameters on the same test plots simulated by the soil water-model HILL-FLOW. It is also very close to the paper from Tilmann Sauer, showing how the development of soil water content can be calculated for different soils in all five test areas for daily time steps. 2. Test Area The test area is situated in Val de las Lenas, an eastern tributary of the Huerva River 15 km South of Zaragoza (Figure 1). Geology is dominated by Miocene gypsum, marl and clay series with interbedded limestone and sandstone which form a highly dissected steep slopes of the Mesa in the test area the Plana de Zaragoza (ITME 1998). The Holocene alluvial fills which form the flat valley bottoms are up to 20 m thick and consist of interbedded layers of silty loam, sandy loamy silt, interrupted by discontinuous stone and gravel layers with silty sandy matrix. In this fills multi-layered colluvisols found here belong to the order of Aridisols according to USDA and are developed as Leptic Haplogypsid with short soil profiles. They carry the former and actual agricultural fields while the slopes are used for grazing. 62.
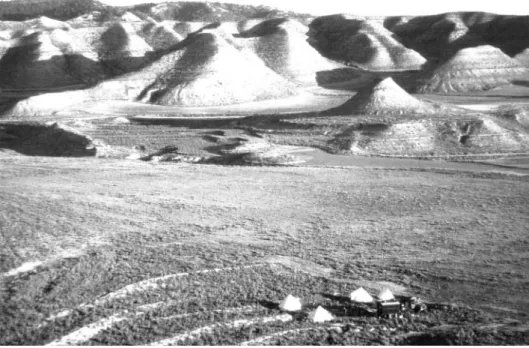
(3) Runoff generation of abandoned fields in the central Ebro basin. Results from rainfall simulation experiments. Figure 1. Test area in the Val de las Lenas Central Ebro Basin in Northeast Spain.. 3. Problems and Questions – Soil Erosion on Abandoned Fields Set-aside programmes of arable land have recently been supported by subsidies of the EU with the result that the number of abandoned fields has increased in the Ebro Basin since the beginning of the nineties (Figure 2). This young fallow land shows very complex fluvial-geomorphologic processes: When the former arable land is no longer ploughed, harrowed and rolled regularly, as it was usual in the traditional dry farming system, soil crusts develop and reduce the hydraulic conductivity in the upper millimeters, what causes heavily reduced local infiltration capacity. The edaphic dryness increases and the water erosion rate grows compared to that of arable land. In EPRODESERT the vegetation succession and the soil erosion are investigated on this young fallow land and are compared to the situation on older abandoned fields which are not used as agricultural fields since about 60 years (Ries et al., 2000). On young fallow land vegetation succession is slow owing to the semi-arid climate with six arid months and a total precipitation of only 300 mm per year. With the rain fall in spring time a sparse therophyte vegetation mostly Hordeum murinum grows leading to low vegetation cover. During summer only dry vegetation material remains on the fields. Five years after abandonment a very low vegetation cover of about 10% can be found on the young fallow land. Thereby the vegetation succession highly depends on the tracks of the last tillage: the ridge and furrow pattern divides the fallow land up into a nanorelief which is characterised by a close coexistence of ridge areas with erosion and furrow areas with sedimentation in-between. Vegetation succession starts here because of higher soil moisture content so that therophytes may survive in dry years. After several years the first dwarf shrubs, mainly Artemisia herba alba, grow in the furrows. 63.
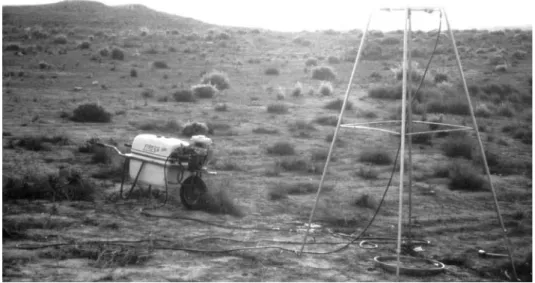
(4) Johannes B. Ries & Margarete Langer. Figure 2. Abandoned fields on the flat valley bottom in the Val de las Lenas in front of the Mesa de Zaragoza. Old fallow land, too, often shows a vegetation cover of under 60% and is covered with disperse Esparto-grass vegetation, mainly Lygeum spartum, and open shrub land with Salsola vermiculata, Rosmarinus officinalis, Thymus vulgaris. Between them crusts of lichens which seal the surface often develop. On both fields (Figure 3; soil profile 1 and 2) the Leptic Haplogypsid consists of sandy silt, the content of gypsum is with 20% and 30% respectively very high and the Corg-content with values below 0.5% low. The pore volume of both soils is quite similar, the same we can say for the water content at permanent wilting point. The available water capacity is higher on the young fallow land (profile 1, Figure 3a) and the number of macro-pores is higher on old fallow land (profile 2, Figure 3b) because of the bioturbation of the edaphon. Due to these different situations high runoff coefficients and high erosion rates on the crusted young fallow land and lower rates on the older one are expected. 4. Material and Methods 111 rainfall simulations on test plots of 0.28 m 2 were carried out with a small mobile nozzle type rainfall simulator. The experiments were done in situ on undisturbed surfaces from 1995 to 1998. The rainfall simulator (Figure 4) is based on the instruction of Calvo, 64.
(5) Runoff generation of abandoned fields in the central Ebro basin. Results from rainfall simulation experiments. Figure 3a. 65.
(6) Johannes B. Ries & Margarete Langer. Figure 3. Soil Characteristics (horizons, grain size and pore size distribution according to German soil science nomenclature, AG Boden 1994, Bodenkundliche Kartieranleitung; pore volume and water capacity are calculated for the upper 60 cm) of soil profile 1 (Figure 3a) under young fallow land and soil profile 2 (Figure 3b) under old fallow land.. 66.
(7) Runoff generation of abandoned fields in the central Ebro basin. Results from rainfall simulation experiments. Figure 4. Small mobile rainfall simulator. et al. (1988) and Lasanta et al. (1994), who used similar nozzle type simulators for getting runoff and soil erosion rates on fallow land in the semi-arid Southeast of Spain and in the Ebro Basin. Cerdà (1995) investigated the infiltration capacity and soil erosion of degraded locations with different vegetation cover in the South of Valencia by using a similar type of system. In order to achieve good comparability of the results we decided to construct and use a small portable type of rainfall simulator which is currently employed by different research groups in Spain. The instrument consists of the following components: 1. A mobile motor-driven pump fixed together with a 100 litre water tank on a steel framework, it can be driven like a wheelbarrow. 2. A two meter high aluminium framework with telescopic and removable legs as the holder for the manometer, ventilation valve and most important the nozzle. 3. Ametal ring, 60 cm in diameter, 6 cm high with outlet and sampling sheet for the runoff. Pump system and nozzle are connected by a rubber pipe. Water pressure and, thus, the discharge is adjusted with a simple tap at the pipe and the manometer. The nozzle is a hollow cone nozzle combined with a coarse droplet restrictor and nozzle filter which is constructed by Hardi Company for pesticide distribution (hollow cone nozzle Syntal 1553-10, 1 mm opening, mesh width 0.30 mm). Before each simulation the rainfall intensity of 40 mm-1 is calibrated by putting a calibration plate on the fixed steel ring (Ries et al. 2000). 67.
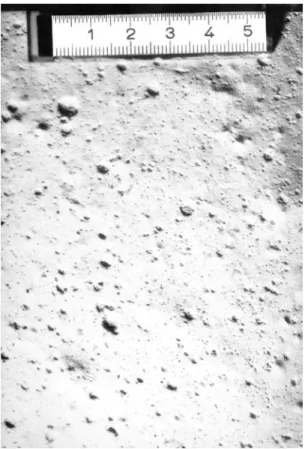
(8) Johannes B. Ries & Margarete Langer. Figure 5. Rainfall distribution on the test plot [mmh-1] with 60 cm in diameter. The drop size distribution and the rainfall distribution on the plot of such a simulator depends mainly on the nozzle-type, water pressure, the height and the intensity of rainfall. We can say that these parameters were constant over the experiments. The rainfall distribution on the plot is not regularly, as it is normally for nozzle-type simulators with only one nozzle. The distribution shows the typical tongue-shaped divergence. The differences on the plot range between +/- 31%. This seems quite high but is less than values we could find in literature about drip-screen simulators and full-cone nozzle simulators (Lascelles et al. 2000, Figure 1b, 2a; Esteves et al., 2000). More important is that this divergence is a constant methodical fault. The drop size distribution can be seen in Figure 6, which documents the imprints in a soft Moltofill-Matrix. The small drops up to 2 mm diameter are overrepresented and the number of large drops over 3 mm is with only 3% little. The Median of the drop size is between 1 and 2 mm, this is close to that of Cerdá (1997) with 1.58 mm, which he measured for rainfall intensity of 40 mm h-1 for natural rainfalls in Western Mediterranean.. Tab. 1. Drop Size Distribution Drop Diameter [mm] 0-1 1-2 2-3 3-4 4-5. 68. Percentage of Drops [%] 48,0 39,8 9,2 2,0 1,0.
(9) Runoff generation of abandoned fields in the central Ebro basin. Results from rainfall simulation experiments. Figure 6. Drop Distribution in Moltofill-Matrix. During the experiment a plastic sheet (tarpaulin) is put over the framework in order to protect the rainfall simulation against wind and evaporation. A simulation experiment lasts for 30 minutes. During 6 intervals of 5 minutes each the total runoff is collected in plastic bottles. The amount of runoff is determined for each interval by weighing of the suspended material by filtering with Blue Ribbon and Black Ribbon filters (Schleicher & Schuell) and weighing of filtrate. The dissolved solids are calculated from the electrical conductivity which is calibrated by evaporation residue. The concentration of suspended sediment and of solutes can be calculated. 5. Results In Figure 7 runoff on the young fallow land is compared to runoff on the old fallow land. The legend shows the number of the rainfall simulation and the runoff coefficient (see Table 2). On the young fallow land most rainfall simulations show a very similar course (Figure 7a): the runoff starts between the second and the fifth minute. It rises relatively fast within the first 10 minutes. After that the runoff rate is more or less staying on the same level. The runoff coefficient ranges between 20 and 95%. On the contrary 69.
(10) B1 Sealed (20.0 %) B19 Sealed (49.3 %) B17 Sealed (46.6 %) B31 Sealed (74.8 %) B32 Sealed (95.1 %) B40 Sealed (81.3 %) B41 Sealed (73.9 %) B42 Sealed (81.0 %) B43 Sealed (65.6 %) B44 Vegetation (53.3 %) B45 Vegetation (41.6 %) B77 Sealed (68.5 %) B81 Vegetation (53.1 %) B106 Sealed (71.6 %) B107 Sealed (70.4 %) B108 Sealed (34.1 %) B109 Sealed (70.9 %) B110 Sealed (65.6 %) B111 Sealed (77.0 %). B2 Sealed (14.5 %) B18 Sealed (0.2 %) B19 Sheeptrail (36.5 %) B21 Vegetation (3.8 %) B22 Vegetation (26.7 %) B23 Bioturbation (0.2 %) B33 Sealed (2.5 %) B46 Vegetation (23.0 %) B47 Bioturbation (28.6 %) B48 Sealed (67.2 %) B49 Bioturbation (6.3 %) B50 Vegetation (72.3 %) B51 Vegetation (75.8 %) B52 Bioturbation (58.8 %) B82 Vegetation (0.0 %) B84 Vegetation (0.0 %) B85 Terrace (62.7 %). Figure 7. Runoff on young (Figure 7a) and old fallow land (Figure 7b). 70.
(11) B1 Sealed (9.05 g) B16 Sealed (13.62 g) B17 Sealed (29.71 g) B31 Sealed (21.57 g) B32 Sealed (62.53 g) B40 Sealed (28.65 g) B41 Sealed (18.32 g) B42 Sealed (20.65 g) B43 Sealed (22.67 g) B44 Vegetation (18.71 g) B45 Vegetation (16.76 g) B77 Sealed (21.75 g) B81 Vegetation (17.37 g) B106 Sealed (386.71 g) B107 Sealed (248.74 g) B108 Sealed (185.89 g) B109 Sealed (458.58 g) B110 Sealed (81.10 g) B111 Sealed (68.83 g). B2 Sealed (22.23 g) B18 Sealed (0.07 g) B19 Sheeptrail (21.65 g) B21 Vegetation (0.53 g) B22 Vegetation (10.01 g) B23 Bioturbation (0.18 g) B33 Sealed (0.46 g) B46 Vegetation (7.36 g) B47 Bioturbation (16.59 g) B48 Sealed (36.78 g) B49 Bioturbation (8.81 g) B50 Vegetation (13.09 g) B51 Vegetation (21.89 g) B52 Bioturbation (34.73 g) B82 Vegetation (0.00 g) B84 Vegetation (0.00 g) B85 Terrace (76.71 g). Figure 8. Erosion rate on young (Figure 8a) and old fallow land (Figure 8b). 71.
(12) Johannes B. Ries & Margarete Langer. Table 2: Plot characteristics, parameters and results of the rainfall simulations on old and young fallow land Rainfall Runoff Material Suspended Start Depth of Vegetation Simulation Coefficient Output Sediment Runoff Infiltration Cover No. [%] [gm-2] Concentration [min] [cm] [%]. Life Type. [g l -1]. 72. 1 16 17 31 32 40 41 42 43 44 45 77 81 106 107 108 109 110 111. 20.0 49.3 46.6 74.8 95.1 81.3 73.9 81.0 65.6 53.3 41.6 68.5 53.2 71.6 70.4 34.1 70.9 65.7 77.0. 9,05 13,62 29,71 21,57 62,53 28,65 18,32 20,65 22,67 18,71 16,76 21,75 17,37 386,71 248,74 185,89 458,58 81,10 68,83. 2 18 19 21 22 23 33 46 47 48 49 50 51 52 82 84 85. 14.5 0.2 36.5 3.8 26.7 0.2 2.5 23.0 28.6 67.2 6.3 72.3 75.8 58.8 0.0 0.0 62.7. 22,23 0,07 21,65 0,53 10,01 0,18 0,46 7,36 16,59 36,78 8,81 13,09 21,89 34,73 0,00 0,00 76,71. Thero. Hemikr. Cham. Kryp.. = Therophyt = Hemikryptophyt = Chamaephyt = Kryptogame. Young fallow land 14.58 3’40 3 1.76 3’57 4 3.94 2’26 7 1.67 3’40 10 3.58 2’02 4 1.88 2’15 4 1.32 2’32 4 1.38 2’06 7 2.37 2’10 3 1.76 4’10 5 10.97 4’22 8 1.46 3’00 n.c. 1.51 5’01 5 27.94 2’08 20 16.86 2’00 12 27.00 1’58 7 35.57 3’02 3 8.19 2’04 5 4.94 1’43 n.c. Old fallow land 38.43 5’00 3 2.75 6’08 23 4.52 4’45 9 0.71 14’40 13 1.91 6’52 18 5.68 11’55 18 0.90 15’04 40 1.61 5’02 n.c. 5.19 3’43 20 4.07 3’10 2 5.22 11’25 17 2.09 3’50 7 2.19 2’30 9 3.94 2’48 6 0.00 11 0.00 11 5.64 2’53 n.c.. Slope Soil [°] Moisture Content [Mass %]. 2 3 5 10 5 50 40 50 40 35 60 25 80 0 0 0 0 0 0. Thero. Thero. Thero. Thero. Thero. Thero. Thero. Cham. Cham. Thero. Thero. -. 2 4 4 5 5 7 7 7 7 7 7 7 2 2 4 4 13 9 2. 4.5 5.5 5.8 3.5 5.8 1.8 1.7 6.4 4.8 3.6 4.3 6.2 3.0 10.6 9.2 9.3 8.7 7.5 n.c.. 1 3 1 95 40 25 50 95 40 60 50 70 80 40 80 70 3. Kryp. Thero. Thero. Cham. Hemikr. Hemikr. Kryp. Hemikr. Cham. Kryp. Kryp. Kryp. Thero. Kryp. Kryp. Kryp. Kryp.. 3 2 10 15 15 7 5 5 5 4 6 5 9 13 2 2 15. 7.3 5.8 5.8 6.0 7.6 2.8 7.4 3.2 5.5 4.3 6.1 4.4 7.2 2.3 6.5 6.2 6.6.
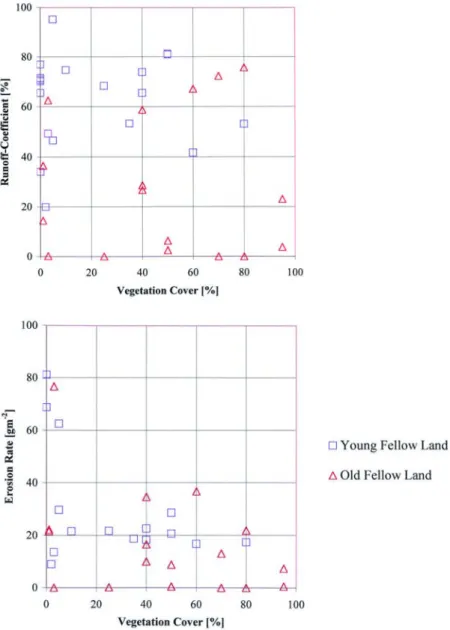
(13) Runoff generation of abandoned fields in the central Ebro basin. Results from rainfall simulation experiments. the course of the runoff on the old fallow land shows a large variability (Figure 7b). The runoff starts between the third and the fifteenth minute or there is no runoff at all. On the old fallow land runoff coefficient ranges between 0 and 76 %. Figure 8 shows the erosion rates of young and old fallow land. On the young fallow land the course of the sediment yield can be divided into three groups (Figure 8a): a first group with extremely high sediment delivery of about 185 to 460 g m -2, a second group with lower sediment yield of about 60 g m-2 and a third group with about 20 to 30 g m -2. Altogether erosion rate on young fallow land ranges between 9 and 460 g m-2. Erosion rates on the old fallow land show a large variability again. It ranges between 0 and 78 g m -2 (Figure 8b). On the young fallow land soil surface sealing leads to a decrease in infiltration rates and a consequent increase in runoff in comparison to freshly tilled agricultural fields. The three different groups concerning sediment yield corresponds with the age of the soil sealing. Fresh sealed soils (which is 3 months old) receive the highest erosion rates, soil sealings of an age of about 1 year show lower sediment yield, several year old soil sealings cause the lowest but still high erosion rates. The different sediment yields can be explained by the micro topography of the plots. On young soil sealings - which develop within a short time after ploughing - the micro topography is much higher than on several year old fallow land, where the ridge and furrow pattern is much more levelled. The higher the micro topography the higher is the area of the plot and the higher is the sediment yield. The large range of values on the old fallow land shows the variability of this site: vegetation cover with lichens, stipa gras and shrubs, sites with high activity of the edaphon, different slope angles on the terraces, sheep trails and vegetation islands. High runoff coefficients and erosion rates occur on sites with high slope angles and low vegetation cover and low soil humidity before the experiment. The highest runoff of 63 % is gained at the edge of an old terrace. No runoff is gained at sites covered with lichens. The scatter plot in Figure 9a shows the correlation between vegetation cover and runoff coefficient. The values show a large variation. We believe that the data show no relationship between vegetation cover and runoff. The right scatter plot in Figure 9b shows the correlation between vegetation cover and erosion rate. With increasing vegetation cover sediment yield decreases. The Kendall correlation coefficient is -0.4, R2 of the logarithmic fitting is 0.70 which is a quite high value. Extremely high erosion rates only occur on a vegetation cover lower than 5%. But still high sediment yields of about 35 gm-2 occur on a vegetation cover of 60%. Only on a vegetation cover of more than 60% erosion rates are obviously lower. Nevertheless, on the old fallow land no erosion can occur on all vegetation cover. Here also other factors are important for erosion. The runoff and erosion data of fallow land of different ages is shown in Figure 10. Putting the data in a temporal order the development of runoff and erosion rates on fal73.
(14) Figure 9. Correlation vegetation cover / runoff coefficient (Figure 9a) and vegetation cover / erosion rate (Figure 9b) from all rainfall simulations. 74.
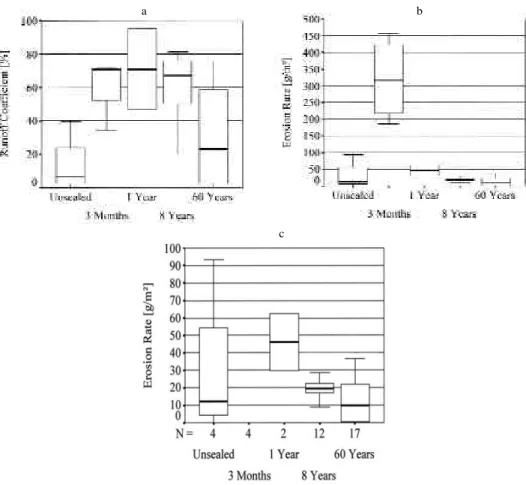
(15) Runoff generation of abandoned fields in the central Ebro basin. Results from rainfall simulation experiments a. b. c. Figure 10. Temporal development of runoff (Figure 10a) and erosion rate in different scales (10b, 10c) on fallow land of different stages.. The box plots indicate that after ploughing runoff and erosion rates are low with 6% and 12 g m-2. Only 3 months after ploughing - after 4 precipitation events with amounts of 8 to 11 mm - the soil is sealed so much that runoff and erosion rates increase to values of 70% and about 320 g m-2. During the following couple of years runoff is still staying on a high level of about 70%. Erosion rate is decreasing to 46 g m -2 within the first year and about 20 g m-2 after 8 years. But it is still of almost the double value than immediately after ploughing. After decades of land abandonment the runoff is with 23 % still significantly higher than at the beginning with 6 %, the erosion rate is with 10 g m- 2 on the same level as after ploughing. 6. Discussion At first sight the high variability of runoff and erosion rates on the young fallow land seems to be surprising. But it follows from the different types of soil crusts and repre75.
(16) Johannes B. Ries & Margarete Langer. sents the decreasing infiltration due to soil sealing. On the old fallow land the high variability represents the small scaled highly differentiated local characteristics of slope, vegetation pattern, soil crusts, lichens and the activity of the edaphon. As expected plots without any vegetation show the highest erosion rates. Generally the erosion rate decreases with increasing vegetation cover. But the limiting value of 30 - 40% vegetation cover above which soil erosion and runoff rate decrease significantly (Thornes, 1995; Dieckmann et al., 1992; Romero-Díaz et al., 1986) cannot be approved. Even on a vegetation cover of 60% high erosion rates are still possible. This has to be kept in mind when developing water shed management plans which includes reduction of erosional processes. The presented results from rainfall experiments show the same order of magnitude than experiments from the research group from the Instituto de Pirinaico de Ecología who carried out rainfall simulations with a similar machine near Peñaflor close to our investigation area in the Inner Ebro Basin (Lasanta et al., 2000). They gained a runoff coefficient of 75 % which is very close to the mean value on the young fallow land with 63 %. The erosion rates of 40 g m-2 measured by the research group are the double of ours of 20 g m-2 (7-year old fallow land) due to the thickness of the crusts. However the most noticeable problem of land abandonment seems to be the high runoff rates during time periods of decades which diminish the soil water content. This leads to dry soil conditions in the test area during periods up to seven months causing the lack of plant available water which is the limiting factor for vegetation succession (Sauer and Ries, 2002 in this issue). Some of the measured parameters can be modelled (Seeger and Ries, 2002 in this issue) and fit very well to the field data of this investigation. 7. Conclusions Regarding the results from experiments on fallow land of different ages in the central Ebro basin the following issues can be summarized: •. Land abandonment is a problem for the erosion rates (320 g m -2) only within the first years.. •. But, for the loss of water land abandonment is a serious problem: Within the first decade it is about 70%. For further 5 decades the runoff coefficient is still higher than 20% which is 4 times higher than on freshly tilled agricultural fields.. •. In a region with only 300 mm precipitation such a water loss is a major factor for the retarded vegetation succession during a long time period.. •. The huge amount of surface runoff can create linear erosion processes like rills and gullies further down.. •. If the subsidies of land abandonment continues, more water will be at disposal for such processes in the future.. Acknowledgements The work was carried out as part of the EPRODESERT Project funded by the German Research Council (No. Ri 835/1-3: «Landnutzungswandel, Erosion und Desertifikation 76.
(17) Runoff generation of abandoned fields in the central Ebro basin. Results from rainfall simulation experiments. in Nordostspanien»). We thank Rebecca Langhagen, Sabine Neeb, Christine Pfahls and Matthias Weise for the permission for using their data, and Christian Frevel, Dr. Irene Marzolff, Yann Matthäi, Carsten Reelfs, Tilmann Sauer and Dr. Manuel Seeger for invaluable assistance in the field. Particular thanks are due to Prof. Dr. José María García-Ruiz and Dr. Teodoro Lasanta, Instituto Pirenaico de Ecología (CSIC) for helpful comments on the methods and Prof. Dra. María Teresa Echeverría Arnedo and Prof. Dr. Juan de la Riva, Department of Geography, Zaragoza University for discussions about the sites. References AG Boden (1994). Bodenkundliche Kartieranleitung. Hannover, 392 S. Calvo, A., Gisbert, J. M., Palau, E. and Romero, M. (1988). Un simulador de lluvia portátil de fácil construcción. In Sala, M. & Gallart, F. (eds.): Métodos y Técnicas para la Medición en el Campo de Procesos Geomorfológicos. Sociedad Española de Geomorfología, Monografía No. 1, pp. 6-15, Barcelona. Cerdà, A. (1995). Factores y variaciones espacio-temporales de la infiltración en los ecosistemas mediterráneos. Geoforma Ediciones, 151 pp., Logroño. Cerdá, A. (1997). Rainfall drop size distribution in the western Mediterranean basin, Valéncia, Spain. Catena, 30: 169-182. Dieckmann, H., Motzer, H., Harres, P. and Seuffert, O. (1992). Vegetation and erosion. Researches on erosion plots in Southern Sardinia. Geoöko-Plus, 3: 139-149. ITGME (Instituto Tecnológico Geominero de España) (1998). Mapa Geológico de España, Escala 1:50 000, 383, 27-15, Madrid. Esteves, M., Planchon, O., Lapetite, J. M., Silvera, N. & Cadet, P. (2000). The ‘EMIRE’ large rainfalls simulator - design and field testing. Earth Surface Processes and Landforms, 25: 681-690. Lasanta, T., García-Ruiz, J. M., Pérez-Rontomé, C. and Sancho-Marcén, C. (2000). Runoff and sediment yield in a semi-arid environment. The effect of land management after farmland abandonment. Catena, 38: 265-278. Lasanta, T., Pérez Rontomé, M. C. & García-Ruiz, J. M. (1994). Efectos hidromorfológicos de diferentes alternativas de retirada de tierras en ambientes semiáridos de la Depresión del Ebro. – In García-Ruiz, J. M. & Lasanta, T. (eds.): Efectos Geomorfológicos del Abandono de Tierras, pp. 69-82, Zaragoza. Lascelles, B., Favis-Mortlock, D. T., Parsons, A. J. and Guerra, A. J. T. (2000). Spatial and temporal variation in two rainfall simulators. Implications for spatially explicit rainfall simulation experiments. Earth Surface Processes and Landforms, 25: 709721. Ries, J. B., Langer, M. and Rehberg, C. (2000). Experimental investigations on water and wind erosion on abandoned fields and arable land in the Central Ebro Basin, Aragón/Spain. Z. Geomorph. N.F., Suppl. 121: 91-108. Ries, J. B., M. Seeger and I. Marzolff (1997). El proyecto EPRODESERT. Cambios de uso del suelo y morfodinámica en el Nordeste de España. Geographicalia, 35: 205-225. 77.
(18) Johannes B. Ries & Margarete Langer. Romero-Díaz, M. A., López-Bermúdez, F., Thornes, J. B., Francis, C. F. and Fisher, G. C. (1986). Variability of overland flow erosion rates in a semi-arid Mediterranean environment under matorral cover, Murcia, Spain. In Harvey, A. M. & Sala, M. (eds.): Geomorphic Processes in Environments with Strong Seasonal Contrasts, Vol. II, Geomorphic Systems. Catena, Suppl. 13: 1-11. Sauer, T. and Ries, J. B. (2002). The Water Balance of Different Soils on Abandoned Fields along a Profile from the High Pyrenees to the Central Ebro Basin. In this issue. Seeger, M. & Ries, J. B. (2002). Runoff Generation on Abandoned Fields in the Central Ebro Basin – Results from Simulations.- In this issue. Thornes, J. B. (1995). Mediterranean desertification and the vegetation cover. In Fantechi, R., Peter, D., Balabanis, P. & Rubio, J. L. (eds.): Desertification in a European Context - Physical and Socio-Economic Aspects. Proceedings of the European School of Climatology and Natural Hazards Course, El Campello, Pueblo Acantilado, Alicante, Spain, 6-13 October 1993, Final Report, pp. 169-194, Brussels.. 78.
(19)
Figure

+7
![Figure 5. Rainfall distribution on the test plot [mmh-1] with 60 cm in diameter](https://thumb-us.123doks.com/thumbv2/123dok_us/8067364.2136646/8.892.271.640.234.503/figure-rainfall-distribution-test-plot-mmh-cm-diameter.webp)


Related documents
However, relevant courses, reading literature or colleagues’ support and advice can also help to “gain, maintain and use educational knowledge appropriately” (Knight &
That’s why, essential goal of the study is to investigate of water supply and sanitation facilities for Korail slum in Dhaka city..
Location of the firm, numbers of employees at junior, middle and senior levels, training expense Incurred for each level of the employees, the revenues earned by the firms and
The final grade consists of four different parts: class participation, a midterm written exam, a final written exam, and a final project.. The breakdown of grades is made up
When the reads dataset contains variations (e.g. two allele of the same individual, or two or more distinct indi- viduals, or different isoforms of the same gene in RNA- Seq data,
5 Therefore, the purpose of this randomised educational trial was to determine if participation in a journal club based on articles and speci fi cally designed materials
Stormtime substorm onsets occurrence and flow channel triggering Lyons et al Earth, Planets and Space (2018) 70 81 https //doi org/10 1186/s40623 018 0857 x F U L L PA P E R
Furthermore, this database was linked to additional information at the center level, such as the number of unduplicated clients and visits, public and private insurance status,
