NUMERICAL SIMULATION OF AL–SI ALLOYS WITH AND WITHOUT
A DIRECTIONAL SOLIDIFICATION
M
ICHAELR
OLANDB
,1,A
NASTASIAK
RUGLOVA2,N
ILSH
ARSTE2,F
RANKM ¨
UCKLICH2 ANDS
TEFAND
IEBELS11Chair of Applied Mechanics, Saarland University, D-66123 Saarbr¨ucken;2Chair of Functional Materials,
Saarland University, D-66123 Saarbr¨ucken
e-mail: [email protected], [email protected], [email protected], [email protected], [email protected]
(Received October 31, 2013; revised February 27, 2014; accepted February 27, 2014)
ABSTRACT
Numerical simulations are presented to analyze the influence of the casting process on the resulting strength of Strontium modified Al–Si alloys. A relationship is identified between the mechanical behavior and the different 3D morphologies of the eutectic silicon of the samples obtained by the die cast procedure and the directional solidification. It is shown that the mechanical behavior of the die cast alloy is isotropic in all three directions. In contrary, for the directional solidified alloy, the mechanical strength in the direction of the temperature gradient is higher than in the transverse direction. This fact has to be taken into account when analyzing structures issued from different casting processes. The volume meshes for the simulations are generated from experimental 3D FIB/SEM data sets. The influence of several levels of coarsening of the meshes as well as the order of the Lagrange element in the finite element setup are also analyzed.
Keywords: casting procedure, FE simulation of Al–Si alloys, FIB/SEM tomography, mechanical properties, volume meshes.
INTRODUCTION
In the modern automotive industry, there is a steadily increasing need in light Al–Si alloys. Due to the good casting properties and the strength-to-weight ratio, Al–Si alloys represent a good alternative to heavier cast iron, which for a long time has been used as a major component in the production of engine bodies. The binary system Al–Si has a eutectic composition at approx. 12.5 wt% Si and a temperature of 577◦C. A distinction is to be made between hypoeutectic and hypereutectic compositions. The first has a portion of less than 12.5 wt% Si, the other one remains above this value (Gruzleski and Closset, 1990).
Improved mechanical properties of Al–Si alloys (namely tensile strength and elongation) are mostly the result of specific Si morphology structurally transformed by modification treatment (Gruzleski and Closset, 1982; Haque, 1995; Shin et al., 2012). A modification treatment is performed by adding a small amount of certain elements (such as Sr or Na), which promote the twinning of Si particles and refine the eutectic phase. Thus, the modified Si particles solidify in a coral-like or fibrous shape (Hedge and Prabhu, 2008).
The organization of the casting process as well as the quality of equipment used makes an important
contribution to the final as-cast structure together with the chemical composition of the alloy. Most of the aluminum alloys’ casting parts are produced by pressure die casting. This process is beneficial for the surface quality and mechanical properties of the alloys. By this process, the metal is injected into a cold steel mold, whereupon it rapidly solidifies. Obviously, the structure obtained with this casting technique has a fine architecture without preferred growth orientation. In order to make the process even more precise in terms of shrinkage, a directional solidification can be used. In this case, the advance of the solid-liquid interface is controlled via cooling-heating systems (Aleris, 2011). As a result of directional cooling, the microstructure orients in the direction of the temperature gradient.
In this work, appropriate parameters for the mechanical simulations on the Al–Si eutectic structures are deduced from numerical experiments. Additionally, the influence of the casting process on the resulting strength of the alloys is analyzed. The work is structured as follows: at first, volume meshes from the FIB/SEM tomography images will be generated, followed by an estimation of the influence of the mesh coarsening on the results of the simulations. This will make it possible to effectively use FEM software tools.
Then the mechanical behavior of the samples obtained (in two resolutions) by die casting and of the directionally solidified one are plotted with respect to different load directions and mutually compared. The results are of importance for the further study of the microstructure-property relationship.
MATERIALS AND METHODS
FIB/SEM-TOMOGRAPHY
The samples obtained by the die cast procedure and the directional solidification have been provided by RWTH Aachen. In this work, only hypoeutectic Al–Si alloys are taken into consideration that imply the presence of two phases: primary Al dendrites and Al–Si eutectic. The chemical composition is shown in Table 1.
Table 1. Al–Si samples: chemical composition and casting procedure.
alloy Sr-amount (ppm) casting procedure
AlSi7Mg0.3 200 die cast
AlSi7 150 directional
solidification
After specific sample preparations, including grinding and polishing, regions of interest for the reconstruction of the Al–Si eutectic were explored using scanning electron microscopy (SEM). Then the FIB/SEM tomography was performed. The FIB/SEM tomography reconstruction consists of iterative milling of the sample with an ion beam and imaging of the sectioned planes with an electron beam after removing a slice of a certain thickness from the sample. For a detailed exposition of the technique (see Holzeret al.
2004; Giannuzzi and Stevie 2005). When a stack of 2D SEM images is collected, the 3D reconstruction of the morphology was processed by interpolation in Amira software.
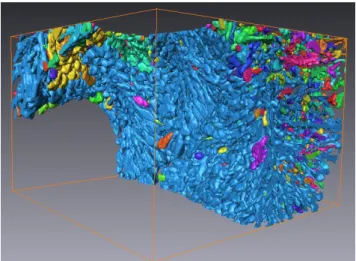
Fig. 1 shows the sample obtained by the die cast procedure. Due to the rapid solidification, the structure has a very fine morphology and a percolating network of the silicon particles without a preferred growth orientation. On the contrary, the structure in Fig. 2 shows disconnected silicon clusters growing in the direction of the temperature gradient. In spite of choosing only the eutectic regions with the help of SEM, some parts of the primary Al dendrites (transparent in both figures) fell into the reconstruction volume. Therefore, they were cropped out of the volume for further FE simulations.
Fig. 1. 3D morphology of experimental Si corals in an Al matrix material without a directional solidification. The size of the bounding box is 19.4µm×12.9µm×
19.4µm.
Fig. 2. 3D morphology of experimental Si corals in an Al matrix material with a directional solidification in x-direction. The size of the bounding box is 36.6µm×
VOLUME MESH GENERATION
The data from the FIB/SEM tomography for the Al–Si alloy with a directional solidification in the x-direction is given as a series of 195 single images in the uint12 data format. Due to the challenging segmentation process done in a preprocessing step, two completely separated phases for the two components of the alloy were obtained.
Therefore, the twelve-digit binary numbers can be easily correlated to the material properties of aluminum and silicon. The slice thickness of the image stack is constant with a distance of 180 nm between two images. The height of the images is 285 pixels and the width is 790 pixels. The pixel spacing of the images is 58 nm×46 nm.
For the use of faster visual computing algorithms for the mesh generation, the images were rotated and rescaled to an equal pixel spacing of 46 nm with a new slice thickness of also 46 nm. After this step, the image data is merged into a finite element mesh that contains the maximum of the information from the FIB/SEM tomography. For this purpose, all pixels will be transformed to voxels with the help of the new slice thickness. The rescaling and rotation of the images leads to cubical voxels with an edge length of 46 nm. The material properties of each pixel will be mapped on the barycenter of the corresponding voxel. This procedure generates a finite element mesh with approximately 150 million voxels: a number that is too large for finite element simulations except for large high performance clusters.
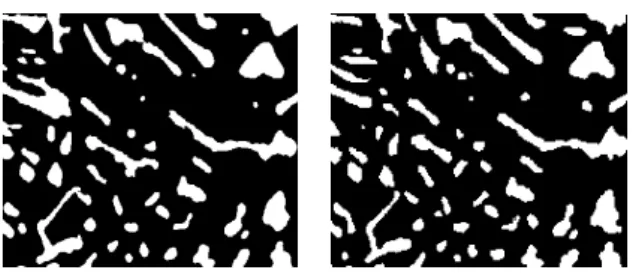
The meshes were coarsened at different coarsening levels to accelerate the computations and reduce the requirements for memory space. The coarsening was realized by an algorithm that operates on the 2D image plane. For each level of coarsening, the algorithm combines the pixels inside a level× level-pixel window to a new larger level-pixel with respect to the volume fractions of the particular materials and their properties. Fig. 3 illustrates the coarsening for one cut through the finite element mesh.
The left image is obtained with the original mesh of 550×763 pixels, whereas the right image is the result of subjecting the same image to the coarsening level 8. This leads to a reduction of 98% in the number of pixels. One can see that even this strong simplification of the image data preserves the original structures sufficiently well and only tiny details will not be resolved. In the next section, several coarsened meshes of different levels were taken and then mutually compared.
The FIB/SEM tomography data for the Al– Si alloy without a directional solidification was
treated exactly as described above. They were also rescaled and rotated after the segmentation, with the major distinction that two different resolutions were involved: one as mentioned above with 46 nm and one with the higher resolution of 25 nm to get a better resolution of the morphology of the Si corals.
A series of 338 images with a height of 338 pixels and a width of 332 pixels for the resolution of 25 nm and an image stack of 183 pictures with a height of 210 pixels and a width of 180 pixels for the resolution of 46 nm were achieved. Since these two grids were still too fine, they have also been coarsened by the same algorithmic strategy.
Fig. 4 shows one cut through the finite element mesh with the two resolutions. In the left cut with the resolution of 25 nm, one can see sharper contours and edges than in the right cut with the resolution of 46 nm. Overall, this leads to a better representation of the Si structures.
Fig. 3. One cut through the finite element mesh without coarsening (left) and the same cut through the level 8 finite element mesh (right).
Fig. 4. One cut through the finite element mesh with a resolution of 25 nm before the coarsening (left) and the same cut through the finite element mesh with a resolution of 46 nm (right).
NUMERICAL SIMULATIONS
aluminum phase, a Young’s modulus of E=70 GPa, a Poisson ratio of ν =0.34 and a yield strength of σy =40 MPa were used. For the eutectic silicon, the simulations were performed with a Young’s modulus of E =107 GPa, a Poisson ratio of ν =0.27 and a
yield strength ofσy=7 GPa.
The numerical simulations are realized with the structural mechanics module of COMSOL Multiphysics with an elasto-plastic material model combined with an isotropic hardening (Hill, 1998; COMSOL, 2010). All presented finite element simulations were achieved with quadratic Lagrange elements. The corresponding number of degrees of freedom (d.o.f.) for the different meshes is listed in the tables 2 and 3. In addition, the tables show also the computing time in seconds of the simulations on the individual meshes.
All simulations were executed on a DELL PowerEdge with 2 Intel Xeon CPUs and 72GB RAM. The linear systems are solved with the Flexible variant of the Generalized Minimum RESidual (FGMRES) method introduced in (Saad, 1986; 1993) with a geometric multigrid preconditioner with a V-cycle with two iterations, two levels, and the mesh coarsening factor two (Meister, 2007). The presmoother was the Successive Over-Relaxation (SOR) method with two iterations and the relaxation factor ω =1.2 (Braess, 2003). As postsmoother, the
SORU method (a version of SOR using the upper triangle of the matrix (COMSOL, 2010)) was chosen, with also two iterations and the relaxation factor
ω =1.0 (Meister, 2007), while the coarse solver was
the PARDISO method, a parallel sparse direct solver explained in (Schenk and G¨artner, 2004; 2006).
The numerical simulations of the deformation of the different Al–Si alloys were realized with the following boundary conditions: for every spatial direction, the displacement was fixed on one side of the mesh and a load curve was applied on the opposite side. After each simulation, a pressure-strain curve was computed by numerical integration of the displacement field in the corresponding spatial direction.
RESULTS
In some of the first performed numerical tests, linear and quadratic finite elements and different resolutions of the load curve were compared. These tests have shown that the pressure-strain curves of the simulations with the quadratic finite elements are a little bit below the pressure-strain curves of the simulations with the linear finite elements. The
resolution of the load curve has at least no optically visible influence on the plotted results. Nevertheless, in a test simulation with a pure aluminum specimen instead of an Al–Si alloy, unphysically spurious oscillations in the pressure–strain curve for load curves with a resolution of less than 30 load steps could be observed. For this reason, it was decided to use 45 load steps in all presented simulations.
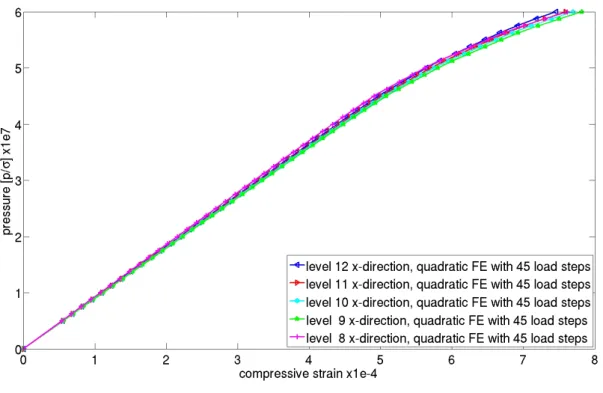
To get possible convergence results, the simulations were compared on different coarsening levels. Fig. 5 shows the pressure-strain curves for the meshes from level 12 to level 8 for the Al–Si alloy with a directional solidification inx-direction. Where the curves are slightly flattened with the increasing of the level number of the meshes, they all show the same behavior. This result is independent from the spatial direction of the load curve and could also be observed for the die cast alloys. Because of this convergence result combined with the fact that level 8 is nearly the possible maximum for the available computer power of the writers, it was decided to do the simulations at this maximum level. Thus, meshes that are close to the possible maximum, i.e. level 5 for the resolution of 25 nm and level 3 for the resolution of 46 nm, were also used for the die cast Al–Si alloys.
Fig. 6 shows the pressure-strain curves for computations of the Al–Si alloy with a directional solidification in thex-direction. One can see that the curve in the direction of the solidification is steeper than for the other two spatial directions, while the curves show a very similar behavior. In other words, the material shows, as expected, in the y- and the z -direction a transverse isotropic behavior with a higher strength in the direction of the coral growth and a lower in the transverse direction.
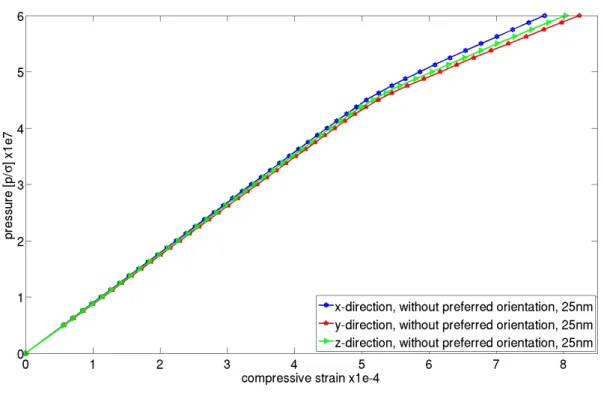
In contrast, it can be seen in Fig. 7 that the Al– Si alloy obtained by die casting shows the behavior of an isotropic material with nearly the same strength in every direction. Fig. 8 presents a comparison of the pressure-strain curves for the three different studied alloys. It turns out that the higher resolution of 25 nm in relation to the 46 nm for the Al–Si alloy obtained by die casting is reflected in a steeper pressure-strain curve. This shows once again that the algorithmic coarsening strategy preserves the image structures very well, despite the significant reduction of the image data.
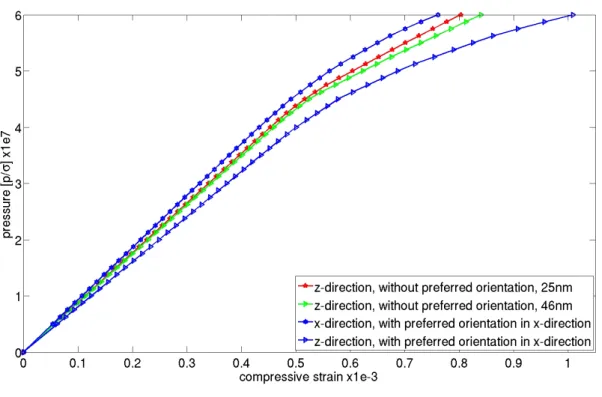
In the last Fig. 9 one can see, once again very well, the expected characteristics of the individual pressure-strain curves. For the pressure in the x-direction of the Al–Si alloy with a directional solidification in the
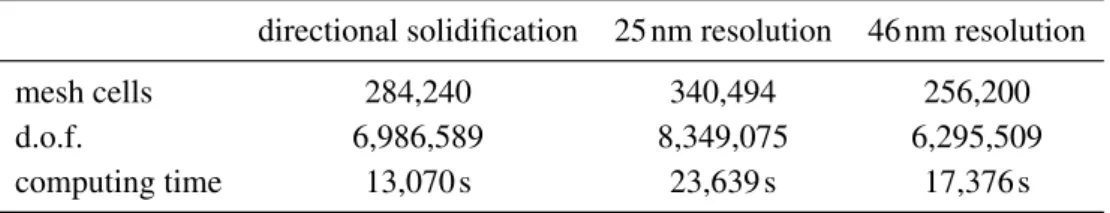
Table 2. List of the total number of mesh cells, the corresponding number of degrees of freedom, and the computing time for the finite element simulations for all three different meshes.
directional solidification 25 nm resolution 46 nm resolution
mesh cells 284,240 340,494 256,200
d.o.f. 6,986,589 8,349,075 6,295,509
computing time 13,070 s 23,639 s 17,376 s
Table 3. List of all coarsening levels, the total number of mesh cells, the corresponding number of degrees of freedom, and the computing time for the finite element simulation.
level 8 level 9 level 10 level 11 level 12
mesh cells 284,240 199,836 146,300 110,400 82,215 d.o.f. 6,986,589 4,926519 3,617,379 2,737,605 2,045,589 computing time 13,070 s 9,465 s 7,667 s 4,167 s 3,370 s
minimum strength of all simulations can be observed. The other simulations lie all within the range defined by these two limits that are governed by the given material structures.
The writers have chosen to only take into consideration the two shown pressure-strain curves to improve legibility, however the other pressure-strain curves reveal only slight deviations.
DISCUSSION
Finite element meshes of different coarsening levels have been generated directly from FIB/SEM tomography image data. The model computations have shown a convergence for the simulations of the different coarsening levels, which motivates the application of this approach to get meshes that are computable with finite elements outside large high performance clusters. Moreover, it was shown that the expected material properties are reflected in the results of the different Al–Si alloys: the mechanical behavior of the die cast alloy is isotropic in all three directions, while for the directionally solidified alloy, the mechanical strength in the direction of the temperature gradient is higher than in the transversal directions. This fact has to be taken into account when analyzing structures issued from different casting processes and is important for further investigations of the structure-properties relation. When analyzing the behavior of the die cast alloy, the load can be applied in any direction. When performing the FE simulations on directionally solidified alloys, the direction of the
coral growth and hence the load application direction influences the strength observed.
CONFLICT OF INTEREST
This article has been prepared in accordance with all ethical and scientific guidelines. The authors declare that no conflict of interest is associated with this manuscript.
ACKNOWLEDGMENT
The financial support of the Deutsche Forschungsgemeinschaft (DFG) under the grant DI 430/17-1 is gratefully acknowledged. The authors would also like to thank Gerd Gaiselmann from the Institute of Stochastic at the Ulm University for the rescaling of the 2D image stacks.
REFERENCES
Aleris Switzerland GmbH (2011). Aluminium Casting Alloys. Issue 12/11. 1st release.
Braess D (2003). Finite Elemente. Berlin: Springer. COMSOL (2010). COMSOL Multiphysics User’s Guide,
Version 4.3b.
Gaiselmann G, Neumann M, Holzer L, Hocker Z, Prestat M, Schmidt V (2013). Stochastic 3D modeling of LSC cathodes based on structural segmentation of FIB–SEM images. Comput Mater Sci 67:48–62.
Fig. 5.Comparison of the pressure-strain curves in x-direction for the Al–Si alloy with a directional solidification in x-direction on different coarsening levels.
Fig. 7.Comparison of the pressure-strain curves in the three orthogonal directions for the Al–Si alloy without a directional solidification and a resolution of 25 nm.
Fig. 9. Comparison of the pressure-strain curves in different spatial directions for the Al–Si alloy with a directional solidification in x-direction, the Al–Si alloy without a directional solidification and a resolution of 46 nm, and the Al–Si alloy without a directional solidification and a resolution of 25 nm.
Gaiselmann G, Thiedmann R, Manke I, Lehnert W, Schmidt V (2012). Stochastic 3D modeling of fiber-based materials. Comput Mater Sci 59:75–86.
Giannuzzi LA, Stevie FA (2005). Introduction to Focused Ion Beams. New York: Springer.
Gruzleski JE, Closset BM (1982). Structure and properties of hypoeutectic Al–Si–Mg alloys modified with pure strontium. Metall Mater Trans A 13:945–51.
Gruzleski JE, Closset BM (1990). The Treatment of Liquid Aluminum-Silicon Alloys. Des Plaines, IL, USA: American Foundrymen’s Society.
Haque MM (1995). Effects of strontium on the structure and properties of aluminium-silicon alloys. J Mater Process Technol 55:193–8.
Hegde S, Prabhu KN (2008). Modification of eutectic silicon in Al–Si alloys. J Mater Sci 43:3009–27.
Hill R (1998). The Mathematical Theory of Plasticity. New York: Oxford University Press.
Holzer L, Indutnyi F, Gasser PH, M¨unch B, Wegmann M (2004). Three-dimensional analysis of porous BaTiO3ceramics using FIB nanotomography. J Microsc 216:84–95.
Lasagni F, Lasagni A, Engstler M, Degischer HP, M¨ucklich F (2008). Nano-characterization of Cast Structures by
FIB-Tomography. Adv Eng Mater 10:62–6.
Meister A (2007). Numerik linearer Gleichungssysteme. Wiesbaden: Vieweg-Verlag.
Saad Y (1986). GMRES: A generalized minimal residual algorithm for solving non-symmetric linear systems. SIAM J Sci Stat Comput 7:856–69.
Saad Y (1993). A flexible inner-outer preconditioned GMRES algorithm. SIAM J Sci Comput 14:461–9. Schenk O, G¨artner K (2004). Solving Unsymmetric Sparse
Systems of Linear Equations with PARDISO. Future Gener Comp Sy 20(3):475–87.
Schenk O, G¨artner K (2006). On fast factorization pivoting methods for symmetric indefinite systems. Electron Trans Numer Anal 23:158–79.
Shin SS, Kim ES, Yeom GY, Lee JC (2012). Modification effect of Sr on the microstructures and mechanical properties of Al–10.5Si–2.0Cu recycled alloy for die casting. Mater Sci Eng A 532:151–7.
Stenzel O, Koster LJA, Oosterhout SD, Janssen RAJ, Schmidt V (2012). A new approach to model-based simulation of disordered polymer blend solar cells. Adv Funct Mater 22:1236–44.