Responding to Socially Desirable and
Undesirable Topics: Different Types of
Response Behaviour?
Henrik Andersen & Jochen Mayerl
Chemnitz University of Technology
Abstract
Social desirability describes the tendency of respondents to present themselves in a more positive light than is accurate and is a serious concern in surveys. If researchers are better able to understand the underlying mechanisms responsible for social desirability bias, they may be able to devise ways to identify and correct for it. One possibility involves determin-ing whether social desirability is more of a deliberate ‘editdetermin-ing’ of responses or an auto-matic, perhaps ‘self-deceptive’, act. Then researchers could potentially flag conspicuously fast or slow responses to improve data quality. We outline dual-process-related theoretical arguments for both scenarios and test their plausibility using data gathered in a tablet-based CASI survey of pre-service teachers in Germany that were asked to assess their suitability for their chosen profession. Our analysis involves the use of fixed-effects multilevel models that enable us to control for unobserved differences between respondent- and item-char-acteristics while also examining cross-level interactions between the predictors at various levels. Specifically, we examine the classic respondent- (i.e. need for social approval) and item-related characteristics (i.e. trait desirability) associated with social desirability bias, as well as the speed at which the respondents gave their answers. Doing so allows us to observe under what circumstances the respondents tended to overstate positive character-istics as well as understate negative ones. We find evidence for social desirability as an automatic as well as a deliberate response behaviour. However, the mechanism responsible for determining whether social desirability occurs automatically or deliberately seems to be whether the item content is desirable or undesirable. Desirable traits seem to elicit faster socially desirable responses whereas undesirable traits seem to elicit slower socially desir-able responses.
Keywords: social desirability, sensitive questions, response latencies, paradata, response bias, survey research, multilevel models
Direct correspondence to
Henrik Andersen, Technische Universität Chemnitz, Faculty of Behavioural and Social Sciences, Institute of Sociology, Chair for Sociology with a Focus on Empirical Social Research, Thüringer Weg 9, 09126, Chemnitz, Germany E-mail: [email protected]
Social desirability (SD) bias describes respondents systematically presenting them-selves in a more positive light than is accurate in self-reported surveys. It is a serious concern in survey research and can impact prevalence estimates of behaviour and attitudes as well as observed relationships between variables (Stocké & Hunkler 2007). For decades, researchers have tried to better understand the underlying pro-cesses that result in SD bias. Doing so may make it possible to identify measure-ment error due to SD and improve data quality (Tourangeau & Yan 2007). Much of the research thus far has focused on the question of whether SD is a deliberate or an automatic action. The main goal of this article is to contribute to finding an answer to this question. If it is mostly deliberate and respondents carefully consider the desirability of their answer before giving it, then it may be possible to ‘flag’ answers that took the respondent particularly long to answer, for example. If SD is mostly automatic, the same could be true for unusually fast answers.
The measurement of response latencies (RLs) provides a promising method of indirectly assessing the underlying processes associated with SD bias. In psycho-logical research, RLs have been used for decades as a common method of measur-ing cognitive processes (e.g. Fazio 1990b). In survey research, the development of computer assisted technology (e.g. CATI, CAPI, CASI) made it possible to include such measurements even in large-scale survey projects (e.g. Bassili & Fletcher 1991). One of the most prominent applications involves their use as a proxy mea-sure for cognitive processing modes (e.g. Fazio 1990a; Mayerl 2009) with faster responses suggesting a more automatic-spontaneous mode; slower responses a deliberate-controlled one.
Regardless of the promise RL measurement shows, it has become clear that the solution to the problem of SD is not as simple as: “socially desirable responses are fast/slow”. Rather, it seems a whole range of factors influence how respondents deal with survey questions. These include respondent-related personality traits, characteristics of the question content, the respondents’ unknown ‘true’ answers and characteristics related to the survey situation (see Krumpal 2013; Tourangeau & Yan 2007 for a comprehensive overview).
research question, we examine not only the classic respondent- (i.e. need for social approval) and item-related characteristics (i.e. trait desirability) associated with SD bias, but also the speed at which the respondents gave their answers. We observe under what circumstances the respondents tended to overstate positive character-istics as well as understate negative ones and tie the results back to the theoretical discussion.
In the next section, we outline a theory of SD responding that incorporates both automatic and deliberate viewpoints and allows us to generate logical expecta-tions for the later analysis. After giving an overview of our data and variables, we outline the analytical strategy which involves the specification of successive mul-tilevel models. We then present our empirical results and finally summarize and discuss the implications for future research.
Theoretical Background
In this section, we outline two typical ways to approach the topic of SD: as a delib-erate utility maximizing- and an automatic norm-conforming behaviour. We focus on some influential works by researchers in the analytical-empirical tradition.
Dual Processes and the Determinants of Social Desirability
It is now well established that SD bias encompasses at least two distinct factors (Holtgraves 2004; Krumpal 2013; Paulhus 1984; Paulhus & Reid 1991; Tourangeau & Yan 2007; Wiggens 1964). What is referred to as impression management
describes situations in which respondents deliberately misreport either to gain approval or avoid disapproval. Self-deception, on the other hand, describes self-reports that are inflated but sincere (Paulhus 1984). Two different underlying cogni-tive processes are implied: impression management is a rational, utility-maximiz-ing action that is motivated by the goal of gainutility-maximiz-ing approval or avoidutility-maximiz-ing disapproval. Self-deception can be seen as an automatic reaction to highly accessible and inter-nalized social norms (Esser 1990; Kroneberg 2006).
what is referred to as variable rationality; the idea that actors reduce complexity and effort with the help of symbols, norms, habits and emotions (Kroneberg 2006). Both of these extensions are important for the analysis of SD bias and will be dis-cussed in turn.
The MFS assumes actors go through several implicit steps before acting. The actor must first interpret the situation (frame selection), then they must identify sets of appropriate behaviours for the situation (script selection), before then per-forming the action (action selection) (Kroneberg 2006). The extent to which actors go through these steps in a deliberate as opposed to a spontaneous fashion refers to the assumption of variable rationality. Frames, scripts and actions can thus be selected in either a deliberate reflecting-calculating (rc) or automatic-spontaneous
(as) manner (Esser 1991b; Kroneberg 2006). The factors that are said to determine the mode of selection are opportunities, motivation, effort and accessibility (this is compatible with social psychological dual-process theory, e.g. Fazio 1990a; see for an overview Mayerl 2009). Opportunities refer to things like time or capabilities; motivation is often provided by fear of making a wrong decision; deliberate consid-eration requires effort (whereas automatic actions require little); accessibility refers to the ease of finding appropriate selections (Kroneberg 2006).
In terms of SD, two of the most prominent applications of the MFS, an arti-cle by Esser from 19901 and another by Stocké from 20042, present contradictory
accounts with regards to the question of whether SD is an automatic or deliberate action. It is important that the reader is aware of the fact that we will first outline the arguments as they were originally presented, and that the discrepancies therein represent part of the puzzle we wish to contribute to solving.
SD as an Automatic Response Behaviour
Esser (1990) describes social desirability as an automatic action that is the result of the cognitive accessibility, or match, of the frame of SD. He sees SD as a response set; a temporary strategy employed by respondents with a strong internalized need for social approval (NSA) to simplify their choice of actions. He describes that in a low-cost situation3 such as a survey, the default mode for respondents is one of cooperation (‘provide valid answers’). For the frame of SD to become activated
1 Here it is important to note that when we refer to ‘Esser’s standpoint’, we are referring to the argument laid out in 1990. At various points, Esser has presented both perspec-tives: making the argument for social desirability as a utility-maximizing behaviour (1986; 1991b) as well as a spontaneous norm-conforming behaviour (1990).
2 Stocké published a very similar article in English in 2007 that covers the same theoreti-cal ground.
and override the cooperative survey frame, the normative expectations of the situ-ation must be transparent. This means the respondent must be able to recognize the existence of a social norm and determine which response option best fulfils the expectation (see also Wolter 2012). This transparency is based on the so-called trait desirability (TD) of the item. Trait desirability describes the overall strength and direction of the desirability of the question’s content. It can be operationalized in various ways and summarizes the individual-level desirability beliefs (e.g.: “I think smoking is an undesirable habit”, “Having had many sex partners is desirable”, “Is it desirable or undesirable to say negative things about refugees?”). Esser’s conception of SD suggests an interaction between TD and the respondent’s NSA. TD informs the respondent about the normative expectations of the situation, the salience of which is increased by the respondent’s NSA.
Esser’s outline of SD thus hinges on the respondent choosing the frame of SD (Fsd) out of the set of other possible frames (SF =
{
Fsd ∈{
F1, , FN}
for all,
j N j sd∈ ≠ ), of which the assumed default frame of cooperation, Fc (lower case
‘c’), is part of j. This means the match of the frame of SD (msd) must be greater than
the match of any other frame:
,
sd j
m >m , (1)
where, for him, msd =TD NSA× . This conception of a match corresponds to the
idea that there must be situational objects present relevant to the frame (TD) and that the respondent must connect these objects to the frame (NSA, see Kroneberg 2006). Furthermore, if the automatic mode is activated, that is, the match is strong enough to at least equal the effort relative the subjective expected utility of the rc-mode, then the respondent will act automatically based on the activated frame of SD:4
( )
( )
SEU as ≥SEU rc
4 We use Kroneberg’s (2005; 2006) formalization for the sake of simplicity for much of this paper although there are other variants (e.g. Esser (2001; 2003) and Mayerl (2009). For low-cost situations like the vast majority of surveys, all three of these variants come to the same conclusion that a perfect match (m = 1) will always block the rc-mode (see Mayerl (2009) for an in-depth discussion on this topic). In high-cost sit-uations, the versions of Esser and Kroneberg differ from Mayerl’s: his MFSE (with
‘exit option’) states that, especially when the costs of choosing wrongly are high, a person may deliberate before acting even if the match is perfect. This can be shown by his formalization of the conditions necessary for the switch from as- to rc-mode
(SEU rc
( )
>SEU as( )
→(
Urc−C) (
− mU Ci i− w)
+Uintrinsic motivationp mU> i i, comparewhich derives (2)
(
)
(
)
1
sd rc w
m ≥ −C p U +C
(Kroneberg 2005, 2006) where msd is the degree of match between the situation
and the frame of SD, C represents the costs associated with a deliberate choice (i.e. effort), p is the opportunity for reflection and Urc + Cw summarizes the motivation;
with Urc as the utility of a deliberate choice and Cwthe consequences of choosing
wrongly (Fazio 1990a; Kroneberg 2005). This is at least the case in low-cost situa-tions (e.g. surveys) where a sufficient match of a frame can directly influence action, thereby skipping the script- and action-selection phase (Esser 1990; Kroneberg 2005; 2006; Mayerl 2009).5 Even if we cannot operationalize the right-hand side
of Inequality (2), we can make the ceteris paribus assumption that the clearer the norm (TD) and the higher the salience (NSA), resulting in a high match of frame and situation, the more likely an automatic SD response.
SD as a Deliberate Response Behaviour
Stocké (2004; 2007) describes the opposite standpoint. He sees SD as a deliber-ate utility-maximizing action. While Esser assumes the cooperative frame (Fc) per
default, Stocké expands on this assumption and states that the extent to which the respondent cooperates with the goals of the researcher is determined by the (strength of their) attitude towards surveys. The more positive and cognitively accessible their attitude towards surveys, the more likely they cooperate. Respondents stray from their cooperative role when the subjective utility of a SD response crosses a certain threshold. Specifically, the subjective expected utility (SEU) increases based on the presence of three components: 1) the respondent’s approval motive
[ ]
(
USD∈ 0,1 , 2)
)
clear desirability beliefs(
∆wTD ∈ − +[
1, 1]
)
and 3) an absence ofprivacy (wp∈
[ ]
0,1 , Stocké 2004; 2007):( )
SD TD pSEU SD U= × ∆w ×w , (3)
Being a multiplicative equation, each of these components must be given in order to expect an SD response and turn the respondent from a cooperator to a ‘conformer’.
5 When, for example, the frame clearly defines both the script and action: aj=1, aj i| =1
and ak j| =1, where aj i| is the accessibility of script j given frame i, aj is the availability
of script j and ak j| is the degree to which script j regulates action k. In such case, the activation weight of action k
(
AW A S( | )k j)
is governed solely by the match of theAlthough not explicitly stated by Stocké, his argumentation seems to represent a truncated and somewhat altered version of the typical decision-theoretic specifi-cation of the conditions for the switch from an as- to an rc-mode:
( )
( )
SEU rc >SEU as
which derives (4)
(
1 c)(
rc w)
p −m U +C >C,(Kroneberg 2005; 2006; Kroneberg et al. 2010) where
(
1−mc)
is the degree ofmismatch between the situation and the default frame (in this case of cooperation). We can assume that, for most respondents, the opportunity for reflection (p, i.e. ability) is given and thus equals one. If we can accept that USD× ∆wTD×wp
represents the respondent’s motivation to give an SD response,6 we can state that
the respondent may switch to a deliberate mode and consider the option of giving an SD answer if he or she identifies an alternative frame and has the motivation to do so:
(
1−m Uc)
(
SD× ∆wTD×wp)
>C. (5)Inequality (5) is our own interpretation of Stocké’s (2004; 2007) argument brought together with the more general decision-theoretic specification of Kroneberg (2005; 2006; Kroneberg et al. 2010). While it is typically difficult to operationalize the degree of mismatch (1−mc), we can state that, ceteris paribus, the likelihood of a
deliberate SD response increases with motivation (the second bracketed parameter in Inequality (5)).
Stocké’s (2004; 2007) assertion that privacy concerns are necessary to expect an SD response is problematic for several reasons. For one, findings on the effect of anonymity of SD bias are mixed. There is a great deal of empirical research find-ing anonymity has little or no effect on SD (e.g. Börger 2013; Dwight & Feigelson 2000; Hancock & Flowers 2001; Krysan 1998; Northover et al. 2017; Richman et
6 It is not entirely clear, based on Stocké’s (2004, 2007) argumentation, how the approval motive, trait desirability and privacy concerns should translate into the more general MFS framework. We could speculate that the respondent’s approval motive multiplied by the desirability beliefs concerning a survey item could represent the utility of a de-liberate choice
(
USD× ∆wTD=Urc)
, and that privacy concerns represent the costs of awrong choice
(
wp=Cw)
. This would change Stocké’s assertion that a lack of privacyconcerns should negate entirely the utility of an SD response (making the contribution of wp additive rather than multiplicative) and brings it more in line with our belief that
al. 1999; Weisband & Kiesler 1996).7 From a theoretical standpoint, it can also
be argued that intrinsic motivations can lead respondents to provide SD answers even in anonymous conditions. Wolter (2012), for example, points to the concept of cognitive dissonance which was introduced by Festinger (1957). Cognitive disso-nance describes discomfort that results when conflicting attitudes exist at the same time or when one’s attitude and behaviour does not match (Wolter 2012, p. 166). For example, cognitive dissonance could result when a pre-service teacher believes strongly that good teachers are funny, but realizes that they themselves are not funny. One way to deal with cognitive dissonance and relieve the feeling of discom-fort (especially when other options – such as changing one’s behaviour – are out of the question) is to trivialize or ignore the existence of dissonant attitudes, beliefs or behaviours. Thus, we can assume that non-conformity to social norms can create cognitive dissonance in respondents, and that this can occur even in anonymous conditions. In fact, as Wolter (2012) points out, it may be more accurate to say that intrinsically motivated desirable responses are the result of the frame of ‘neutral-izing cognitive dissonance’ that is functionally equivalent to the frame of ‘social desirability’ as outlined above. Also, as early as 1986, Esser described this type of intrinsically motivated SD as ‘cultural’ and the more traditional type outlined by Stocké (2004; 2007) as ‘situational’ SD.
For these reasons, we expect SD responses to be the result of the respondent’s need for social approval and their desirability beliefs – or, indirectly, the trait desir-ability of the item. A lack of anonymity, whether perceived or real, may increase the likelihood of a ‘situationally’ motivated SD response, but we do not expect that it is necessary. Rather, in accordance with the cognitive dissonance argument, the mere fact that the respondent realizes their behaviour or characteristics do not live up to either their own beliefs or attitudes, or the predominant views of society in general, should be enough to generate SD bias. The question remains whether the determinants of SD bias encourage an automatic norm-conforming- or a deliberate approval-maximizing response. This will be the focus of the next section.
Desirable vs. Undesirable Traits
The arguments for SD bias as an automatic and as a deliberate action both point to the same main determinants: the respondent’s need for social approval and the trait desirability of the item. The argument for SD as an automatic action states that the presence of both determinants increases the likelihood that the frame of SD can be matched to the situation, leading to quick SD responses. The argument for SD as
a deliberate action states that these same determinants increase the motivation to consider the option of providing an untruthful answer. This should lead to slower SD responses.
It is unlikely that the respondent’s NSA on its own should govern the mode of responding. It does not seem plausible, for example, to assume that a respondent with a strong NSA will always answer faster or slower than a respondent with less of the characteristic. Rather, SD hinges on the transparency of the existence of normative expectations; i.e. the desirability beliefs of the respondents vis-à-vis the particular item content. NSA can be seen as heightening the salience of these sub-jective social norms (Esser 1990).
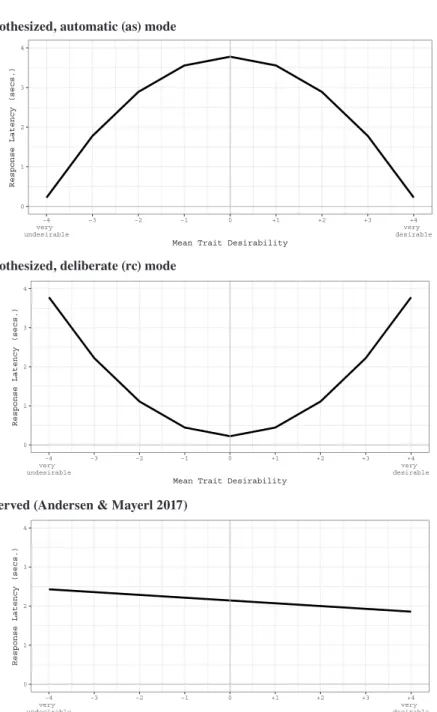
Thus, it would seem the mode selection, automatic or deliberate, is dependent primarily on the item content. If we imagine a graph with an item’s TD on the x-axis ranging from very undesirable to very desirable (with neither undesirable nor desirable in the middle of the scale) and the response latencies on the y-axis, the automatic argument would suggest an inverted U-shape: the clearer the social norms are (increasing desirability and undesirability), the faster the responses should be. On that same graph, the deliberate argument would suggest the opposite: a U-shaped curve with responses becoming slower the clearer the social norms. The top two panels of Figure 1 summarize these theoretical expectations.
Results of a Previous Study
In a previous study, we examined the relationship between item- and respondent-related characteristics and response latencies (Andersen & Mayerl 2017). Whereas response latencies are the independent variable in this study, then they were the dependent variable. The aim of the study was to take a preliminary look at how the determinants of SD (particularly TD and NSA) affected the length of time the respondents took to answer the questions. In terms of TD, we did not find the expected U- or inverted U-shaped curve as outlined above, as the squared TD term had no significant effect. Rather, the main effect of TD was negative and significant. The bottom panel of Figure 1 shows the empirical results contrasted with the theo-retical expectations outlined above.
Hypothesized, automatic (as) mode
0 1 2 3 4
−4 very undesirable
−3 −2 −1 0 +1 +2 +3 +4
very desirable
Mean Trait Desirability
Response Latency (secs.)
Hypothesized, deliberate (rc) mode
0 1 2 3 4
−4 very undesirable
−3 −2 −1 0 +1 +2 +3 +4
very desirable
Mean Trait Desirability
Response Latency (secs.)
Observed (Andersen & Mayerl 2017)
0 1 2 3 4
−4 very undesirable
−3 −2 −1 0 +1 +2 +3 +4
very desirable
Mean Trait Desirability
Response Latency (secs.)
Note. The scale of the y-axis as well as the exact shape of the curve in the hypothesized diagrams is arbitrary; see Andersen & Mayerl 2017
We took this as evidence to suggest that not only the transparency of the social norm surrounding a survey item but also its direction is important for deter-mining the mode of responding. Undesirable item content seems to trigger more deliberate responses while desirable item content seems to lead to more automatic ones. In fact, some research has dealt with the possibility that certain respondents react more strongly to desirable content and others to undesirable content. Paul-hus has even suggested a four-factor typology of SD responding that differenti-ates between the degree of awareness (impression management vs. self-deception) as well as the content (Paulhus 2002). Along the content dimension, respondents are grouped according to their motivation for answering untruthfully. Respondents that are motivated by egoistic factors attempt to present themselves in an overly positive light, highlighting their social and intellectual traits such as dominance, fearlessness, emotional stability, intellect and creativity (Paulhus 2002, p. 63 f.). Respondents that are motivated by moralistic factors tend to deny socially-deviant characteristics and claim such social qualities as agreeableness, dutifulness and restraint (Paulhus 2002, p. 64). Uziel (2010) refers to a similar typology and uses labels previously coined in earlier work by Paulhus & Reid (1991): adjustment and
defensiveness.8 Defensiveness is characterized by the “avoidance of threatening
situations” (Uziel 2010, p. 247), and that defensive respondents are motivated not by “social approval, but rather the avoidance of social disapproval” (Uziel 2010, p. 247). Adjustment describes respondents that tend to use the survey situation as a way to exaggerate positive characteristics like friendliness, stability and well-being (Uziel 2010, p. 248).
While research on the topic of a possible four-factor model of social desir-ability (impression management vs. self-deception and egoistic vs. moralistic) has not fully matured for various reasons,9 we believe this line of reasoning may be
promising in explaining why response latencies seem to react differently based on the content of the question. Without the possibility of operationalizing a fully dif-ferentiated NSA scale, our preliminary work nevertheless leads us to believe that not only the strength but also the direction of the TD should be of importance.
8 There are other terms used to describe this difference, Damarin & Messick (1965), refer to ‘propagandistic’ and ‘autistic’ motives, for example.
Research Questions and Hypotheses
This study is interested in examining two main questions. First, is SD the result of an automatic or a deliberate process? We examine this question by specifying a three-way interaction between the determinants of SD (trait desirability and need for social approval) and the response latencies, and observing the self-reported scores given by the respondents. If SD is an automatic behaviour as outlined by Esser (1990), then we should observe more biased scores when the match is suffi-cient (msd =TD NSA× ) and therespondent answers quickly. If SD is a deliberate
behaviour as argued by Stocké (2004, 2007), then scores should be more biased when the motivation is sufficient (U TD NSA= × ) and the respondent answers slowly. Again, the inconsistency of the views of Esser and Stocké should be clear: how can the interaction between TD and NSA at once represent the match and the motivation? However, by looking at the three-way interaction TD NSA RL× × and observing how respondents answered, we aim to identify which conceptualization is more plausible. It is entirely possible that any and all components of the interac-tion could fail to show significant effects on the scores of the respondents. It could be that the interaction TD NSA× affects scores but that speed at which the respon-dent answers plays no role, for example. We therefore proceed in a step-wise fash-ion, first looking at the main effects individually, then the two-way effects before finally moving on the suggested three-way interaction.
With our second research question we hope to contribute to finding a way to bridge the gap between the competing conceptualizations. It seems likely, based on an abundance of empirical evidence, that SD can be both an automatic as well as a deliberate behaviour. But what are the mechanisms responsible for determining the mode? Obviously, we cannot state that TD NSA× at once causes automatic and deliberate SD responses. However, based on the four-factor SD typology put forth by Damarin & Messick (1965), Paulhus & Reid (1991), Paulhus (2002), and Uziel (2010) and our observations from previous research, we have reason to believe that the direction of the TD, whether desirable or undesirable, may be an often-over-looked factor that influences how SD manifests.
We integrate the theoretical and empirical knowledge and formulate the fol-lowing hypotheses:
Hypothesis 1: highly desirable item content and a strong need for social approval
should mean that faster responses are associated with more positive scores. Hypothesis 2: highly undesirable item content and a strong need for social approval
Data and Method
Data
The study uses data from a research project carried out at the Technische Uni-versität Kaiseralutern called EVA3PLUS. The project is a longitudinal panel-study with computer assisted self-interview (CASI) tablet questionnaires with three sur-vey waves taking place at intervals of around six months. The project attempted to conduct a complete sample of all biology and chemistry pre-service teachers at the Gymnasium-level (a university/college preparation-level secondary school form in Germany) in Rhineland-Palatinate from mid-2014 to mid-2017. In total, the over-all sample size for the study is 631 with 416 individual respondents participating between one and three times. Substantively, the study looks at pre-service biology and chemistry teachers’ attitudes and behaviours with regards to using experiments in the classroom. The methodological focus of the project is on the use of response latencies to improve the quality of survey data.
Variables
The dependent variable are scores on 30 items of teacher-related characteristics, each measured on a 7-point rating scale (Appendix 1 shows the descriptive statis-tics of the dependent variable and Appendix 3 reports the wording of the 30 items along with the mean trait desirability scores). The items asked respondents to self-assess their qualities as a teacher. They included statements such as “Spending time with teenagers is a lot of fun” and “I feel insecure when I have to speak in front of others”. Normatively speaking, these are characteristics teachers should (or should not) possess: they should like spending time with teenagers and should not have problems speaking in front of others, for example. We assume, therefore, that they are principally sensitive topics for future teachers. Although the surveys were con-ducted anonymously and without the presence of an interviewer, we assume further that confronting the fact that one does not possess a desirable characteristic (or rather that one possesses an undesirable characteristic) will lead to uncomfortable cognitive dissonance (“I want to be a teacher, but I am not good at being a teacher”, see Wolter 2012). Items suggesting undesirable characteristics were recoded so that higher values always indicate more desirable answers (agreeing to possessing posi-tive characteristics and disagreeing to negaposi-tive ones).
The response latency variable is continuous; it does not represent a dichotomous pair of options but rather illustrates a continuum with a deliberative-controlled mode on the pole of high elaboration and the automatic-spontaneous mode at the other extreme end of low elaboration (see for more on this Carlston & Skowronski 1986; Gibbons & Rammsayer 1999; Mayerl 2010; Schaffner & Roche 2016, Shep-pard & Teale 2000; Shiv & Fedorikhin 2002).
Desirability beliefs can be assessed by either asking the respondent them-selves whether a characteristic is desirable or undesirable in their opinion, or by asking the respondent to judge how the characteristic is viewed by society in gen-eral (Stocké 2004). In either case, the trait desirability of an item is generated by aggregating the individual desirability beliefs into an overall measure. In order to assess the trait desirability of the items, a small secondary pencil-and-paper sur-vey of other students in biology and chemistry teachers’ education programs at the Technische Universität Kaiseralutern was conducted (n = 77). The sample popula-tions of the main study and the small trait desirability supplementary study can be seen as very homogenous groups. The students were asked to assess how desirable the various teacher characteristics were seen in society in general. The scale ranged from -4: “extremely undesirable” to +4: “extremely desirable” with 0 as the middle category: “neutrally seen”. The mean scores can be found in Appendix 3.
The respondents’ need for social approval was measuring using two items from the Crowne-Marlowe SD scale (Crowne & Marlowe 1960, p. 351). The index was created as an average of the two scores, displaying satisfactory characteristics (α = .65). In cases in which the respondent answered the NSA scale in two different waves of data collection, the NSA score was averaged over the two occasions. If the respondent took part more than once in the overall survey but only provided valid NSA scores on one occasion, those values were copied over to the other wave(s). We feel comfortable in doing this as NSA is typically seen as a stable personality trait: zi as opposed to zit to put it in terms of a typical panel analysis, see the
ana-lytical strategy section (DeMaio 1984; Krumpal 2013; Tourangeau & Yan 2007). The descriptive statistics of the items are found in Appendix 2. In order to better interpret the three-way interaction between TD, NSA and RL, for the analysis we collapsed the scale into a dichotomous variable with 0 = weak to moderate NSA (< 6) and 1 = strong NSA (≥ 6).
respondents and items (more on that below, see Enders & Tofighi 2007; Rüttenauer 2018). Descriptive statistics of the predictors can be found in Appendix 1.
Self- vs. Other-Assessment
Without validation data, studies looking at SD bias are often forced to use the ‘more (or less) is better’ assumption (Wolter 2012). Here, we take higher item scores as an indication of more biased responses. Obviously, this assumption is problem-atic because it is not possible to disprove that high item scores are not just truthful answers by respondents that actually possess a desirable trait to a high degree. To
● ● ● ● ● ● ● ● ● ● ● ● ● ● ● ● ● ● ● ● ● ● ● ● ● ● ● ● ● ● T1 T2 [−] T3 H1 H2 H3 [−] Fr1 Fr2 [−] Fr3 C1 C2 [−] C3 Fl1 Fl2 [−] Fl3 Em1 [−] Em2 Em3 D1 D2 [−] D3 M1 M2 [−] M3 Ex1 [−] Ex2 Ex3 En1 En2 [−] En3 Enthusiasm 3 Enthusiasm 2 [−] Enthusiasm 1 Expression 3 Expression 2 Expression 1 [−] Manner 3 Manner 2 [−] Manner 1 Didactics 3 Didactics 2 [−] Didactics 1 Empathy 3 Empathy 2 Empathy 1 [−] Flexibility 3 Flexibility 2 [−]Flexibility 1 Conflict 3 Conflict 2 [−]Conflict 1 Frustration 3 Frustration 2 [−] Frustration 1 Humour 3 [−] Humour 2 Humour 1 Teenagers 3 Teenagers 2 [−] Teenagers 1
−1.0 −0.5 0.0 0.5 1.0
Mean Difference (Other− minus Self−Assessment)
Item
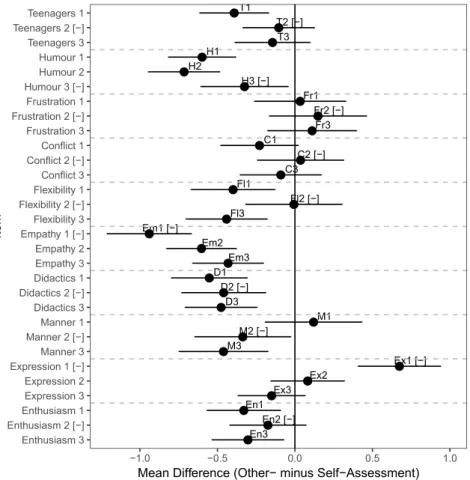
Note. Error bars show confidence intervals (95%); [-] identifies undesirable item content; created with sjPlot package in R (Lüdecke 2017)
some extent, this is not particularly troubling because we include explicit SD indi-cators as explanatory variables in the model. If high item scores are not at least partially the result of SD bias, then we should not expect any meaningful results from these predictors.
To further put concerns to rest, we collected a secondary sample in which we asked the instructors at the teachers’ colleges (n = 175) to assess the study respon-dents’ possession of the 30 characteristics. The ‘other-assessment’ questionnaires were sent out within a week or so of the respondents having completed the main survey. This other-assessment survey gives us an external criterion with which we can test the plausibility of the assumption that some scores are, indeed, biased by SD. Figure 2 summarizes the results of this secondary study. It shows the mean differences between the other- and the self-assessments (with 95% confidence inter-vals). Negative values indicate the respondents’ instructor rated the person more poorly than the person rated themselves. We take mean values in the negative range as evidence that a substantial number of respondents answered in an SD fashion (i.e. presented themselves in a more positive light than the external criterion).
Unfortunately, due to the relatively small sample size and further item non-responses, it was not practical to include this information in the following statistical models. However, the findings give us confidence in continuing on with the analysis under the assumption that more positive self-assessments are at least partially the result of SD bias.
Analytical Strategy
The data is structured as follows: respondents (j= …1 J) and items (k= …1 K) are crossed; each respondent answers each item and each item is answered by each respondent (at least ideally, given no item nonresponse). We refer to measure-ments at the lowest level (i= …1 N) as ‘events’ which are nested at once within both respondents and items. Events cover all variables that vary within respondents and items, including response latencies (which we can refer to as xi jk( )) and our
dependent variable, item scores (yi jk( )). The respondents’ need for social approval
(NSAj) and the item’s trait desirability (TDk) vary across respondents and items,
respectively.
dif-ferences between respondents and items. For this reason, such models are some-times referred to as fixed-effects multilevel models (e.g. Rüttenauer 2018). In fact, for studies interested in the effect of level-1 predictors or cross-level interactions, Enders & Tofighi (2007) suggest always centering level-1 variables within-cluster. Variables at the higher level were centered around the grand mean except for the dummies for NSA, sex, and repeat respondents which retained their original metric. We began our analysis by specifying an intercept-only model (Model 0, not shown in Table 1) that included random intercepts for respondents and items but no predictors at any level. The interclass correlations (ICCs) obtained from that model showed that 17% (ρj =.17) and 4% (ρ =k .04) of the variance in item scores (y) is
attributable to the respondents and the items, respectively (for more on this see Hox et al. 2018). In a second step, we tested whether the slopes of RL on scores var-ied systematically between respondents or items. The results showed a model that included by-respondent and by-item intercepts and by-item random slopes for RLs. We settled on this model specification based on a likelihood ratio test that showed significant by-item slope variation compared to one with only random intercepts (χ2
( )
1 =29.566, 0.001p< , see Baayen, Davidson & Bates 2008).In order to gain a better understanding of the contribution of the various pre-dictors, we proceed in a step-wise fashion, first introducing the main effects of all predictors at the various levels (Model 1), before then introducing two-way interac-tions between the predictors of interest (Model 2), and then finally introducing the three-way interaction between the determinants of SD (TD and NSA) and the RLs (Model 3). Doing so allows us to observe the effects in isolation before moving on to the interpretation of the more complicated ones. Model 1, which includes the main effects of all predictors at all levels can be written as
( ) ( ) ( )
( )
( ) ( )( )
( )
( )
( )
( ) ( )0 00 1 00 0 10
0 0 1
0 01 ,
j
i jk i jk
k j k k i jk i jk
item score RL NSA
TD u u u RL e
γ γ γ
γ
= + + +
+…+ + + + (6)
where γ0 00( ) is the overall intercept, u0j, u0k and ei jk( ) are the respondent-, item-
and idiosyncratic deviations from the overall mean and
u
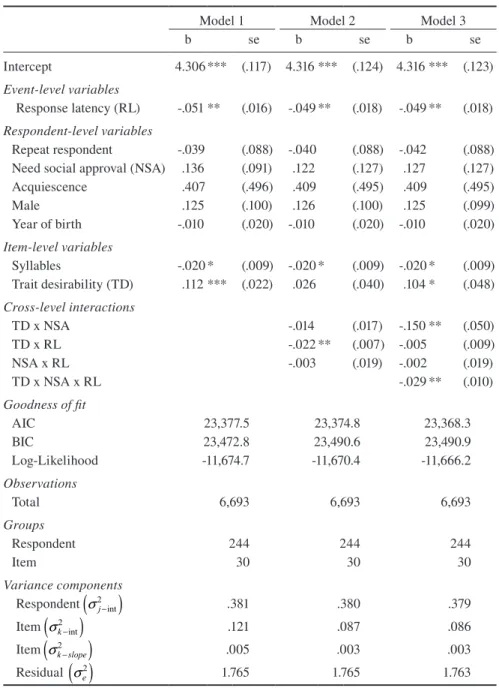
1k the by-item randomTable 1 Fixed-effects multilevel models, dependent variable: item scores (recoded)
Model 1 Model 2 Model 3
b se b se b se
Intercept 4.306*** (.117) 4.316 *** (.124) 4.316 *** (.123)
Event-level variables
Response latency (RL) -.051 ** (.016) -.049 ** (.018) -.049 ** (.018)
Respondent-level variables
Repeat respondent -.039 (.088) -.040 (.088) -.042 (.088) Need social approval (NSA) .136 (.091) .122 (.127) .127 (.127)
Acquiescence .407 (.496) .409 (.495) .409 (.495)
Male .125 (.100) .126 (.100) .125 (.099)
Year of birth -.010 (.020) -.010 (.020) -.010 (.020)
Item-level variables
Syllables -.020* (.009) -.020* (.009) -.020* (.009) Trait desirability (TD) .112 *** (.022) .026 (.040) .104 * (.048)
Cross-level interactions
TD x NSA -.014 (.017) -.150 ** (.050)
TD x RL -.022 ** (.007) -.005 (.009)
NSA x RL -.003 (.019) -.002 (.019)
TD x NSA x RL -.029 ** (.010)
Goodness of fit
AIC 23,377.5 23,374.8 23,368.3
BIC 23,472.8 23,490.6 23,490.9
Log-Likelihood -11,674.7 -11,670.4 -11,666.2
Observations
Total 6,693 6,693 6,693
Groups
Respondent 244 244 244
Item 30 30 30
Variance components
Respondent .381 .380 .379
Item .121 .087 .086
Item .005 .003 .003
Residual 1.765 1.765 1.763
Note. Estimator: REML, for goodness of fit statistics model was re-ran with ML; event-level predictor RL was centered within-cluster, higher event-level variables centered around grand mean; unstandardized estimates; models estimated using lme4 package in R (Bates et al. 2015); ***p<.001, **p<.01, *p<.05, +p<.10; two-sided test
(
2)
int
j σ −
(
2)
int
k σ −
(
2)
k slope σ −
( )
2Analysis
The results of the analysis can be found in Table 1. It shows the unstandardized coefficients (b) and standard errors (se). As for Model 1, which includes only the main effects of the predictors at all levels, we see that the TD of the item has a sig-nificant positive effect on scores (b = .112, p < .001), meaning the more desirable the trait, the more respondents tended to claim to possess it. Here it is important to note that while scores were recoded so that higher values always indicated more desirable responses, TD was measured on a bipolar scale (from -4 to +4 before centering).10 This means that undesirable and desirable items were not treated
equally by respondents. Desirable traits lead disproportionately to more positive answers than undesirable traits lead to less negative ones. Finally, we observe a sig-nificant negative effect of RLs (b = -.051, p < .01). The longer the respondent took to answer the question, the more negatively the respondents rated their qualities as a teacher. Looking just at the isolated effect of RLs on scores, however, does not tell us anything about SD responses. In order to better understand the extent to which RLs relate to SD, we must look at them in combination with the determinants of SD. This is shown in Model 2.
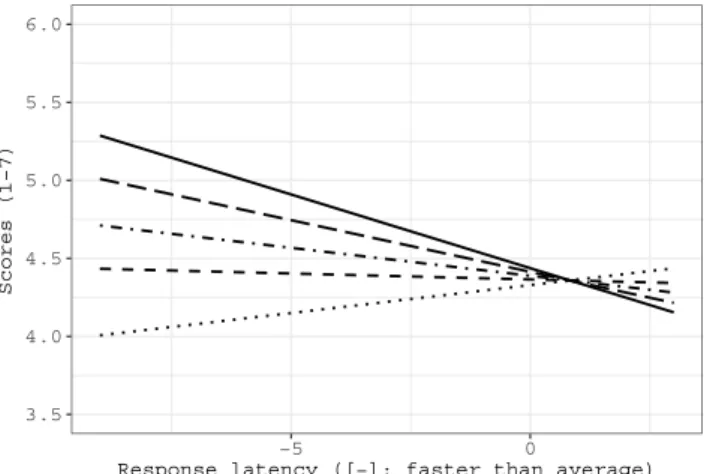
Model 2 introduces all two-way interactions that are implied by the three-way interaction in Model 3. Here, we see that the interaction between the TD and RL is significant (b = -.022, p < .01). Figure 3 shows the interaction graphically. The result suggests that only fast responses seem to be influenced by the desirability of the item content. This is evidenced by the intercepts, the ranking of which cor-responds to the TD value. Amongst fast responses, the difference in scores between very desirable (solid line, +2) and very undesirable (lower dotted line, -4) items is fairly substantial, roughly one and a half scale-points. On the other hand, there is almost no difference in scores for slow responses based on TD. As mentioned ear-lier in reference to the previous study, here too the effect of TD does not seem to be simply due to the item keying. If it was, the regression lines would not fan out. If this was the case, the slopes for the items of above-average desirability would overlap; the same would go for the undesirable side. Also, as with the effect of TD in Model 1, scores are disproportionately affected by desirable item content. In fact, the regression slope for the most undesirable content (lower dotted line) is slightly positive, meaning respondents answering more slowly to these items rated their teaching characteristics more positively. However, it is difficult to interpret this as an ‘editing’ process (Tourangeau & Yan 2007) as the slowest of responses are not nearly as positive as the fast responses for desirable items.
In model 2, the main effect of TD falls out of significance. As is the case in all models, the effect of the number of syllables is significant (the effect stays constant throughout at b = -.020, p < .05). The longer the question, the more negatively the respondents rated their teaching qualities. On the other hand, the interactions of NSA with TD and RL are not significant. This means that the speed of responses does not moderate the effect of NSA on scores and that the central implied interac-tion TD NSA× does not systematically influence scores.
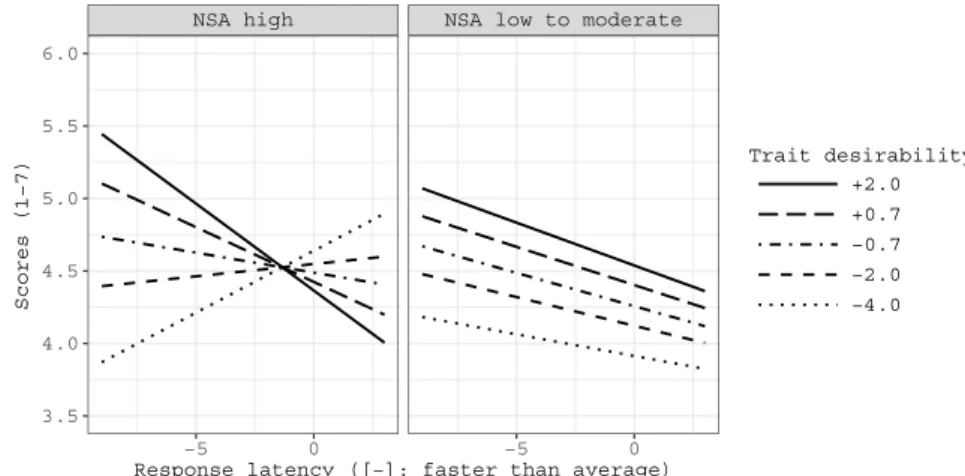
Although Model 2 shows the central interaction is not significant, we never-theless test the three-way interaction TD NSA RL× × in Model 3. This interaction is in fact significant (b = -.029, p < .01) and can be inspected graphically in Figure 4. Whereas Figure 3 suggests that only fast responses are affected by TD, Figure 4 shows us that this is not exactly the case. To illustrate this, we start by describing the right side of Figure 4 which shows the results for respondents with a weak to moderate NSA. Here, we see that TD has an effect on scores as evidenced by the spread of the intercepts. The more desirable the trait, the more respondents claimed to possess it (and vice versa). Curiously, for respondents with a weak NSA, longer responses are actually associated with more negative self-assessments.
3.5 4.0 4.5 5.0 5.5 6.0
−5 0
Response latency ([−]: faster than average)
Scores (1−7)
Trait desirability +2.0 +0.7 −0.7 −2.0 −4.0
Note. Created with ggplot2 package in R (Wickham 2009)
Now, if we compare this to the left side of Figure 4, the relevance of the result to the theoretical discussion above becomes clearer. As with Figure 3, we see a fairly pronounced effect of TD on scores for fast responses (see intercepts). How-ever, the slopes for the extreme TD values (solid line and dotted line) are steeper amongst those with a strong NSA. For the most desirable traits, faster responses are substantially more positive than slower ones. For undesirable traits, it is the slower responses that are more positive. To summarize, we can state that the answers of respondents with a low to moderate NSA are influenced by the TD of the item, and that their answers are more consistent regardless of how long they take to answer the question. In fact, if anything they actually tend to become more reserved the longer they take to answer. For respondents with a strong NSA, the negative effect of desirable traits and the positive effect of undesirable ones are almost equally strong.
Discussion and Conclusion
The findings generally lend support to our hypotheses. If we can accept response latencies as an appropriate proxy for the degree of elaboration (with automatic and deliberate modes at each end of the spectrum), then social desirability seems to be the result of both automatic and deliberate actions. The mode of response seems to be in part dependent on the desirability or undesirability of the item content.
NSA high NSA low to moderate
−5 0 −5 0
3.5 4.0 4.5 5.0 5.5 6.0
Response latency ([−]: faster than average)
Scores (1−7)
Trait desirability +2.0 +0.7 −0.7 −2.0 −4.0
Note. Created with ggplot2 package in R (Wickham 2009)
We take the results to indicate that respondents that answer quickly to desir-able traits may be answering in a SD way, irrespective of their NSA. For undesir-able traits, the longer the response, the more positive the self-reports become in the case of strong NSA. Thus, NSA seems have a strong moderating effect on the interaction between RL and TD. Taken together, we are left with the conclusion that both scenarios (automatic and deliberate) are as plausible now as when we started out. Our results suggest a strong need for social approval and a very desirable trait leads to more automatic SD answers as outlined by Esser’s argument. On the other hand, Stocké’s assertion that trait desirability and need for social approval lead to deliberate SD answers is supported if one looks only at the very undesirable traits. We suggest, therefore, that the content of the item may be an important factor that determines the mode of response. This has not been discussed by either Esser (1990, 1991a, 1991b) or Stocké (2004, 2007), but could be an overlooked factor that allows both views to exist simultaneously. In general, our results suggest it is unlikely that socially desirable responses are either simply fast or slow. However, at this point, the exact mechanism responsible for this observed relation can only be speculated on. More work is needed to investigate the interplay in greater detail and assess the generalizability of the results.
In fact, it could be that the results of this study are specific to our research/sur-vey design: tablet-based CASI surresearch/sur-veys of a relatively homogenous sample regard-ing a very specific, relatively low-cost topic. Other types of surveys (web-based, CATI, CAPI), samples and topics could yield different results. Also, the analytical framework does not make it possible to truly test whether, for example, trait desir-ability leads to fast/slow responses which has been taken for granted throughout this article. It is possible that the causal direction is actually the opposite: perhaps respondents that take their time with the survey tend to be more receptive to the TD of the item. Furthermore, our expectations in this study were strongly influenced by what we empirically observed in a previous study. While there is some research that supports the overall sentiment that respondents may react differently based on certain types of questions, we are still very much in the beginning stages of flesh-ing out our theoretical argument. More work is needed that brflesh-ings together not only the psychological work on egoistic/moralistic bias but also the methods such as response latencies to measure cognitive processing modes.
References
Allison, P. (2009). Fixed Effects Regression Models. Thousand Oaks: Sage Publications. Andersen, H., & Mayerl, J. (2017). Social Desirability and Undesirability Effects on Survey
Response Latencies. Bulletin of Sociological Methodology, 135(1), 68-89.
Baayen, R., Davidson, D., & Bates, D. (2008). Mixed-effects modeling with crossed random effects for subject and items. Journal of Memory and Language, 59, 390-412.
Bader, F., Bauer, J., Kroher, M., & Riordan, P. (2016). Privacy Concerns in Responses to Sensitive Questions. A Survey Experiment on the Influence of Numeric Codes on Unit Nonresponse, Item Nonresponse, and Misreporting. methods, data, analyses (mda), 10(1), 47-72.
Bassili, J. (2003). The minority slowness effect: Subtle inhibitions in the expression of views not shared by others. Journal of Personality and Social Psychology, 84(2), 261-276. Bassili, J., & Fletcher, J. (1991). Response-Time Measurement in Survey Research a Method
for CATI and a New Look at Nonattitudes. Public Opinion Quarterly, 55(3), 331-346. Bates, D., Mächler, M., Bolker, B., & Walker, S. (2015). Fitting linear mixed-effects model
using lme4. Journal of Statistics Software, 67(1), 1-48.
Booth-Kewley, S., Larson, G. E., & Miyoshi, D. K. (2007). Social desirability effects on computerized and paper-and-pencil questionnaires. Computers in Human Behavior, 23(2007), 463-477.
Börger, T. (2013). Keeping up appearances: Motivations for socially desirable responding in contingent valuation interviews. Ecological Economics, 87(2013), 155-165.
Carlston, D., & Skowronski, J. (1986). Trait Memory and Behavior Memory: The Effects of Alternative Pathways on Impression Judgment Response Times. Journal of Personality and Social Psychology, 50(1), 5-13.
Crowne, D., & Marlowe, D. (1960). A new scale of social desirability independent of psy-chopathology. Journal of Consulting Psychology, 24(4), 349-354.
Damarin, F., & Messick, S. (1965). Response Styles as Personality Variables: A Theoretical Integration of Multivariate Research. ETS Research Bulletin Series, 1(1965), i-116. DeMaio, T. (1984). Social Desirability and Survey Measurement: A Review. In: Turner, C.
& Martin, E. (Eds.), Surveying Subjective Phenomena, Vol. 2. New York: Russel Sage Foundation.
Dodou, D., & de Winter, J. C. F. (2014). Social desirability is the same in offline, online and paper surveys: A meta-analysis. Computers in Human Behavior, 36(2014), 487-495. Dwight, S., & Feigelson, M. (2000). A quantitative review of the effect of computerized
testing on the measurement of social desirability. Educational and Psychological Mea-surement, 60(3), 340–360.
Enders, C., & Tofighi, D. (2007). Centering Predictor Variables in Cross-Sectional Multile-vel Models: A New Look at an Old Issue. Psychological Methods, 12(2), 121-138. Esser, H. (1986). Können Befragte lügen? Zum Konzept des „wahren Wertes“ im Rahmen
der handlungstheoretischen Erklärung von Situationseinflüssen bei der Befragung. ZUMA-Arbeitsbericht 1986/02. Mannheim: Zentrum für Umfragen, Methoden und Analysen – ZUMA.
Esser, H. (1991). Die Erklärung systematischer Fehler in Interviews: Befragtenverhalten als “rational choice”. In: Wittenberg, R. (Ed.), Person – Situation – Institution – Kultur. Günter Büschges zum 65. Geburtstag. Berlin: Duncker & Humblot.
Esser, H. (2001). Soziologie. Spezielle Grundlagen: Sinn, und Kultur. Band 6. Frankfurt a.M.: Campus.
Esser, H. (2003). Der Sinn der Modelle: Antwort auf Götz Rohwer. Kölner Zeitschrift für Soziologie und Sozialpsychologie, 55, 395-368.
Fazio, R. (1990a). Multiple Processes by which Attitudes Guide Behavior: the MODE Model as an Integrative Framework. Advances in Experimental Social Psychology, 23, 75-109. Fazio, R. (1990b). A practical guide to the use of response latency in social psychological
research. In: Hendrick, C., & Clark, M. S. (Eds.), Review of Personality and Social Psychology. Vol. 11. Research Methods in Personality and Social Psychology. Newbu-ry Park: Sage Publications.
Festinger, L. (1957). A Theory of Cognitive Dissonance. Stanford: Stanford University Press.
Gibbons, H., & Rammsayer, T. (1999). Auswirkung der Vertrautheit mit einer Reizdimensi-on auf Entscheidungsprozesse: Der modulierende Einfluss kReizdimensi-ontrollierter vs. automati-scher Informationsverarbeitung. In Wachsmuth & Jung (Eds.), KogWis99, Proceedings der 4. Fachtagung der Gesellschaft für Kognitionswissenschaft. Bielefeld/ St. Augus-tin.
Hancock, D., & Flowers, C. (2001). Comparing social desirability responding on world wide web and paper-administered surveys. Educational Technology Research and Develop-ment, 49(1), 5–13.
Holtgraves, T. (2004). Social Desirability and Self-Reports: Testing Models of Socially Desirable Responding. Personality and Social Psychology Bulletin, 30(2), 161-172. Hox, J. J., Moerbeek, M., & van de Schoot, R. (2018). Multilevel Analysis. Techniques and
Applications. Third Edition. New York: Routledge.
Joinson, A. (1999). Social desirability, anonymity, and internet-based questionnaires. Beha-vior Research Methods,Instruments and Computers, 31(3), 433-438.
Kays, K., Gathercoal, K., & Buhrow, W. (2012). Does survey format influence self-disclosu-re on sensitive question items? Computers in Human Behavior, 28, 251-256.
Kreuter, F., Presser, S., & Tourangeau, R. (2008). Social desirability bias in cati, ivr, and web surveys. Public Opinion Quarterly, 72(5), 847-865.
Kroneberg, C. (2005). Die Definition der Situation und die variable Rationalität der Akteu-re. Ein allgemeines Modell des Handelns. Zeitschrift für Soziologie, 34(5), 344-363. Kroneberg, C., Yaish, M., & Stocké, V. (2010). Norms and Rationality in Electoral
Parti-cipation and in the Rescue of Jews in WWII: An Application of the Model of Frame Selection. Rationality and Society, 22(1), 3-36.
Kroneberg, Clemens (2006). The Definition of the Situation and Variable Rationality: The Model of Frame Selection as a General Theory of Action. Sonderforschungsbereich 504. Rationalitätskonzepte, Entscheidungsverhalten und ökonomische Modellierung, 06-05.
Krumpal, I. (2013). Determinants of social desirability bias in sensitive surveys: a literature review. Quality and Quantity, 47, 2025-2047.
Krysan, M., Schuman, H., Scott, L.J., & Beatty, P. (1994). Response rates and response con-tent in mail versus face-to-face surveys. Public Opinion Quarterly, 58, 381-399. Lüdecke, D. (2017). sjplot: Data visualization for statistics in social science [Compute
soft-ware manual]. Retrieved from https://CRAN.R-project.org/package=sjPlot.
Mayerl, J. (2009). Kognitive Grundlagen sozialen Verhaltens. Framing, Einstellungen und Rationalität. Wiesbaden: VS Verlag für Sozialwissenschaften.
Mayerl, J. (2010). Die Low-Cost-Hypothese ist nicht genug. Zeitschrift für Soziologie, 39(1), 38-59.
Mayerl, J., & Urban, D. (2008). Antwortreaktionszeiten in Survey-Analysen. Messung, Aus-wertung und Anwendungen. Wiesbaden: VS Verlag.
Northover, S., Pedersen, W., Cohen, A., & Andrews, P. (2017). Artificial surveillance cues do not increase generosity: Two meta-analyses. Computers in Human Behavior, 38, 144-153.
Paulhus, D. (1984). Two-component models of socially desirable responding. Journal of Personality and Social Psychology, 46, 598-609.
Paulhus, D. (2002). Socially Desirable Responding: The Evolution of a Construct. In: Braun, H., Jackson, D., & Wiley, D. (Eds.), The role of constructs in psychological and educa-tional measurement. Mahwah: Erlbaum.
Paulhus, D. L. (1984). Two-component models of socially desirable responding. Journal of Personality and Social Psychology, 46, 598-609.
Paulhus, D. L., & Reid, D. B. (1991). Enhancement and Denial in Socially Desirable Res-ponding. Journal of Personality and Social Psychology, 60(2), 307-317.
Richman, W., Kiesler, S., Weisband, S., & Drasgow, F. (1999). A metaanalytic study of so-cial desirability distortion in computer-administered questionnaires, traditional questi-onnaires and interviews. Journal of Applied Psychology, 84(5), 754–775.
Rüttenauer, T. (2018). Neighbors matter: A nation-wide small-area assessment of environ-mental inequality in Germany. Social Science Research, 70, 198-211.
Schaffner, B., & Roche, C. (2016). Misinformation and Motivated Reasoning Responses to Economic News in a Politicized Environment. Public Opinion Quarterly, 81(1), 86-110. Sheppard, L., & Teasdale, J. (2000). Dysfunctional thinking in major depressive disorder: A deficit in metacognitive monitoring? Journal of Abnormal Psychology, 109(4), 768-776. Shiv, B., & Fedorikhin, A. (2002). Spontaneous versus controlled influences of stimulus-based affect on choice behavior. Organizational Behavior and Human Decision Pro-cesses, 87(2), 342-370.
Skarbek-Kozietulska, A., Preisendörfer, P., & Wolter, F. (2012). Leugnen oder Gestehen? Bestimmungsfaktoren wahrer Antworten in Befragungen. Zeitschrift für Soziologie, 41(1), 5-23.
Stocké, V. (2004). Entstehungsbedingungen von Antwortverzerrungen durch soziale Er-wünschtheit. Ein Vergleich der Prognosen der Rational-Choice Theorie und des Mo-dells der Frame-Selektion. Zeitschrift für Soziologie, 33(4), 303-320.
Stocké, V. (2007). The Interdependence of Determinants for the Strength and Direction of Social Desirability Bias in Racial Attitude Surveys. Journal of Official Statistics, 23(4), 493-514.
Stocké, V., & Hunkler, C. (2007). Measures of Desirability Beliefs and Their Validity as Indicators for Socially Desirable Responding. Field Methods, 19(3), 313-336.
Uziel, L. (2010). Rethinking Social Desirability Scales: From Impression Management to Interpersonally Oriented Self-Control. Perspectives on Psychological Science, 5(3), 243-262.
Weisband, S., & Kiesler, S. (1996). Self disclosure on computer forms: Meta-analysis and implications. Proceedings of the SIGHI Conference on Human Factors in Computer Systems, 3–10.
Wickham, H. (2009). ggplot2: Elegant graphics for data analysis. New York: Springer-Verlag.
Wiggens, J. (1964). Convergences among stylistic response measures from objective perso-nality tests. Educational and Psychological Measurement, 24, 551-562.
Wolter, F. (2012). Heikle Fragen in Interviews. Eine Validierung der Randomized Response-Technik. Wiesbaden: Springer VS.
Wolter, F., & Junkermann, J. (2018). Antwortvalidität in Survey-Interviews: Meinungsäuße-rungen zu fiktiven Dingen. In Wolbring, T., & Menold, N. (Eds.) (forthcoming), Qua-litätssicherung sozialwissenschaftlicher Erhebungsinstrumente (ASI-Schriftenreihe). Wiesbaden: Springer VS.
Appendix
Appendix 1 Descriptive Statistics
mean sd min max n missing
Event-level variables
Item scores 4.60 1.54 1.00 7.00 9720 0
Response latency 4.65 2.00 1.88 11.86 8769 951
Respondent-level variables
Repeat respondent .39 .49 .00 1.00 9720 0
Need for social approval 5.78 .83 3.00 7.00 7306 2414
Acquiescence .11 .10 .00 .63 9660 60
Sex (male) .29 .45 0.00 1.00 9660 60
Year of birth 1987.42 2.49 1979.00 1991.00 9660 60
Item-level variables
Syllables 17.26 4.72 7.00 29.00 9720 0
Trait desirability .75 1.92 -2.77 2.83 9720 0
Note. Original metrics before centering; constant of 1,900 subtracted from Year of birth
Appendix 2 Descriptive Statistics of Need for Social
Approval Items
mean sd min max n missing reliability No matter who I’m talking to,
I’m always a good listener. 5.75 0.95 2.00 7.00 242 389
.65 I am always courteous, even to
people who are disagreeable. 5.83 1.08 2.00 7.00 242 389
Appendix 3 Mean Trait Desirability Score Per Item and
Standard Deviation (sd)
Item mean sd
Interaction with younger people (Teenagers)
1 Spending time with teenagers is a lot of fun. 2.82 1.10
2 [-] Teenagers tend to annoy me quickly. -2.77 1.40
3 I always get along with teenagers. 2.38 1.35
Humour
4 I find it easy to make others laugh. 1.29 1.57
5 My friends and acquaintances appreciate my friendly disposition. 1.74 1.59 6 [-] I sometimes have trouble being funny at the right moment. -.81 1.40
Tolerance for frustration (Frustration)
7 I take being insulted well. 1.64 1.67
8 [-] I am very sensitive to personal accusations and attacks. -2.01 1.50 9 I can cope with disappointment better than many other people. .74 1.82
Ability to assert oneself (Conflict)
10 I am able to stick by my opinions in conflicts. 1.73 1.42 11 [-] When I am challenged I sometimes find it difficult to argue my point
convincingly. -1.70 1.73
12 I am good at winning arguments. 1.69 1.41
Flexibility
13 I deal well with unforeseen situations. 2.08 1.49
14 [-] I need things to go as planned. -.91 1.61
15 I can adapt myself to new situations without any problems. 1.90 1.18
Social sensibility (Empathy)
16 [-] I find it difficult to put myself in someone else’s shoes. -2.32 1.82 17 I have good feeling for how to deal with people. 2.55 1.32 18 I am aware of problems other people may be having. 2.22 1.12
Didactic abilities (Didactics)
19 I am good at explaining complex situations. 2.82 1.33 20 [-] Sometimes I am not able to communicate complex topics so that other
people are able to understand. -1.91 2.09
21 I find it easy to teach others. 2.83 1.31
Comfort speaking in front of others (Manner)
22 I don’t mind talking in front of a group unprepared. 1.60 2.02 23 When I have to speak or present in front of a group, I am able to
over-come my nervousness. 2.17 1.27
Item mean sd
Ability to express oneself (Expression)
25 [-] My ability to express myself in discussions is sometimes limited. -1.66 1.77 26 I am able to express complicated things clearly and concisely. 2.09 1.36 27 I can adjust the way I express myself depending on who I am talking to. 1.94 1.30
Ability to awake interest (Enthusiasm)
28 I am good at getting people excited about things. 2.45 1.29 29 [-] I find it difficult to convince others of things. -1.94 1.50 30 I am good at getting people interested in things. 2.34 1.40