273
STUDY ABOUT THE LEAD TRANSFER FROM
SEWAGE SLUDGE INTO AGROECOSYSTEMS
TRAŞCĂ FLORIAN1
,IONESCU NICOLAIE1, MINCĂ GINA1
1Staţiunea de Cercetare Dezvoltare Agricolă Piteşti, şos. Piteşti- Slatina, km. 5
e-mail: [email protected]
Keywords: processed sludge, luvic soil, Pb, maize, winter wheat, soybeans
ABSTRACT
In order to study the evolution of Pb contents both in soil and plants, progressive sludge doses were spread: 0 t.ha-1, 5 t.ha-1, 10 t.ha-1, 25 t.ha-1 and 50 t.ha-1 together with the chemical fertilizers (NP type) in levels 0, ½ and 1/1 from doses indicated for: maize, winter wheat and soybeans. The three plants absorbed Pb2+ ions or not, in quantities considered unnecessary. Thus, the maize and soybean didn’t absorbed Pb , wheat second year containing in leaves 4-6 mg.kg-1 and in fourth year around 5 mg.kg-1d.w. Pb was deposited only in wheat grains (year 2), between 3 and 2 mg.kg-1, in a negative correlation with grain yields. The sewage sludge seems to be un organic fertilizer with an-dangerous concentrations of this heavy metal, the lead (Pb), for agricultural medium.
INTRODUCTION
Like other heavy metals, lead (Pb) is part of nature, including soil culture (Abreu et al, 2005). Its source is specific minerals with different concentrations. The sulphate group are: anglezite- PbSO4 and linarite- PbCuSO4(OH)2, the sulfides: bournonite- PbCuSbS3 and meneghinite- Pb13CuSb7S24, of phosphate-arsenate-vanadates: mimetite- Pb5(AsO)3Cl ans piromorphite- Pb5(SO4)3Cl, and of carbonates: ceruzite- PbCO3. The average crust content of lead is 16 mg.kg-1 d.w. (Suavre et al, 1998). Concentrations more obvious are in the presence of organic matter (OM) and the colloids. For this reason, in addition to any OM (Tipping, 2002; McBride, 2003), there is a binding such that the migration of lead is poor. As well as for other heavy metals, between the total and the mobile forms of Pb is a dynamic equilibrium. In the soil solution (SSol) Pb2+ ions are assigned to plant, depending on several factors. Of these, the most important are: redox potential, pH values, the climate and level of fertilization (Giusquiani et al, 1992). Luvosol with the acid medium increases the absorption of Pb. From recent research found that crops can accumulate on average below 100 mg.kg-1 d.w. Pb, and the conditions of pollution, up to 400 mg.kg-1 d.w. Pb (Hayes & Traina, 1998). Plants that have high concentrations of Pb absorbed no visible symptoms of contamination (Mendoza et al, 2006; Kidd et al, 2007). Between plant organs most Pb is in the roots and less in other parts (Silva et al, 2006). By entering Pb in plants may be a decrease in the ability of photosynthesis and plants have o lower rate of growing. Concentrations of Pb in plants is easily spread through the food chain later: the animal and, of course, the human (Mureşan, 2011). By using sludge, rich in Pb, may have an increased heavy metal concentrations in the agricultural environment. The sludge used in this experiment had an average content of Pb in the range of 80 to 90 mg.kg-1 d.w., to a maximum of 300 mg.kg-1 d.w. admitted to the EU. Under these conditions the crop absorbed in a specific way Pb concentrations. To reduce soil Pb can use new chemical immobilization techniques (Xu et al, 2007; Zhang et al, 2010). In terms of research is important how the heavy metal have had its behaviour when using increasing doses of sludge rich in Pb.
274
To highlight the transfer of lead in the agricultural eco-systems, set up an agricultural experiment with stationary character. It included 4-year rotation with doses of sludge and chemical fertilizers. Plants were grown as maize, wheat and soybeans, with doses of sludge: 0,5,10,25 and 50 t.ha-1 and NP fertilizers such doses: 0, half of the dose and normal doses- for station conditions. Sewage sludge was applied to maize in the first year, and to confirm its purpose were once applied doses of sludge to wheat in the second year, and soybeans and wheat in the past year to benefit from the residual effect of sludge. The experimental variants were surface of 100 m2 in three replications. The experimental design was to two factors with divided plot, of the combination of 5 sludge doses and 3 chemical doses, a total of 15 doses of the complex. The chemical analysis were performed as follows: Pb in sludge with SR ISO 11047-99, soil Pb total forms, leaves and grains Pb total forms by SAAF, and Pb mobile forms by Na2EDTA solution. Soil samples were collected with the agrochemical devise from the arable horizon (0-20 cm) in the period between flowering and maturity of plants. Plant samples were collected in two stages: leaves at flowering periods and grains of maturity stages. Data processing was performed using analysis of variance, Anova test and Excel program to obtain correlations and regressions. By introducing sludge into agroecosystems held a specific transfer of heavy metal, lead (Table 1).
Table 1
The lead (Pb) contents from soil (mg.kg-1 d.w.) total forms (PbTF)
Heavy metal Maize Wheat, 2 Soybean Wheat, 4 Toxic limits Pb, limits
Pb, media
13 – 24 17
12 – 22 17
10 – 21 17
14 – 35 27
50EU.2010 50344 50EU.2010- new EU limit; 50344- Ord. 344
RESULTS OBTAINED AND DISCUSSIONS The evolution of lead concentrations in maize eco-system
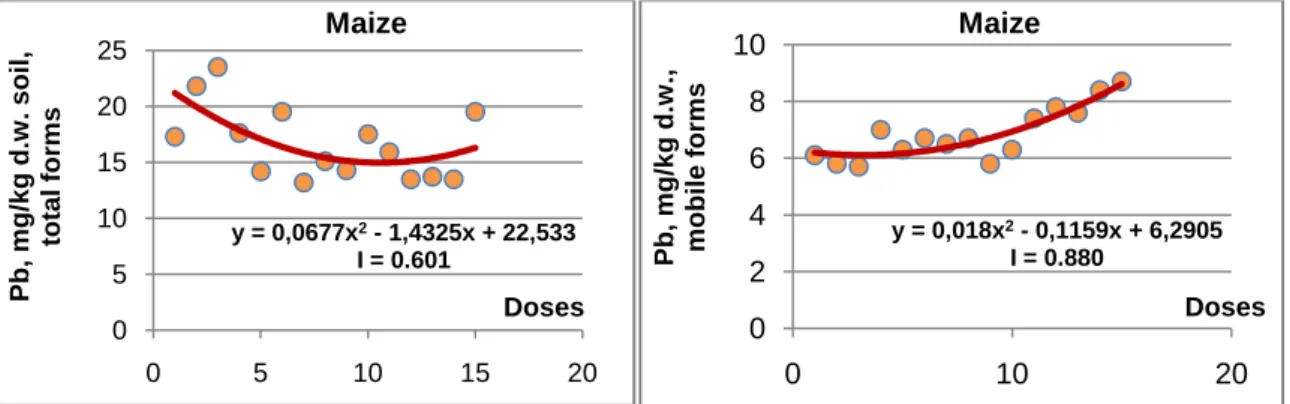
With the application of sewage sludge doses, there was an admixture quantity in the heavy metal, lead (Pb). Being considered an organic fertilizer, this material causes an increase in the lead content. Chemical analyses in maize demonstrated specific situations (Figure 1). Total forms of Pb in soil following a fall, betwwen 20 and 15 mg.kg-1 d.w. Mobile forms of Pb were enrolled in an obvious trend of increasing specific combinations of organic- mineral fertilizers applied. In absolute values, the function looks Pb concentrations between 6 and 8 mg.kg-1 d.w. soil. Chemical analysis show the full contribution of the new system of fertilization by transfer of Pb and increasing mobile forms. From the current background of soil, Pb has not been detected, or the leaves, or the seeds of maize.
Fig. 1. Lead concentrations evolution from soil- total and mobile forms, by sludge & chemical fertilizers doses from maize eco-system
The evolution of lead concentrations in wheat eco-system(2)
y = 0,0677x2- 1,4325x + 22,533
I = 0.601
0 5 10 15 20 25
0 5 10 15 20
Pb,
m
g/
k
g
d.
w
.
s
oi
l,
tot
a
l
form
s
Doses
Maize
y = 0,018x2- 0,1159x + 6,2905
I = 0.880
0 2 4 6 8 10
0 10 20
Pb,
m
g/
k
g
d.
w
.,
m
ob
il
e
form
s
Doses
275
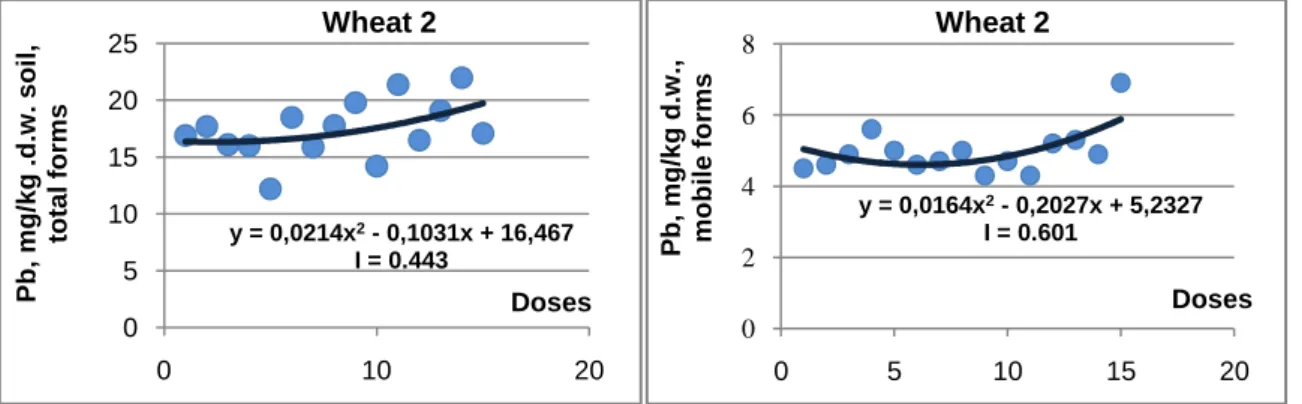
Winter wheat sophomore received a new dose of processed sludge fertilization, which meant a supplimentary increase of this heavy metal, Pb. Analysis of total and mobile ground Pb forms have shown that a further improvement of the crop, the values obtained by joining between 15 and 20 mg.kg-1 d.w. soil for PbTF, and 4-6 mg.kg-1 d.w. for PbMF (Figure 2). Having the supplies of mobile Pb wheat plants have absorbed by specific physiology. Thus, the upper leaves of flourished wheat increased (due to the doses studied) lead and namely from 1 mg.kg-1 d.w. in unfertilized, and 3.5 mg.kg-1 in higher doses (Figure 3).
Fig. 2. Lead concentrations evolution from soil- total and mobile forms, by sludge & chemical fertilizers doses from wheat(2) eco-system
In the final stage of maturity wheat grains contained Pb between 3 and 2 mg.kg-1 d.w., the relationship is reversed.
Fig. 3. Corelations between total biomass and grain yields with Pb concentrations, total forms from leaves and grains, of winter wheat(year 2)
Development of lead concentrations in soybean eco-system
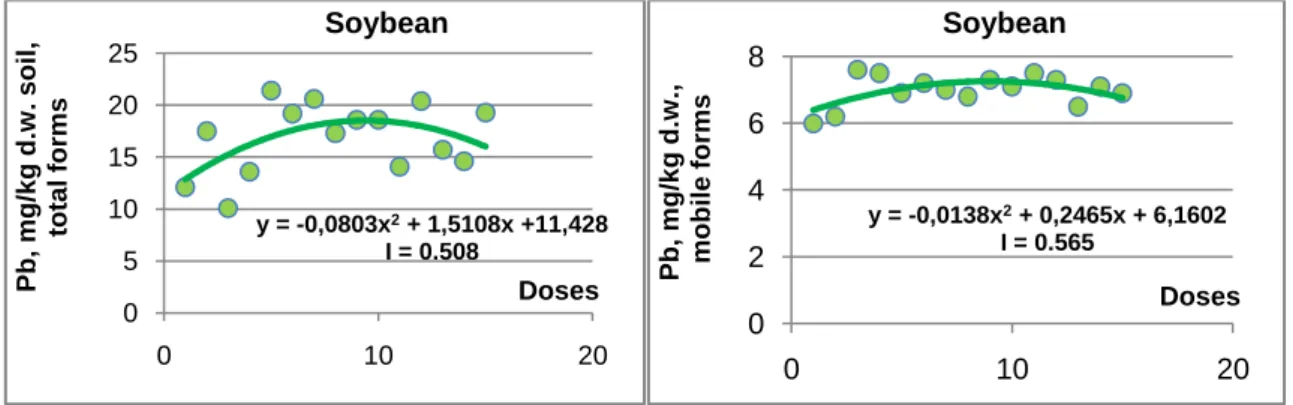
Soybeans in the third year of culture express different relative concentrations of lead, the advantage of the first year of the effect of remaining sludge doses. Total forms of Pb have increased between 10 and 20 mg.kg-1 d.w., and the mobile ones increased between 6 and 7 mg.kg-1 d.w., both trends cap ( according to the regression function). These concentrations show that for soybean soil contained sufficient amounts of Pb (Figure 4). The soybean plants were not detectable levels of lead.
Development of lead concentrations in wheat eco-system(4)
In the second year of residual effect of sewage sludge doses (and fourth year of cultivation in the same place), it was expected that the soil Pb express slightly lower values. The analyses showed specific circumstances in this case, given that the fund climate was characterized as dry (Figure 5). However, PbTF concentrations were
y = 0,0214x2- 0,1031x + 16,467
I = 0.443
0 5 10 15 20 25
0 10 20
Pb,
m
g/
k
g
.d
.w
.
s
oi
l,
tot
a
l
form
s
Doses
Wheat 2
y = 0,0164x2- 0,2027x + 5,2327
I = 0.601
0 2 4 6 8
0 5 10 15 20
Pb,
m
g/
k
g
d.
w
.,
m
ob
il
e
form
s
Doses
Wheat 2
y = -0,0001x2+ 0,07x + 1,1623
I = 0.323
0 1 2 3 4
0 10 20 30
Pb,
m
g/
k
g
d.
w
.
from
le
av
es
Total biomass, t/ha
Wheat 2 y = 0,0482x2- 0,6177x + 4,2325
I = 0.207
0 2 4 6 8
0 5 10
Pb,
m
g/
k
g
d.
w
.
from
gra
in
s
Grain yields, t/ha
276
consecutively in a range between 20 to 32 mg.kg-1 d.w. PbMF increased noticeably between 7 and 8 mg.kg-1 d.w.
By analyzing the leaves from flowering period, were determined positive concentrations of Pb, in particular about 6 mg.kg-1 d.w. (Figure 6).
Fig. 4. Lead concentrations evolution from soil- total and mobile forms, by sludge & chemical fertilizers doses from soybean eco-system
Fig. 5. Lead concentrations evolution from soil- total and mobile forms, by sludge & chemical fertilizers doses from wheat(4) eco-system
Agrochemical indices that limit the Pb transfer in the agricultural environment
Pb in sludge and soil culture should be as less, for the environmental protection (Tiller, 1989). Recently it have developed some indicators of limiting concentrations of Pb in two areas: sludge and soil (Table 2).
Fig. 6. Corelation between total biomass and Pb concentrations, Total forms from leaves, of winter wheat(year 4)
y = -0,0803x2+ 1,5108x +11,428
I = 0.508
0 5 10 15 20 25
0 10 20
Pb, m g/ k g d. w . s oi l, tot a l form s Doses Soybean
y = -0,0138x2+ 0,2465x + 6,1602
I = 0.565
0 2 4 6 8
0 10 20
Pb, mg/ kg d.w ., m ob il e form s Doses Soybean
y = -0,0061x2+ 0,9111x+20,409
I = 0.577
0 10 20 30 40
0 10 20
Pb, m g/ k g d. w . s oi l, tot a l form s Doses Wheat 4
y = 0,0084x2- 0,0049x + 6,8459
I = 0.545
0 2 4 6 8 10 12
0 10 20
Pb, m g/ k g d. w ., m ob il e form s Doses Wheat 4
y = -0,0032x2+ 0,1921x + 4,4431
I = 0.137
0 2 4 6 8 10
0 10 20
Pb, mg/ kg d.w . from le a v e s
Total biomass, t/ha
277
Soil must not contain more than 24 mg.kg-1 d.w. PbTF. Waste sludge must not contain more than 1084 mg.kg-1 d.w. Pb, and annual dose of application of sludge will not exceed 14 t.ha-1.
Table 2 Pb indices – mg.kg-1
d.w., recommended when sludge is applied in field crops (after Pusztai, 1988 quoted by Borlan, 1994)
Indices Calculation
Tolerable level considered, TLC Maxim tolerable intake, MTI Annual allowable norm, AAN
TLCPb ≤ 75.CEC/35 ≤ 24 mg.kg -1
d.w. MTIPb ≤ 3400.CEC/35 ≤ 1084 mg.kg-1 d.w.
AANPb = 3400.CEC/35.Pb** = 14 t.ha -1
.year-1
CEC, cationic exchange capacity (11,16 me/100 g s.u. sol) **Pb from sludge, 80 mg mg.kg-1 d.w.
CONCLUSIONS
Sewage sludge will be used in the agricultural field only if Pb concentrations will not exceed 300 mg.kg-1 d.w. The organic material used in the experiment contained between 80 and 90 mg.kg-1 d.w.
Total forms of Pb in the soil performed between 20 and 15 mg.kg-1 d.w. for maize, 16-20 mg.kg-1 d.w. for wheat(2), 12-18 mg.kg-1 d.w. for soybean and 20-32 mg.kg-1 d.w. for wheat last year (4).
Mobile forms of Pb ranged between 6-8 mg.kg-1 d.w. for maize, 4-6 mg.kg-1 d.w. for wheat (2), 6-7 mg.kg-1 d.w. for soybean and 7-8 mg.kg-1 d.w. for wheat(4). Luvosoil acidic environment favored of mobile forms of Pb by increasing doses of sludge.
Maize and soybean plants did not contain Pb, or the leaves of the flowering period, or in the mature grains. Winter wheat has absorbed Pb. Wheat(2) leaves at flowering contained between 1 and 3 mg.kg-1 d.w. Pb, and wheat(4) between 2 and 9 mg.kg-1 d.w. Grains of wheat(2) contained Pb between 3 and 2 mg.kg-1 d.w.
Agrochemical, soil should not exceed 24 mg.kg-1 d.w. PbTF, sludge can contain the maximum 1084 mg.kg-1 d.w. Pb, and annual dose of sludge that may be applied to the agricultural field to be 14 t.ha-1.
REFERENCES
Abreu C.A., deRaji B., VanAbreu M.F., Gonzales A.P., 2005 -Routine soil testing
to monitor heavy metals and boron. Science in Agriculture, 62, 564- 571.
Giusquiani P.L., Gigliotti G., Businelli D., 1992 -Mobility of heavy metals in urban
waste-amended soils. Journal of Environmental Quality, 21, p. 330- 335.
Hayes K.F. & Traina S.J., 1998 -Metal ion speciation and its significance in
ecosystem health. Soil Chemistry and Ecosystems Health. Madison, Soil Scientific Society
opf America (SSSA), p. 45- 84.
Kidd P.S., Dominquez- Rodriguez M.J., Diez J., Monterroso C., 2007
-Bioavailability and plant accumulation of heavy metals and phosphorus in agricultural soils
amended by long-term application of sewage sludge. Chemosphere, 66, p. 1458- 1467.
Mantovi P., Baldoni G., Toderi G., 2005 -Reuse of liquid, dewatered, and composted sewage sludge on agricultural land: effects of long- term application on soil and
crop. Water research, 39, p. 289- 296.
McBride M.B., 2003 -Toxic metals in sewage sludge- amended soils: has
promotion of beneficial use discounted the risk. Advanced in Environmental Research, 8,
p. 5-19.
Mendoza J., Garrido T., Castillo G., San Martin N., 2006 -Metal availability and uptake by sorghum plants grown in soils amended with sludge from different treatments.
278
Mureşan I.A., 2011 -Contaminanţi chimici de tip metale grele în carne, lapte,
preparate de carne şi produse lactate. Teză de Doctorat, USAMV Cluj- Napoca.
Sauve S., Dumestre A., Mebride M., Hendershot W., 1998 -Derivation of soil quality criteria using predicted chemical speciation of Pb2+ and Cu2+. Environmental Toxicology and Chemistry, 17, p. 1481- 1489.
Shaw A.J., 1989 -Heavy metal tolerance in plants: evolutionary aspects. Boca Raton, USA: CRC.
Silva C.A., Rangel O.J.P., Dynia J.F., Bettiol W., Manzatto C.V., 2006 -Heavy metals availability for corn cultivated in a latosol sucessively amended with sewage
sludges. Revista Brasilieira de Ciencia do Solo, 30(2), p. 353- 364.
Tiller, K.G., 1989 -Heavy metal pollution of soils. Advanced in Soil Science, 9, p. 113- 141.
Tipping E., 2002 -Cation binding by humic substances. Cambridge: University Press.
Xu H., Yang L., Wang P., Liu Y., Peng M., 2007 -Removal Mechanism of Aqueous
Lead by a Novel Eco-material: carbonate Hydroxyapatite. Journal of material and Scientific
Technology, 23(3).
Zhang Z., Li M., Chen W., Zhu S., Liu N., Zhu L., 2010 -Immobilization of lead and
cadmium from aqueous solution and contaminated sediment using nano-hydroxyapatite.