Iowa Workforce Development Board Members
Business Members
Dean Hicks – West Des Moines Norma Schmoker – Fort Dodge Sally Falb – West Union
Denise Baldwin – Denison
Employee Representatives Ernie Nelson – Fort Madison Pat Marshall - Cedar Rapids Ken Sagar – Des Moines Ben Duehr – Dubuque Dan Purcell – Algona*
Non-Profit Workforce Development Organization Representative John Watson – Iowa City
Ex-Officio Non-Voting Representatives Dr. Tahira K. Hira – Regents Institutions Jan Varner – AFSCME
Steve Ovel – Community Colleges
Dr. Phillip Langerman – Private Colleges and Universities Senator Betty Soukup – State Legislature
Senator Neal Schuerer – State Legislature
Representative Willard Jenkins – State Legislature Representative Bill Dotzler – State Legislature Jane Schildroth – Regents Institutions*
Executive Summary
As might be expected, the second year of operation of the Workforce Investment Act (WIA) in the State of Iowa is best characterized by the word “growth.” The WIA constituencies continue to fashion the partnership that the statute envisions, and continue to establish the services for workers that the program dollars support. After an initial year of operation that focused on understanding the new law and implementing new processes and procedures, the sixteen Regional boards and State administrators now oversee a program that contributes greatly to the economic health and prosperity of Iowa. The following pages provide the detail of the activities of the WIA program in Iowa during Program Year 01 (July 1, 2001 to June 30, 2002). However, by way of summary, the growth of the program can be described in terms of achievement in four key areas: Operations, Performance, Partnership, and Services.
1. Growth in Operations—Nationally, and in Iowa, the first full year of WIA was marked by criticism of low expenditure and enrollment rates.
However, in PY 01, participant enrollments in the State increased significantly. Adult enrollments were up 22%; Dislocated Worker
numbers increased by 53%, OlderYouth enrollments were up by 51%, and Younger Youth numbers increased by 75%. Over nine million dollars were spent on behalf of these participants.
2. Growth in Performance—Familiarity with the WIA program focus and its accountability measures also led to a significant increase in performance achievement in PY 01. The State met sixteen of the seventeen
performance measures at federally required levels. At the Regional level, over 90% of measures were attained, with four regions achieving all of their performance standards.
3. Growth in Partnership—In PY 01, the philosophy of collaboration gave way to the reality and success of partnerships as One-Stop centers expanded their services and pulled together in response to job growth or job losses in their communities. Shared service and co-enrollment of participants created win-win opportunities for both program operators and job seekers.
4. Growth in Services—From the growth in partnership, Iowa found a need to grow in services. New initiatives were developed and implemented, especially to serve populations who are under-represented in our labor force, and to serve a growing number of dislocated workers during the economic downturn. The result was New Iowan Centers, an Iowa Advantage program, grants to serve individuals with disabilities, and major increases in funding from National Emergency Grants.
An old adage states “There’s always room to grow.” That fact has been demonstrated in the Iowa WIA programs in PY 01, and will continue to be a foundation of our successful programs in the future.
WORKFORCE INVESTMENT ACT ANNUAL REPORT PROGRAM YEAR 2001
July 1, 2001 to June 30, 2002
The Economic Environment
The activities covered by this report occurred in the context of a national and international recession. The first perceptible sign of a weakness in the Iowa economy came with a steady trickle of layoffs that began in late 2000, and the economy continued to weaken throughout 2001. Ultimately, a decrease of 9,300 manufacturing jobs reverberated throughout the state’s economy, and Iowa, like most other states, needed to take drastic action to respond to state revenue shortfalls.
Even during this difficult period, however, there were bright spots in Iowa’s economy. While pockets of high unemployment were experienced in some regions of the State, Iowa’s average unemployment rate remained at a low 3.3% in 2001, well below the average for the United States, and much lower than the rates experienced in previous recessions. At the same time, the highest number of workers in the labor force in the entire history of the state, 1,543,300, were employed in December 2001. During the same period, Iowa’s average annual wage grew at 3.3%, compared to a 2.5% U.S. average, breaking a twenty year trend in which the gap between Iowa’s and the nation’s wages had been
widening. All of these factors indicated a sustained demand for workers despite the recession.
But on a much broader scale than over a single year, and projecting for the future, the Iowa economy faces a significant challenge. As the results of the decennial U.S. Census are released, Iowa is seeing confirmation of other trends that have been of concern for some time. It is clear that our potential for economic growth is increasingly constrained by serious worker shortages, particularly in those industries and occupations that demand high skills, earn high income, and do the most to grow our economy. Out-migration during the devastating recession of the 1980s and slow population growth since,
compounded by an aging citizenry and slow birth rates, all contribute to these shortages. For most of the post-World War II era, a rapidly growing population and workforce made the demand side of the labor market equation the
compelling force. Now, and for decades to come, labor force supply issues will be at least as important to our prosperity.
Goals
Given this economic environment, the two broad goals Iowa’s Workforce Development Investment Board established in its original strategic plan in 1997 continue to be critically relevant. These goals are:
1. Increase the size of the skilled workforce, and 2. Increase Iowans’ earned income
The economic and demographic forces evident since their establishment have proven these goals to be precisely on target, and they continue to provide critical guidance to our workforce development system as we allocate resources and gauge our effectiveness.
Coordination and Planning
In 2001, Iowa enacted the Accountable Government Act (AGA) with an overwhelming display of bi-partisan support. The AGA seeks to assure the comprehensive application of sound planning, performance measurement, and other good management practices throughout State government. Iowa Workforce Development (IWD) works together in a team with other State agencies to craft enterprise-level plans. Since IWD is the lead agency for Iowa’s One-Stop Career Center system, great care is exercised to align the Workforce Development Board’s plan with those of the agency and the rest of the executive branch. In this way, the resources of many organizations are joined to achieve Iowa’s workforce development goals.
In particular, Iowa’s workforce development and economic development efforts are coordinated to reinforce each other. Iowa, like many other states, is pursuing industry cluster strategies to foster the growth of good jobs and higher wages. The workforce development system is an active partner in this endeavor, using labor market information and staff knowledge to help identify geographic and economic industry concentrations and related supplies/customer chains. Coupled with growth projections and information about wage rates, research facilities, and other factors, this information helps state and local economic developers to target their limited resources. This analysis will also identify associated occupations to help both individuals and training entities make better decisions.
IWD conducts an annual agency planning process that includes One-Stop partners. A series of planning retreats annually reviews the agency’s vision, mission, guiding principles, internal and external assessment, and goals and strategies. As part of the internal assessment, regional workforce investment board plans are reviewed. IWD has just completed its second “Iowa Excellence” (Baldridge) assessment, which also informs the planning process.
Special Initiatives
The planning processes described above have lead to a number of initiatives to help resolve Iowa’s critical labor and skill shortages. Especially prevalent among these efforts are several projects that focus on bringing more individuals into our labor force, especially from populations that are currently under-represented there. These projects include:
• A state-funded New Employment Opportunities Fund that establishes pilot sites to test creative approaches for bringing hard-to-serve groups into the active labor force. Projects have been initiated that serve individuals with disabilities, ex-offenders, minority youth, and non-English speaking populations.
• IWD established New Iowans Centers in several one-stop sites to ease the transition of immigrants into Iowa’s economy.
• The workforce development system supported youth development as a partner in the federally funded school-to-work initiative, and continues to work closely with the educators to infuse career development and work-based learning into Iowa’s school improvement initiatives.
• The workforce development system continues to operate the work and training portions of Iowa’s TANF welfare program, and those services and participants have been tightly integrated into the one-stop workforce system.
System Evaluation
One of the areas of opportunity identified in the feedback from our first “Iowa Excellence” (Baldridge) assessment was to strengthen our capacity building processes for our One-Stop partners and suppliers. An improvement plan was developed to provide regular communications and training opportunities to the One-Stop system. The following action steps were implemented as part of the improvement plan:
• Quarterly meetings are held with all partners through video conferencing capabilities of the Iowa Communications Network;
• Monthly conference calls and joint meetings are held with WIA and IWD (Wagner-Peyser) regional managers and administrators;
• Program training has been provided on State and regional basis; • The first Annual Statewide Conference was held by the Association of
Iowa Workforce Professionals;
• Program Task Forces addressed specific concerns, such as developing new services to dislocated workers and expanding life skills training for
welfare recipients;
• Special grants for system change, such as the Work Incentive Grant for individuals with disabilities, were sought and received.
The WIA Partnership in Iowa
The partnership of the employment and training system in Iowa continues to grow through the efforts of IWD and the oversight of the State Workforce Development Board. While it would be inaccurate to state that the full partnership envisioned by the WIA legislation has been achieved, it can be clearly demonstrated that the improved coordination of services within the employment and training system are
operating effectively, and that the State’s businesses and workforce are benefiting from it.
The growth in the employment and training partnership can best be demonstrated by a couple of examples, one of which focuses on assistance to business and job seekers with new job opportunities, and another situation that involves the working partnership when jobs are lost.
Family Dollar Stores announced that they would establish a major distribution center in Maquoketa, Iowa, that would employ 500 workers at an average of over $10 per hour. For this small Iowa community of 6,000 residents, and for the employment and training system, this announcement signaled both a major opportunity and a major challenge. The partnership of employment and training providers in the Region pulled together to meet this challenge. The Iowa Workforce Development and WIA office in the community established referral and application procedures for all of the 3,000 job applicants. Special
arrangements were made for obtaining assessment surveys and conducting interviews. IWD, WIA, and the regional partnership of agencies joined with the local community college, regional transit authorities and local government to address issues of referral and application, support services, housing, and transportation. Local and regional economic development interests used the broadened capacity of the partnership throughout this success story. And finally, the employment and training system cushioned the impact of the new employer on other area business that lost employees to the new center by working just as hard to assist them in replacing their workforce.
The partnership also works at a time when jobs are lost. The Sioux Tools Company announced in August of 2001 that it was ceasing operations at its Sioux City, Iowa, plant and 162 workers would be dislocated. As is typical in such situations, the State Rapid Response effort was initiated immediately, and multiple service partners at the regional level were engaged to react to this
situation. Meetings with business and worker representatives and members of the partnership were held to assess needs and develop an action plan, and employee meetings were held to apprize workers of the services that were available. State funds were immediately made available to provide initial services to the workers, and to begin gathering the data necessary to develop an application for a National Emergency Grant. That application sought $297,550 to provide services to the Sioux Tools workers and dislocated workers from Terex-Schaeff, Inc., another Sioux City plant that had reduced its labor force. Members of the partnership, the two businesses, local government, and elected officials supported the grant
Cost Effectiveness of the WIA programs
The State of Iowa evaluates the cost effectiveness of its WIA programs by comparing the average cost of providing services (Average Cost per Participant) to the average increase in wages earned after WIA services were completed (Average 12 Month Earnings Change). This comparison is being made for each of the three funding streams of Adult, Youth, and Dislocated Worker.
The chart below provides information on total expenditures in each funding stream as well as the number of participants. From this information, an Average Cost per Participant is calculated. The Average Cost per Participant is then compared to the Average Earnings Change in 12 Months to calculate a cost effectiveness ratio. The Average Earnings Change in 12 Months is a calculation of the average increase in Unemployment Insurance (UI) reported wages for the 4th and 5th quarters after exit over those reported for the 2nd and 3rd quarters prior to registration. The wage record information represents all data that was available for participants who exited from the Adult, Dislocated Worker, and Youth
programs.
Number
Avg. 12 mos.
Participants Avg. Cost/ Earnings
Program Expenditures Served Participant Change C-E Ratio
Adult $2,403,983 1059 $2,270 $6,414 1:2.83 Youth $3,014,638 902 $3,342 $6,644 1:1.99 Dislocated Worker $3,626,413 2571 $1,411 $2,405 ** 1:1.70
** Since the national goal for Wage Replacement for Dislocated Workers is 90%, the Earnings Change for Dislocated Workers was calculated based on 90% of pre-program earnings.
Wage record data was available for 43% of Adults exiting the program. For each $1.00 of WIA Adult resources spent there was an increase of $2.83 in participant earnings 12 months after the completion of services. 53% of Youth had wage record data, which showed that each $1.00 of WIA Youth resources resulted in an increase of $1.99 in participant earnings. For the 62% of Dislocated Workers wage records obtained, each $1.00 of WIA Dislocated Worker resources spent resulted in an increase of $1.70 in participant earnings 12 months after the completion of services.
This method provides a point-in-time comparison and does not involve
cumulative increased earnings, potential reductions in public assistance payments and/or benefits, or increased federal and state tax revenues from personal income and sales tax. Therefore, the overall cost effectiveness of the programs can be assumed to be considerably higher than this point-in-time, conservative
Summary of Statewide Achievements of the WIA Programs
Regional training was provided on the WIA Youth Applicant and Participant Process. The purpose of the training was to provide clarification to the Applicant and Participant Process for the WIA Youth Program and to address youth program questions and concerns.
Region 2, located in Mason City, Iowa, was nationally designated as a Showcase One-Stop. The Region 2 One-Stop has successfully developed a system that includes co-location and integrated services for a significant number of partners. The One-Stop not only offers WIA, Wagner-Peyser, Vocational Rehabilitation and TANF (Promise Jobs) services, but also offers services through other state agencies and several community-based nonprofit organizations.
Regional Roundtables were held for the Adult and Dislocated Worker staff. The Iowa Association of Workforce Professional held its first annual conference in May 2002.
Twelve WIA youth staff received the Advancing Youth Development Training. Two tools for measuring Work Readiness and Occupational Readiness for youth are the primary assessments for the local service providers across the state. The majority of the workforce regions in Iowa use either Insight or the materials of Denise Bisonnette.
One Iowa region has meshed the WIA Youth Program Services with an existing School-to-Work (STW) system. The regional STW partnership is serving as the local Youth Advisory Council and, through partnerships with the school districts in the region, summer activities are available to all students. No labels, such as Talented and Gifted (TAG), Vocational Rehabilitation, WIA, are attached to the youth and neither employers nor students are aware of the funding streams that support individual participants. This region has also developed a curriculum for youth participating in work experience activities and in the majority of the districts, students receive school credit toward graduation upon successful completion of a work experience.
A process for awarding a Work Readiness Credential for older youth who do not participate in a formal training component was implemented.
Training was provided to Youth Advisory Councils in eight of the sixteen local regions.
State staff conducted technical assistance monitoring visits in each of the sixteen regions of Iowa. The monitoring visits were designed to identify effective
practices and areas in need of improvement. Effective practices from national and state programs were shared to encourage continuous improvement.
The Adult Program
The purpose of the Adult program is to provide employment and training assistance to adults (age 18 and older) to increase their employment, earnings, occupational skill attainment, and job retention. Three levels of service are available to adults: core services, intensive services, and training services. Adults must first receive core services before they can move on to intensive services, and must receive intensive services before they can move on to training services. Because Adult Program funds are limited, priority in the provision of intensive and training services must be given to adults who are low-income or welfare recipients.
The following results were achieved by the Adult program during Program Year 2001:
• 1,059 Adult participants were served;
• There was a 22.3% increase in number of Adult participants served as compared to the previous year;
• $2,403,983 were expended providing services to Adult participants; • Adult participants earned an average of $3,543.43 the 1st quarter after exit
from the program;
• All four of the performance measures for the adult program were achieved at the Department of Labor negotiated performance level.
The Dislocated Worker Program
The purpose of the Dislocated Worker Program is to provide services those individuals who are unemployed due to a layoff or business closing and are unlikely to return to their previous occupation. Dislocated workers include displaced homemakers and the self-employed. Services for dislocated workers are provided when a participant is unable to find a job comparable to their job of dislocation. The goal for the participant is to become re-employed into positions that will lead to self-sufficiency. The levels of service are the same as for the adult program: core services, intensive services, and training services.
During PY 01, Iowa experienced a significant increase in the number of worker dislocations. In response, regional dislocated worker roundtables were conducted for technical assistance and as an opportunity for the sixteen regions to share best practices for customer service. One of the major initiatives that came out of that effort was the establishment of the Iowa Advantage Program. Iowa Advantage is designed to provide dislocated workers with quick and effective services to begin their Individual Re-Employment Plan. The program offers a series of workshops that provide job seeking/keeping skills, resume writing, career counseling, labor market information, budgeting, and merely surviving the layoff. The workshops provide self-service/information core services and staff-assisted core services.
The following results were achieved by the Dislocated Worker program during Program Year 2001:
• 2,570 Dislocated Workers received WIA services;
• There was an increase of 52.9% in the number of Dislocated Worker participants served as compared to the previous year;
• $3,626,413 were expended to provide services to Dislocated Worker participants;
• Participants in the dislocated worker program earned an average of $4,855.74 during the 1st quarter after exit;
• The dislocated worker program achieved all four of the program performance measures at the Department of Labor negotiated level. Rapid Response Program for Dislocated Workers
As the name implies, the Rapid Response Program reacts as quickly as possible to announcements of mass layoffs or dislocations in the State. Rapid Response is conducted by the State Dislocated Worker Unit. If a business that employs 100 or more individuals is either closing or experiencing a permanent lay off of 50 or more individuals, the Worker Adjustment and Retraining Notification (WARN) Act is in effect. The State Dislocated Worker Unit receives the WARN notice that, in turn, often triggers a Rapid Response. The Rapid Response coordinator contacts local Iowa Workforce Development and Workforce Investment Act providers, the business, and the local service providers to arrange a Rapid Response meeting. The purpose of this meeting is to share information regarding all available programs and determine a schedule to disseminate this information to the workers. The Rapid Response Coordinator has the responsibility of arranging this meeting and also serving as the facilitator.
The following results were achieved by the Rapid Response program during Program Year 2001:
• 51 WARN notices were received by the State Dislocated Worker Unit, impacting 6,443 workers;
• The dislocated worker unit conducted 34 Rapid Response meetings during PY 01. (The discrepancy in the number of WARN notices received and the number of Rapid Response meetings is due to the issuance of WARN notices for layoffs and/or closings affecting less than 50 individuals, or the layoffs were determined to be temporary. There are also situations where a WARN is issued, but all employees are retained by a new owner.) • 27 Non-WARN events were brought to the attention of the State
Dislocated Worker Unit, impacting 3,744 workers. The dislocated worker unit conducted 5 Rapid Response meetings to address these situations, and regional WIA service providers also held locally sponsored Rapid
Early Intervention Grants
Early Intervention Grants are funded through the Governor’s 25% set-aside funds. The grants are awarded to regions that have experienced a business closure or permanent reduction that has resulted in the displacement of a minimum of 30 or more employees. The Grants are awarded to the WIA Region Contract provider at the rate of $65 per individual displaced and range from a minimum of $1,950 (30 employees) to a $20,000 maximum. These funds are used by the regions over a 120-day calendar period to provide services such as recruitment, initial
assessment, core services, staff-assisted core services, and intensive services to help the displaced workers transition from being unemployed to employed. These funds may also be utilized for providing Iowa Advantage classes.
The following results were achieved by the Early Intervention program during Program Year 2001:
• Eleven Early Intervention Grants were transitioned into the new year providing $147,595 to the local Regions. These funds provided services to 2,241 participants.
• An additional 21 Early Intervention Grants were awarded providing $169,900 to the local Regions. These funds provided services to 3,186 participants.
National Emergency Grants
National Emergency Grants (NEG), and its predecessor National Reserve Account (NRA), are grants awarded by the Department of Labor to the State of Iowa based upon an applications submitted by the state on behalf of dislocated workers from a business that has experienced a closure or permanent reduction in staff totaling 50 or more employees. Sincea National Emergency Grant (NEG) requires a minimum of 50 participants, multiple companies may be combined within the region to achieve the 50 or more displacements. The state then subcontracts the grant to the WIA Region service provider. The money from these Grants are used in addition to formula Dislocated Worker funds to provide recruitment, initial assessment, core services, staff-assisted services, and intensive services to assist the displaced workers in their return to the workforce. These funds have a “life span” of a maximum of 3 years.
The following results were achieved by the NEG program during Program Year 2001:
• 13 National Reserve Account (NRA) grants as well as 6 National
Emergency Grants (NEG) were transitioned into the program year. These 19 grants provided $11,315,239 to assist up to 1,944 participants; • 8 additional National Emergency Grants (NEG) were awarded to provide
• $778,008.00 was “re-booked” from existing National Reserve Account grants to TAA/NAFTA to assist 792 Trade/NAFTA participants. The Youth Program
The WIA Youth Program in Iowa is based on a youth development model. Employment and training services provided to youth ages 14-21 are not separated from comprehensive needs of youth. Instead, traditional workforce development approaches are integrated with youth development approaches to develop a system of effective services and connections for youth. IWD is an active partner in the Iowa Youth Development Collaboration (ICYD), a statewide partnership across state agencies and nonprofit organizations that work to implement youth development practices in all youth services and programs. Participation in the ICYD has contributed to the development of Iowa’s WIA Youth Program by providing a youth development framework around which to plan employment and training services.
The growth and development of the WIA Youth Program has been slow yet significant in the State of Iowa. Iowa has strongly supported the evolution of employment and training programs and services moving to the comprehensive youth development model through the implementation of WIA.
The following results were achieved by the Youth program during Program Year 2001:
Older Youth (age 19 to 21)
• 326 Older Youth participants were served;
• The number of Older Youth participants served over the previous year increased by 51.4%;
• $1,478,703 were expended providing services to Out-of-School Youth participants;
• Older Youth participants earned an average of $3,018.95 in their first quarter after exiting the program;
• All Older Youth performance standards were met at or above the negotiated level.
Younger Youth (age 14 to 18)
• 576 Younger Youth participants were served
• The number of youth participants served over the previous year increased by 75.4%;
• $1,535,935 were expended providing services to Younger Youth participants;
• 2 of 3 Younger Youth performance standards were met at or above the DOL negotiated performance level.
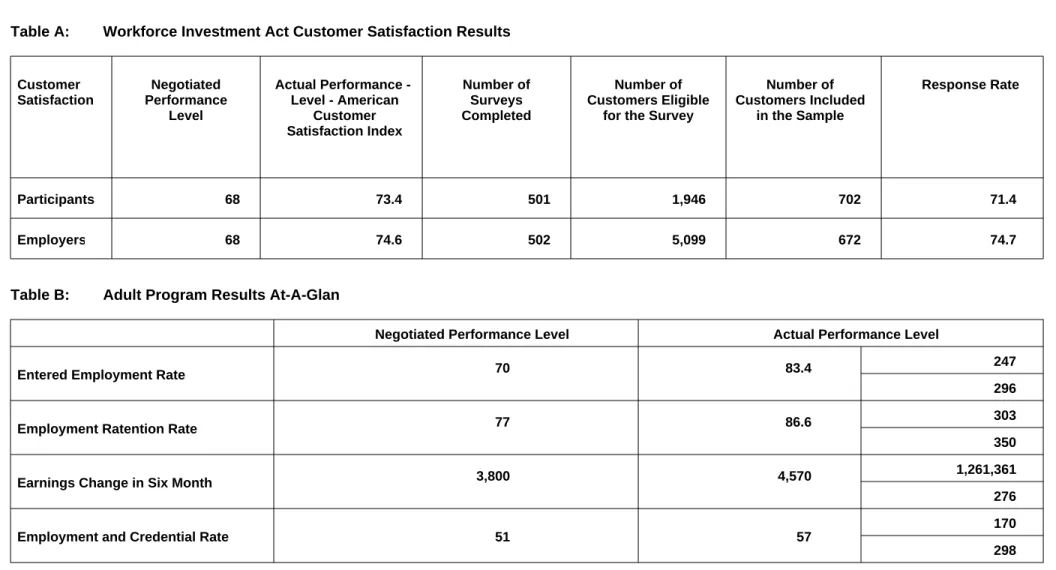
Page 1 of 7 Customer Satisfaction Participants Employers Negotiated Performance Level Actual Performance Level - American Customer Satisfaction Index Number of Surveys Completed Number of Customers Eligible
for the Survey
Number of Customers Included in the Sample Response Rate 68 73.4 501 1,946 702 71.4 68 74.6 502 5,099 672 74.7
Table B: Adult Program Results At-A-Glan
Negotiated Performance Level Actual Performance Level
Entered Employment Rate
Employment Ratention Rate
Earnings Change in Six Month
Employment and Credential Rate
70 83.4 247 296 77 86.6 303 350 3,800 4,570 1,261,361 276 51 57 170 298 Table A: Workforce Investment Act Customer Satisfaction Results
IA
State Name: Program Year: 2001
Page 2 of 7
Table C: Outcomes for Adult Special Populations
Reported Information Entered Employment Rate Employment Retention Rate Earnings Change in Six Months Employment and Credential Rate
Public Assistance Recipients Receiving Intensive or Training Services
Veterans Individuals With
Disabilities Older Individuals 84.8 78 92 84.6 11 13 83.3 30 36 71.4 5 7 89.3 92 103 85.7 18 21 79.5 35 44 66.7 4 6 6,227 516,873 83 6,584 105,348 16 5,895 176,854 30 103 413 4 64.3 72 112 70.6 12 59 58.5 24 41 25 1 4
Table D: Other Outcome Information for the Adult Program
Reported Information Individuals Who Received
Training Services
Entered Employment Rate
Employment Retention Rate
Earnings Change in Six Months
Individuals Who Only Received Core and Intensive Services
81.9 167 204 87 80 92 87 220 253 85.6 83 97 5,696 1,144,895 201 1,553 116,467 75
Page 3 of 7
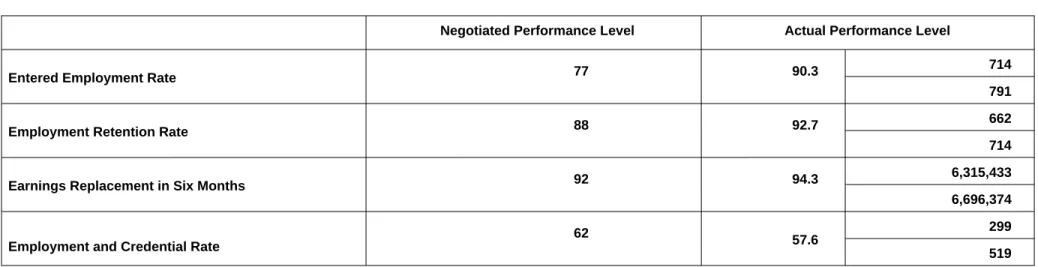
Table E: Dislocated Worker Program Results At-A-Glance
Entered Employment Rate
Employment Retention Rate
Earnings Replacement in Six Months
Employment and Credential Rate
Negotiated Performance Level Actual Performance Level
77 90.3 714 791 88 92.7 662 714 92 94.3 6,315,433 6,696,374 62 57.6 299 519
Table F: Outcomes for Dislocated Worker Special Populations Reported Information Entered Employment Rate Employment Retention Rate Earnings Replacement Rate Employmemt And Credential Rate
Veterans Individuals With Disabilities Older Individuals Displaced Homemakers
97.9 92 94 93.3 42 45 87 67 77 100 6 6 93.5 86 92 95.2 40 42 89.6 60 67 83.3 5 6 85.9 989,097 1,151,763 111.1 280,598 252,529 73.2 501,726 685,640 1,091.9 44,627 4,087 70.6 36 51 69 20 29 59.5 25 42 60 3 5
Page 4 of 7
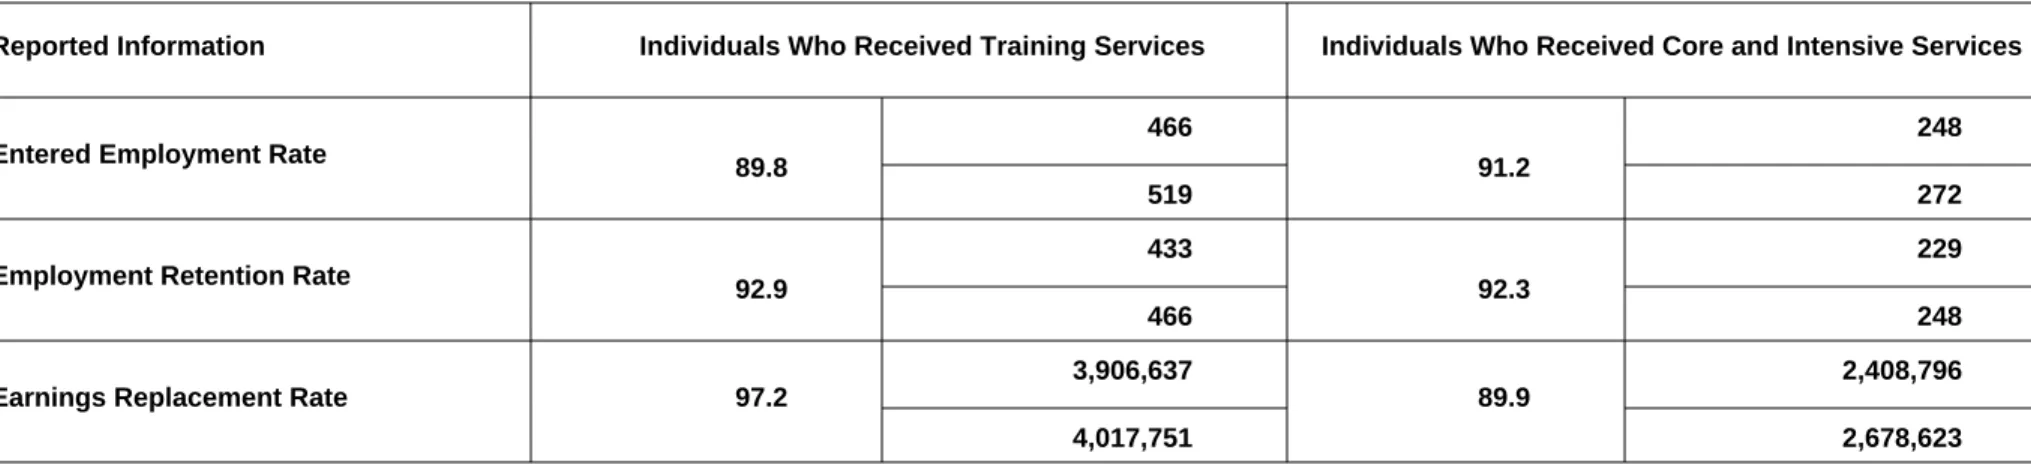
Table G: Other Outcome Information for the Dislocated Worker Program
Reported Information
Entered Employment Rate
Employment Retention Rate
Earnings Replacement Rate
Individuals Who Received Training Services Individuals Who Received Core and Intensive Services
89.8 466 519 91.2 248 272 92.9 433 466 92.3 229 248 97.2 3,906,637 4,017,751 89.9 2,408,796 2,678,623
Table H: Older Youth Results At-A-Glance
Entered Employment Rate
Employment Retention Rate
Earnings Change in Six Months
Credential Rate
Negotiated Performance Level Actual Performance Level
67 75.8 50 66 77 85.7 66 77 2,700 4,184 234,317 56 52 43.9 43 98
Page 5 of 7
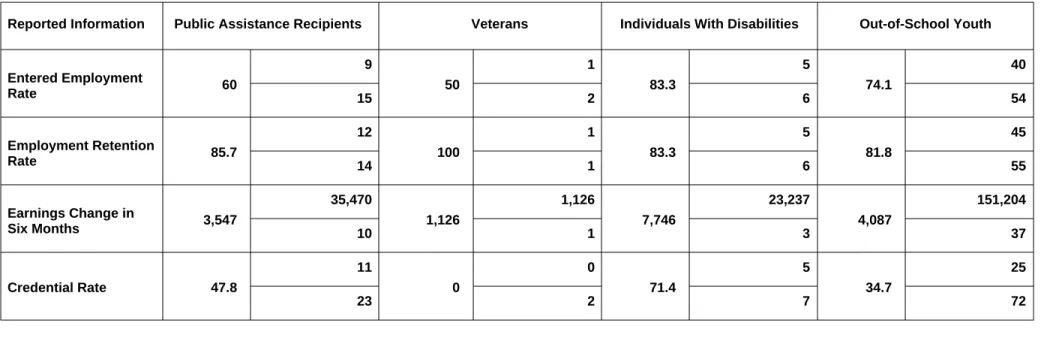
Table I: Outcomes for Older Youth Special Populations
Reported Information Entered Employment Rate Employment Retention Rate Earnings Change in Six Months Credential Rate
Public Assistance Recipients Veterans Individuals With Disabilities Out-of-School Youth
60 9 50 1 2 83.3 5 6 74.1 40 54 85.7 12 14 100 1 1 83.3 5 6 81.8 45 55 3,547 35,470 10 1,126 1,126 1 7,746 23,237 3 4,087 151,204 37 47.8 11 23 0 0 2 71.4 5 7 34.7 25 72 15
Table J: Younger Youth Results At-A-Glance
Skill Attainment Rate
Diploma or Equivalent Attainment Rate
Retention Rate
Negotiated Performance Level Actual Performance Level
65 58 224 386 56 38 41 108 55 65.4 51 78
Page 6 of 7
Table K: Outcomes for Younger Youth Special Populations
Reported Information Skill Attainment Rate Diploma or Equivalent Attainment Rate Retention Rate
Public Assistance Recipients Individuals Disabilities Out-of-School Youth
62.6 72 115 78.5 51 65 59.7 43 72 26.7 8 30 52.9 9 17 32 8 25 56.3 9 16 53.8 7 13 79.5 31 39
Table L: Other Reported Information
Adults Dislocated Workers Older Youth 12 Month Employment Retention Rate
12 Mo. Earnings Change (Adults and Older Youth) or 12 Mo. Earnings Replacement (Dislocated Workers) Placements for Participants in Nontraditional Employment
Wages At Entry Into Employment For Those Individuals Who
Entered Employment Unsubsidized
Employment
Entry Into Unsubsidized Employment Related to the Training Received of
Those Who Completed Training Services 86.3 359 416 6,549 1,670,111 255 4 10 247 3,361 763,045 227 35.3 59 167 90.1 735 816 114.2 6,824,699 5,974,767 5.2 37 714 4,940 3,250,199 658 47 219 466 85.7 72 84 6,920 373,692 54 2 1 50 2,586 124,110 48
Page 7 of 7
Table M: Participation Levels
Adults
Dislocated Workers Older Youth Younger Youth
Total Participants Served Total Exiters
1,059 502
2,570 1,191
326 131
576 181
Table N: Cost of Program Activities
Program Activity Total Federal Spending
Local Adults
Local Dislocated Workers Local Youth
Rapid Response (up to 25%) 134 (a) (2) (A)
Statewide Required Activities (up to 25%) 134 (a) (2) (B)
Statewide Allowable Activities 134 (a) (3) $2,403,983.00 $3,626,413.00 $3,014,638.00 $556,501.00 $620,701.00 Training $5,000.00 Data Processing $341,134.00 Customer Satisfaction Tracking $17,137.00 Grants to Regions $195,713.00
$10,781,220.00 Total of All Federal Spending Listed Above
WIA Annual Report Data
Page 1 of 16
Table O: Summary of Participants
State Name: IA Progam Year: 2001
Local Area Name:
Total Participants Served Adults Dislocated Workers Older Youth Younger Youth Total Exiters Adults Dislocated Workers Older Youth Younger Youth Burlington Workforce Development
Board Region 16 84 322 26 24 54 122 10 6 Negotiated Performance Level Actual Performance Level Customer Satisfaction Program Participants Employers Adults Dislocated Workers Older Youth Entered Employment Rate
Retention Rate
Adults
Dislocated Workers Older Youth Younger Youth
Earnings Change / Earnings Replacement in Six Months
Adults($)
Dislocated Workers Older Youth ($)
Credential / Diploma Rate
Adults
Dislocated Workers Older Youth Younger Youth
Skill Attainment Rate Younger Youth
Description of Other State Indicators of Performance
Overall Status of Local Performance
68 62 68 76 66 86.7 80 86.4 67 100 76 76.5 88 89.5 73 100 55 50 3,900 7,260 92 65.1 2,500 2,124 51 50 62 52.9 52 50 56 0 65 66.7 2
Not Met Met Exceeded
WIA Annual Report Data
Page 2 of 16
Table O: Summary of Participants
State Name: IA Progam Year: 2001
Local Area Name:
Total Participants Served Adults Dislocated Workers Older Youth Younger Youth Total Exiters Adults Dislocated Workers Older Youth Younger Youth Central Iowa Employment & Training
Consortium Region 11 84 403 44 121 44 207 22 36 Negotiated Performance Level Actual Performance Level Customer Satisfaction Program Participants Employers Adults Dislocated Workers Older Youth Entered Employment Rate
Retention Rate
Adults
Dislocated Workers Older Youth Younger Youth
Earnings Change / Earnings Replacement in Six Months
Adults($)
Dislocated Workers Older Youth ($)
Credential / Diploma Rate
Adults
Dislocated Workers Older Youth Younger Youth
Skill Attainment Rate Younger Youth
Description of Other State Indicators of Performance
Overall Status of Local Performance
68 66 68 73 67 80.5 77 89.9 73 57.9 83 80.6 88 95.2 82 71.4 55 75 3,900 3,122 92 95.2 2,700 2,814 51 21.9 62 40.4 52 8.7 56 23.3 65 24.2 6
Not Met Met Exceeded
WIA Annual Report Data
Page 3 of 16
Table O: Summary of Participants
State Name: IA Progam Year: 2001
Local Area Name:
Total Participants Served Adults Dislocated Workers Older Youth Younger Youth Total Exiters Adults Dislocated Workers Older Youth Younger Youth Council of Governments Region 8
17 62 5 4 10 30 2 3 Negotiated Performance Level Actual Performance Level Customer Satisfaction Program Participants Employers Adults Dislocated Workers Older Youth Entered Employment Rate
Retention Rate
Adults
Dislocated Workers Older Youth Younger Youth
Earnings Change / Earnings Replacement in Six Months
Adults($)
Dislocated Workers Older Youth ($)
Credential / Diploma Rate
Adults
Dislocated Workers Older Youth Younger Youth
Skill Attainment Rate Younger Youth
Description of Other State Indicators of Performance
Overall Status of Local Performance
68 72 68 76 70 100 77 83.8 67 0 77 75 86 87.1 77 0 55 100 3,800 4,897 92 94.8 2,700 0 51 62.5 62 53.3 52 0 56 100 65 75 4
Not Met Met Exceeded
WIA Annual Report Data
Page 4 of 16
Table O: Summary of Participants
State Name: IA Progam Year: 2001
Local Area Name:
Total Participants Served Adults Dislocated Workers Older Youth Younger Youth Total Exiters Adults Dislocated Workers Older Youth Younger Youth Eastern Iowa Community College 9
106 358 80 149 57 174 31 49 Negotiated Performance Level Actual Performance Level Customer Satisfaction Program Participants Employers Adults Dislocated Workers Older Youth Entered Employment Rate
Retention Rate
Adults
Dislocated Workers Older Youth Younger Youth
Earnings Change / Earnings Replacement in Six Months
Adults($)
Dislocated Workers Older Youth ($)
Credential / Diploma Rate
Adults
Dislocated Workers Older Youth Younger Youth
Skill Attainment Rate Younger Youth
Description of Other State Indicators of Performance
Overall Status of Local Performance
68 75 68 77 70 72.7 81 90.4 67 69.2 77 76.4 88 91.5 77 86.7 55 61.1 3,800 2,648 92 87.9 2,700 2,126 51 41.5 62 57.3 52 21.1 56 19.2 65 68.8 4
Not Met Met Exceeded
WIA Annual Report Data
Page 5 of 16
Table O: Summary of Participants
State Name: IA Progam Year: 2001
Local Area Name:
Total Participants Served Adults Dislocated Workers Older Youth Younger Youth Total Exiters Adults Dislocated Workers Older Youth Younger Youth Hawkeye Community College Workforce
Development 127 105 18 30 57 47 6 9 Negotiated Performance Level Actual Performance Level Customer Satisfaction Program Participants Employers Adults Dislocated Workers Older Youth Entered Employment Rate
Retention Rate
Adults
Dislocated Workers Older Youth Younger Youth
Earnings Change / Earnings Replacement in Six Months
Adults($)
Dislocated Workers Older Youth ($)
Credential / Diploma Rate
Adults
Dislocated Workers Older Youth Younger Youth
Skill Attainment Rate Younger Youth
Description of Other State Indicators of Performance
Overall Status of Local Performance
68 76 68 73 73 83.3 81 90.6 71 100 79 85.7 86 86.2 78 85.7 55 100 4,500 3,415 92 106.8 2,900 6,237 51 67.7 62 79 52 85.7 56 100 65 63.6 2
Not Met Met Exceeded
WIA Annual Report Data
Page 6 of 16
Table O: Summary of Participants
State Name: IA Progam Year: 2001
Local Area Name:
Total Participants Served Adults Dislocated Workers Older Youth Younger Youth Total Exiters Adults Dislocated Workers Older Youth Younger Youth Indian Hills Workforce Development 15
115 78 16 50 50 33 14 18 Negotiated Performance Level Actual Performance Level Customer Satisfaction Program Participants Employers Adults Dislocated Workers Older Youth Entered Employment Rate
Retention Rate
Adults
Dislocated Workers Older Youth Younger Youth
Earnings Change / Earnings Replacement in Six Months
Adults($)
Dislocated Workers Older Youth ($)
Credential / Diploma Rate
Adults
Dislocated Workers Older Youth Younger Youth
Skill Attainment Rate Younger Youth
Description of Other State Indicators of Performance
Overall Status of Local Performance
68 81 68 72 71 88.5 78 89.5 73 100 76 86.7 88 79.4 74 75 55 50 3,900 3,572 92 75.7 2,400 7,608 51 62.5 62 59.4 52 87.5 56 27.3 65 49.2 2
Not Met Met Exceeded
WIA Annual Report Data
Page 7 of 16
Table O: Summary of Participants
State Name: IA Progam Year: 2001
Local Area Name:
Total Participants Served Adults Dislocated Workers Older Youth Younger Youth Total Exiters Adults Dislocated Workers Older Youth Younger Youth Iowa Valley Employment and Training 6
19 72 5 4 16 29 2 1 Negotiated Performance Level Actual Performance Level Customer Satisfaction Program Participants Employers Adults Dislocated Workers Older Youth Entered Employment Rate
Retention Rate
Adults
Dislocated Workers Older Youth Younger Youth
Earnings Change / Earnings Replacement in Six Months
Adults($)
Dislocated Workers Older Youth ($)
Credential / Diploma Rate
Adults
Dislocated Workers Older Youth Younger Youth
Skill Attainment Rate Younger Youth
Description of Other State Indicators of Performance
Overall Status of Local Performance
68 79 68 63 77 88.9 76 95.2 65 100 82 100 88 95 65 100 55 100 3,900 3,669 92 115.5 2,200 5,381 51 50 62 52.9 52 0 56 100 65 83.3 1
Not Met Met Exceeded
WIA Annual Report Data
Page 8 of 16
Table O: Summary of Participants
State Name: IA Progam Year: 2001
Local Area Name:
Total Participants Served Adults Dislocated Workers Older Youth Younger Youth Total Exiters Adults Dislocated Workers Older Youth Younger Youth Iowa Western Workforce Development
Region 13 61 88 27 14 25 34 10 4 Negotiated Performance Level Actual Performance Level Customer Satisfaction Program Participants Employers Adults Dislocated Workers Older Youth Entered Employment Rate
Retention Rate
Adults
Dislocated Workers Older Youth Younger Youth
Earnings Change / Earnings Replacement in Six Months
Adults($)
Dislocated Workers Older Youth ($)
Credential / Diploma Rate
Adults
Dislocated Workers Older Youth Younger Youth
Skill Attainment Rate Younger Youth
Description of Other State Indicators of Performance
Overall Status of Local Performance
68 74 68 73 66 89.5 72 91.4 66 100 65 94.7 85 100 76 100 55 33.3 4,000 4,217 93 104.3 2,800 6,614 51 78.6 67 55.6 52 83.3 56 100 65 100 1
Not Met Met Exceeded
WIA Annual Report Data
Page 9 of 16
Table O: Summary of Participants
State Name: IA Progam Year: 2001
Local Area Name:
Total Participants Served Adults Dislocated Workers Older Youth Younger Youth Total Exiters Adults Dislocated Workers Older Youth Younger Youth Iowa Workforce Development Region 10
153 209 15 29 54 105 5 6 Negotiated Performance Level Actual Performance Level Customer Satisfaction Program Participants Employers Adults Dislocated Workers Older Youth Entered Employment Rate
Retention Rate
Adults
Dislocated Workers Older Youth Younger Youth
Earnings Change / Earnings Replacement in Six Months
Adults($)
Dislocated Workers Older Youth ($)
Credential / Diploma Rate
Adults
Dislocated Workers Older Youth Younger Youth
Skill Attainment Rate Younger Youth
Description of Other State Indicators of Performance
Overall Status of Local Performance
68 68 68 72 71 73.7 78 94.8 60 75 79 95.2 90 91.8 75 100 55 50 4,100 6,035 92 90.2 2,700 1,609 51 68 62 60 52 33.3 56 66.7 65 25 3
Not Met Met Exceeded
WIA Annual Report Data
Page 10 of 16
Table O: Summary of Participants
State Name: IA Progam Year: 2001
Local Area Name:
Total Participants Served Adults Dislocated Workers Older Youth Younger Youth Total Exiters Adults Dislocated Workers Older Youth Younger Youth Iowa Workforce Development Region 14
61 86 10 19 25 56 3 7 Negotiated Performance Level Actual Performance Level Customer Satisfaction Program Participants Employers Adults Dislocated Workers Older Youth Entered Employment Rate
Retention Rate
Adults
Dislocated Workers Older Youth Younger Youth
Earnings Change / Earnings Replacement in Six Months
Adults($)
Dislocated Workers Older Youth ($)
Credential / Diploma Rate
Adults
Dislocated Workers Older Youth Younger Youth
Skill Attainment Rate Younger Youth
Description of Other State Indicators of Performance
Overall Status of Local Performance
68 74 68 75 73 91.7 76 95.4 73 50 77 90.9 90 95.1 81 100 55 100 3,900 4,399 92 89.3 2,800 9,455 51 80 62 55.6 52 66.7 56 0 65 62.5 2
Not Met Met Exceeded
WIA Annual Report Data
Page 11 of 16
Table O: Summary of Participants
State Name: IA Progam Year: 2001
Local Area Name:
Total Participants Served Adults Dislocated Workers Older Youth Younger Youth Total Exiters Adults Dislocated Workers Older Youth Younger Youth Iowa Workforce Development Region 2
19 111 3 17 8 68 1 11 Negotiated Performance Level Actual Performance Level Customer Satisfaction Program Participants Employers Adults Dislocated Workers Older Youth Entered Employment Rate
Retention Rate
Adults
Dislocated Workers Older Youth Younger Youth
Earnings Change / Earnings Replacement in Six Months
Adults($)
Dislocated Workers Older Youth ($)
Credential / Diploma Rate
Adults
Dislocated Workers Older Youth Younger Youth
Skill Attainment Rate Younger Youth
Description of Other State Indicators of Performance
Overall Status of Local Performance
68 70 68 73 74 88.9 82 92.3 75 0 78 92.3 85 94.4 81 0 55 66.7 4,100 5,119 92 102.4 2,900 0 51 66.7 62 55 52 0 56 100 65 95.5 4
Not Met Met Exceeded
WIA Annual Report Data
Page 12 of 16
Table O: Summary of Participants
State Name: IA Progam Year: 2001
Local Area Name:
Total Participants Served Adults Dislocated Workers Older Youth Younger Youth Total Exiters Adults Dislocated Workers Older Youth Younger Youth NW Iowa Planning Region 3&4-1
15 30 8 16 7 15 0 3 Negotiated Performance Level Actual Performance Level Customer Satisfaction Program Participants Employers Adults Dislocated Workers Older Youth Entered Employment Rate
Retention Rate
Adults
Dislocated Workers Older Youth Younger Youth
Earnings Change / Earnings Replacement in Six Months
Adults($)
Dislocated Workers Older Youth ($)
Credential / Diploma Rate
Adults
Dislocated Workers Older Youth Younger Youth
Skill Attainment Rate Younger Youth
Description of Other State Indicators of Performance
Overall Status of Local Performance
68 68 68 79 69 100 68 78.6 64 0 83 80 89 90.9 70 0 55 0 4,500 4,644 92 125.5 2,700 0 51 40 62 35.7 52 0 56 100 65 100 7
Not Met Met Exceeded
WIA Annual Report Data
Page 13 of 16
Table O: Summary of Participants
State Name: IA Progam Year: 2001
Local Area Name:
Total Participants Served Adults Dislocated Workers Older Youth Younger Youth Total Exiters Adults Dislocated Workers Older Youth Younger Youth NW Iowa Planning Region 3&4-2
8 19 3 12 4 7 2 2 Negotiated Performance Level Actual Performance Level Customer Satisfaction Program Participants Employers Adults Dislocated Workers Older Youth Entered Employment Rate
Retention Rate
Adults
Dislocated Workers Older Youth Younger Youth
Earnings Change / Earnings Replacement in Six Months
Adults($)
Dislocated Workers Older Youth ($)
Credential / Diploma Rate
Adults
Dislocated Workers Older Youth Younger Youth
Skill Attainment Rate Younger Youth
Description of Other State Indicators of Performance
Overall Status of Local Performance
68 80 68 69 69 100 73 100 67 0 77 100 85 100 77 0 55 0 3,900 7,415 92 94.7 2,700 0 51 0 62 80 52 0 56 0 65 100 7
Not Met Met Exceeded
WIA Annual Report Data
Page 14 of 16
Table O: Summary of Participants
State Name: IA Progam Year: 2001
Local Area Name:
Total Participants Served Adults Dislocated Workers Older Youth Younger Youth Total Exiters Adults Dislocated Workers Older Youth Younger Youth Upper Exploreland Workforce Board
Region 1 83 317 36 42 39 96 10 7 Negotiated Performance Level Actual Performance Level Customer Satisfaction Program Participants Employers Adults Dislocated Workers Older Youth Entered Employment Rate
Retention Rate
Adults
Dislocated Workers Older Youth Younger Youth
Earnings Change / Earnings Replacement in Six Months
Adults($)
Dislocated Workers Older Youth ($)
Credential / Diploma Rate
Adults
Dislocated Workers Older Youth Younger Youth
Skill Attainment Rate Younger Youth
Description of Other State Indicators of Performance
Overall Status of Local Performance
68 75 68 78 73 88.5 78 90.9 65 83.3 78 92.9 89 93.3 78 92.3 55 100 4,500 5,915 92 107.4 2,800 3,954 51 65.1 62 64.5 52 62.5 56 80 65 73.1
Not Met Met Exceeded
WIA Annual Report Data
Page 15 of 16
Table O: Summary of Participants
State Name: IA Progam Year: 2001
Local Area Name:
Total Participants Served Adults Dislocated Workers Older Youth Younger Youth Total Exiters Adults Dislocated Workers Older Youth Younger Youth Western Iowa Tech Community College
Region 12 85 250 30 33 41 142 13 16 Negotiated Performance Level Actual Performance Level Customer Satisfaction Program Participants Employers Adults Dislocated Workers Older Youth Entered Employment Rate
Retention Rate
Adults
Dislocated Workers Older Youth Younger Youth
Earnings Change / Earnings Replacement in Six Months
Adults($)
Dislocated Workers Older Youth ($)
Credential / Diploma Rate
Adults
Dislocated Workers Older Youth Younger Youth
Skill Attainment Rate Younger Youth
Description of Other State Indicators of Performance
Overall Status of Local Performance
68 74 68 72 67 83.3 72 85.8 63 66.7 75 94.4 89 96.9 75 66.7 55 60 4,000 5,750 92 93.7 2,700 6,775 51 70.6 62 60.4 52 60 56 66.7 65 59.1
Not Met Met Exceeded
WIA Annual Report Data
Page 16 of 16
Table O: Summary of Participants
State Name: IA Progam Year: 2001
Local Area Name:
Total Participants Served Adults Dislocated Workers Older Youth Younger Youth Total Exiters Adults Dislocated Workers Older Youth Younger Youth Workforce Investment Board Region 5
22 61 0 12 11 27 0 3 Negotiated Performance Level Actual Performance Level Customer Satisfaction Program Participants Employers Adults Dislocated Workers Older Youth Entered Employment Rate
Retention Rate
Adults
Dislocated Workers Older Youth Younger Youth
Earnings Change / Earnings Replacement in Six Months
Adults($)
Dislocated Workers Older Youth ($)
Credential / Diploma Rate
Adults
Dislocated Workers Older Youth Younger Youth
Skill Attainment Rate Younger Youth
Description of Other State Indicators of Performance
Overall Status of Local Performance
68 87 68 73 66 90 80 95.5 75 100 79 83.3 88 95.2 79 100 55 42.9 4,100 9,150 92 112.8 2,800 0 51 58.3 62 79 52 100 56 100 65 100 2
Not Met Met Exceeded