2018; 3(1): 6-11
http://www.sciencepublishinggroup.com/j/eas doi: 10.11648/j.eas.20180301.12
ISSN: 2575-2022 (Print); ISSN: 2575-1468 (Online)
Effect of Inertia Constant on Generator Frequency and
Rotor Angle
Ngyarmunta Alan Audu, Odaba Alphaeus, Talatu Adamu
Department of Electrical and Electronics Engineering, Air Force Institute of Technology, Kaduna, Nigeria
Email address:
To cite this article:
Ngyarmunta Alan Audu, Engr. Odaba Alpheous, Miss Talatu Adamu. Effect of Inertia Constant on Generator Frequency and Rotor Angle. Engineering and Applied Sciences. Vol. 3, No. 1, 2018, pp. 6-11. doi: 10.11648/j.eas.20180301.12
Received: November 25, 2017; Accepted: December 23, 2017; Published: February 1, 2018
Abstract:
Inertia constant of a rotating system describes the initial transient, frequency and rotor angle behavior of that system when subjected to a real power disturbance. Therefore, the inertia constant of a system can be a useful tool when investigating the frequency and rotor angle stability of a system. The use of the swing equation gives us a viable method for estimating the inertia constant, if a measurement of that can provide time stamps measurements of the frequency and power dynamics during a disturbance. In this project work, effect of inertia constant of synchronous generator (machine constant) on its frequency and rotor angle is investigated. Swing equation is used for modeling the dynamics of the system. It is then built and simulated using MATLAB. The analysis is done by observing how the frequency and rotor angle changes when the inertia constant is varied while keeping all system parameters constant. The study is extended to investigate the dynamics of such system with very high and those with very low inertia constant and the results show that the higher the value of the inertia constant, the higher the settling time and of course the maximum overshoot.Keywords:
Inertia Constant, Rotor Angle, Swing Equation, Frequency1. Introduction
A Power System consists of the generating machines and transmission network in which the generating machine includes turbine, alternator and excitation system [1]. Every synchronous generator has rotating rotor which has some inertia that depends upon the stored rotating energy in the system. Machine inertia significantly affects the rate of rise and fall of system frequency. In another words, frequency of rotor oscillations is very much affected by the size of the generator and its inertia. This inertia can be provided by flywheels, batteries with fast inverters, and other energy storage devices [2 - 4].
Inertia is an inherent property of synchronous generators, and frequency dynamics of the system within the first seconds after a disturbance is governed by inertial response of the rotating machines. For reliable operation of a power system, the operating frequency should be kept close to its nominal value. To ensure this, generated power should match power demanded by the load devices. Any disturbance in the grid leads to an imbalance between produced and consumed
electrical power. Before the activation of primary frequency control, this imbalance is compensated by the kinetic energy released to the grid (or drawn from it) by rotating masses. In case of a severe disturbance, if the power mismatch is not eliminated sufficiently fast by the protection systems, generators of the system might lose synchronism with the rest of the system. The loss of stability may lead to major consequences, such as damage of equipment and widespread outages. Inertia of the machines defines the rate of their acceleration or deceleration and, thus, the rate of the frequency deviation. High level of rotational inertia in the system prevents the system frequency from changing too fast after a disturbance [5, 6].
perturbation will become less predictable. This is an issue as the frequency stability for a particular set of operating limits [8].
Moreover, it is worth mentioning that high penetration of converter-connected renewable generation and consumer devices lead to reduction of rotational inertia in modern power systems. Low level of inertia in a power system affects system operation and its stability margin. Inertial response, inherent to rotating machines, deteriorates with the rise of inverter-connected RES. Since inertia level defines the rate of frequency deviation in the first seconds after a disturbance, reduced inertia results in faster frequency dynamics [9 - 11]. Operation of primary frequency control and protection systems becomes more challenging due to the larger and faster transient frequency deviations. One of the measures to mitigate the effects of reduced inertia is implementation of faster primary frequency control. Another possible solution is provision of artificial rotational inertia in the system. The latter option also allows providing additional damping for inter-area oscillations [12].
It is paramount to this study define the following important terms [13].
1.Power system stability is the ability of an electric power system, for a given initial operating condition, to regain a state of operating equilibrium after being subjected to a physical disturbance, with most system variables bounded so that practically the entire system remains intact. The three main categories of power system stability are rotor angle stability, voltage stability and frequency stability. The main focus of this work is on rotor angle stability and frequency stability.
2.Frequency stability refers to the ability of a power system to maintain steady frequency following a severe system upset resulting in a significant imbalance between generation and load. For the reliable operation of the system, the probability of large frequency excursions should be minimized.
3.Rotor angle stability is defined as the ability of synchronous machine of an interconnected power system to remain in synchronism after being subjected to a disturbance. It depends on the ability to equilibrium between electromagnetic torque and mechanical torque of each synchronous machine in the system. Instability that may result occurs in the form of increasing angular swings of some generators leading to their loss of synchronism with other generators. Rotor angle stability analysis involves the analysis of the effect of small disturbances on the system of interest and the dynamic behavior of the system subjected to a large disturbance (transient stability).
4.Transient stability is the ability of the power system to maintain synchronism when subjected to a severe transient disturbance, e.g. a short circuit on a transmission line. Whether a system remains stable or not after a large disturbance, depends on the initial state of this system and the severity of the disturbance.
2. Aim and Objectives
The aim of this project work is to investigate the impact of inertia changes on frequency and rotor angle oscillations using a detailed model of synchronous machine. The objectives to be used for achieving the stated aim are:-
a. Formulation of the synchronous generator dynamics thereby relating the inertia constant with the frequency and rotor angle change.
b. Developing the model in MATLAB environment to carry out the dynamic simulation of the system
c. Investigating the frequency and rotor angle dynamics using different inertia constant
d. Investigating the system response with very low and very high inertia constant.
3. Modeling and Simulation
During a fault, electrical power is reduced suddenly while mechanical power remains constant, thereby accelerating the rotor. To maintain transient stability, the generator must transfer the excess energy toward the system. These dynamic phenomena in power systems have a complex electromagnetic and mechanical nature. The simplest model of electro-mechanical swings in a power system represents solely the motion mechanics of the synchronous machine rotors and is based on the swing equation:
= −
where
H is the inertia constant of the synchronous generator is the mechanical angle of the rotor
Tm is the mechanical torque on the rotor Te is the electrical torque on the rotor
Swing equation is a nonlinear function of power angle. For small disturbance, the swing equation can be linearized with some approximation. Consider a small deviation, ∆ in power angle.
= + ∆
+ ∆
= − sin + ∆
+ ∆ = − sin cos ∆ + cos sin ∆
+ ∆ sin cos ∆
Since at theinitial operating state
sin
The above equation reduces to a linearized incremental power angle change
∆ cos ∆ 0
In as much as there is difference in angular velocity between the rotor and the resultant rotating air gap field, induction motor action will take place between them, and a torque will be set up on the rotor tending to minimize the difference between the two velocities. The damping power is;
Considering the damping, the linearized swing equation becomes
∆ ∆ ∆ 0
This can be interpreted as
∆ ∆ ∆ 0
In terms of standard second order differential equation,
∆
2ξ!" ∆ !" ∆ 0
Where !" the oscillation of natural frequency and # is the damping ratio (dimensionless).
ξ 2 %
By solving the above equation in terms of frequency change and rotor angle, the following equations are obtained.
For the motion of the synchronously revolving field,
∆
&1 ξ '()*+,sin !
-And the rotor frequency is
! ! !"∆
&1 ξ '()*+,sin !
The response time constant is;
. ξ!1 "
2
These equations are used to study the dynamics of the rotor angle and that of frequency using different values of the inertia constant, H.
Simulation
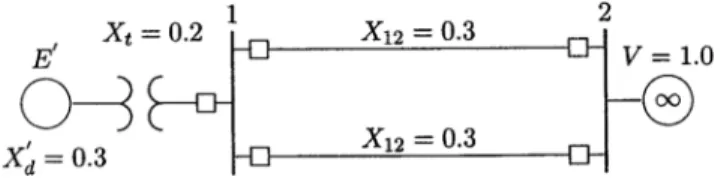
For the purpose of the simulation, a 50-Hz synchronous generator connected to an infinite bus through a purely reactive line shown below is considered (Adopted from Power System Analysis, Hadi Saadat).
Figure 1. 2-bus System Adopted for Analysis.
The following are assumed constant as related to the generator and the infinite bus.
Table 1. System parameters.
Parameter Values Used (Unit)
Real power delivered by the generator 0.6 (per unit)
Transient reactance 0.3 (per unit)
Power factor 0.8 (unit less)
Infinite bus voltage 1.0 (per unit)
Damping power coefficient 0.138 (per unit)
The system is subjected to a small disturbance of 100 (0.1745 radian). The following MATLAB code is developed to simulate the system for different values of the inertia constant. The values of inertia constant considered are 6, 9, 12, 15, 18 and 21 all in MJ/MVA.
4. Results and Discussion
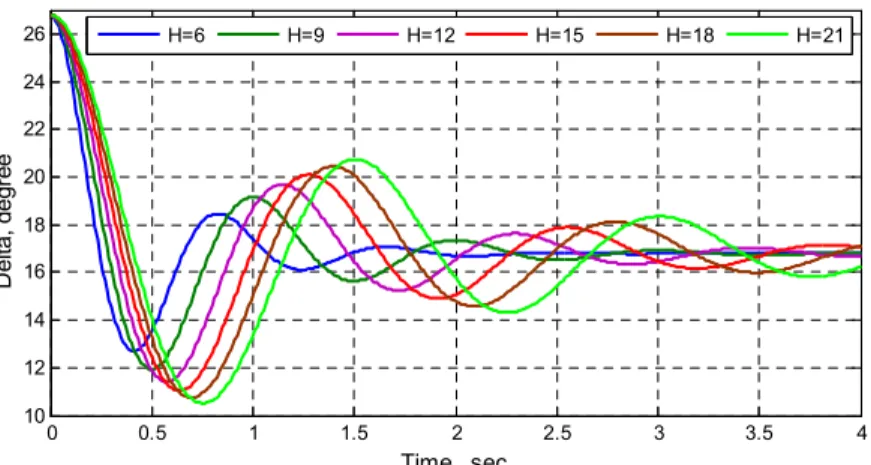
Figure 2. Variation of Rotor angle (Delta) with various values of inertia constant.
It can be inferred from the waveform of the rotor angle that the settling time and maximum overshoot are proportional to the values of the inertia constant (within certain range). The higher the value of the inertia constant, the higher the settling time and of course the maximum overshoot.
Considering infinitesimally large inertia constant, like
100MJ/MVA, the waveform will be completely sinusoidal. On the other hand, if very small value of inertia constant is considered, the waveform will be a complete exponentially decaying function. This can be derived in the equation describing the dynamics of the rotor angle. These waveforms are depicted in Figure 3 below.
Figure 3. Variation of Rotor angle (Delta) with very large and small values of inertia constant.
Figure 4. Variation of Frequency with various values of inertia constant.
Similarly, for the frequency, it can be deduced that the settling time and maximum overshoot are proportional to the values of the inertia constant (within certain range). The
higher the values of the inertia constant the higher the settling time and of course the maximum overshoot of the frequency.
Taking a very large inertia constant, like 100MJ/MVA, the
0 0.5 1 1.5 2 2.5 3 3.5 4
10 12 14 16 18 20 22 24 26
Time, sec
D
e
lta
,
d
e
g
re
e
H=6 H=9 H=12 H=15 H=18 H=21
0 0.5 1 1.5 2 2.5 3 3.5 4
10 15 20 25
Time, sec
R
o
to
r
A
n
g
le
(
d
e
g
re
e
)
H=0.1 H=100
0 0.5 1 1.5 2 2.5 3 3.5 4
49.85 49.9 49.95 50 50.05 50.1
Time, sec
F
re
q
u
e
n
c
y
(
H
z
)
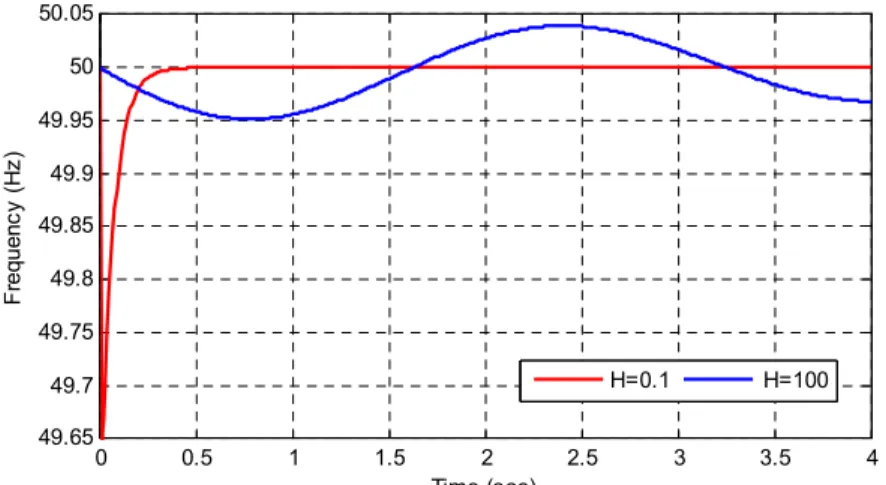
waveform will be completely sinusoidal, as in the case of the rotor angle. On the other hand, if very small value of inertia constant like 0.1MJ/MVA is considered, the frequency waveform will be a complete exponentially decaying
function. This can be also derived in the equation describing the dynamics of the frequency. These waveforms are depicted in Figure 5 below.
Figure 5. Variation of frequency with very large and small values of inertia constant.
5. Conclusion
In this project work, effect of inertia constant of synchronous generator (machine constant) on its frequency and rotor angle is investigated. Modeling of the dynamics of the system is done using Swing equation. It is then built and simulated using MATLAB. The analysis is done by observing how the frequency and rotor angle changes when the inertia constant is varied while keeping all system parameters constant. The study is extended to investigate the
dynamics of such system with very high and those with very inertia constant.
Although there are many parameters that can affect the rotor angle and the frequency of the generator, only the inertia constant is considered. Since the transient reactance generator model and swing equation model is not good enough for transient stability studies because of the linearization, a further study is necessary in order to take into account more detailed generator models together considering various parameters in the future.
Appendix
MATLAB CODES
%% DYNAMICS OF SYNCHRONOUS GENERATOR FREQUENCY AND ROTOR ANGLE E = 1.35;% Excitation Voltage
V= 1.0;% Generator Terminal Voltage X=0.65;% Transient reactance Pm=0.6;% Power Delivered D=0.138;% Damping Power Coeff. f0 = 50;% System Frequency H= [6 9 12 15 18 21];
Pmax = E*V/X, d0 = asin (Pm/Pmax)% Max. power Ps = Pmax*cos (d0)% Synchronizing power coefficient for i=1:1:length (H);
wn = sqrt (pi*60/H (i)*Ps)% Undamped frequency of oscillation z = D/2*sqrt (pi*60/(H (i)*Ps))% Damping ratio
wd = wn*sqrt (1-z^2), fd = wd/(2*pi)% Damped frequency oscill. tau = 1/(z*wn)% Time constant
th = acos (z)% Phase angle theta
Dd0 = 10*pi/180;% Initial angle in radian t = 0:.01:4;
Dd = Dd0/sqrt (1-z^2)*exp (-z*wn*t).*sin (wd*t + th); d = (d0+Dd)*180/pi;% Load angle in degree
Dw = -wn*Dd0/sqrt (1-z^2)*exp (-z*wn*t).*sin (wd*t); f = f0 + Dw/(2*pi);% Frequency in Hz
0 0.5 1 1.5 2 2.5 3 3.5 4
49.65 49.7 49.75 49.8 49.85 49.9 49.95 50 50.05
Time (sec)
F
re
q
u
e
n
c
y
(
H
z
)
subplot (2, 1, 1), plot (t, d), grid xlabel ('t, sec'), ylabel ('Delta, degree') hold on
subplot (2, 1, 2), plot (t, f), grid
xlabel ('t, sec'), ylabel ('Frequency (Hz)') hold on
end grid
References
[1] T. S. Borsche, T. Liu, and D. J. Hill. E_ects of rotational inertia on power system damping and frequency transients. To be presented at the 54th IEEE Conference on Decision and Control, 2015.
[2] P. Kundur. Power System Stability and Control. McGraw-Hill Inc., New York, 1994.
[3] G. Andersson. Lecture notes in Power System Analysis. EEH – Power System Laboratory, ETH Zurich, September 2013. [4] M. Gibbard, D. Vowles. Simpli_ed 14-generator model of the
south east australian power system. IEEE Task Force on Benchmark Systems for Stability Control, 2014.
[5] Ulbig, T. S. Borsche, and G. Andersson. Impact of low rotational inertia on power system stability and operation. In Proceedings of the 19th IFAC World Congress, pages 7290{7297, Cape Town, August 2014. B. Edward, Ed. [6] IEEE Power Engineering Society, Inter-Area Oscillations in
Power Systems, System Dynamic Performance Subcommittee Special Publication, 95TP101, 1995.
[7] IEEE Power Engineering Society, Voltage Stability Assessment: Concepts, Practices and Tools, Power System Stability Subcommittee Special Publication, SP101PSS, 2003. [8] N. Yorino, H. Sasaki, Y. Tamura, and R. Yokoyama, “A
generalized analysis method of auto-parametric resonances in power systems”, IEEE Trans. Power Syst., vol. 4, no. 3, pp. 1057–1064, Aug. 1989.
[9] T. Athey, R. Podmore, and S. Virmani, “A practical method for direct analysis of transient stability”, IEEE Trans. Power App. Syst., vol. PAS-98, pp. 573–584, 1979.
[10] N. Kakimoto, Y. Ohsawa, and M. Hayashi, “Transient stability analysis of electric power system via Luré type Lyapunov function”, Trans. IEE Jpn., vol. 98-E, no. 5/6, pp. 63–79, 1978.
[11] G. A. Maria, C. Tang, and J. Kim, “Hybrid transient stability analysis”, IEEE Trans. Power Syst., vol. 5, no. 2, pp. 384–393, May 1990.
[12] Y. Xue, L. Wehenkel, R. Belhomme, P. Rous-Seaux, M. Pavella, E.