Longitudinal Causal Inference of
Cognitive Function and Depressive
Symptoms in Elderly People
Ping Yao (1) , Can Meng (2)
OBJECTIVE: the association between depressive symptoms (Center for Epidemiologic Studies Depression Scale [CES-D]) and subsequent cognitive function (Mini-Mental State Examination [MMSE]) is equivocal in literature. To examine the causal relationship between them, we use longitudinal data on MMSE and CESD and causal inference to illustrate the relationship between two health outcomes.
METHOD: Data were obtained from the Hispanic Established Populations for Epidemiologic Studies of the Elderly. Participants included 3050 noninstitutionalized Mexican Americans aged 65 and older followed from 1993-2001. Cognitive function and depressive symptoms were assessed using the MMSE and CESD at baseline and at 2, 5, and 7 years of follow-up. Independent variables were sociodemographics, CESD, medical conditions. Marginal structural causal models were employed to evaluate the extent to which cognitive function depend not only on depressive symptoms measured at a single point in time but also on an individual’s entire depressive symptoms history.
DISCUSSION: our results indicate that if intervention to reduce 1 points of depressive symptoms were made at two years prior to assessing cognitive function, they would result in average improvement in cognitive function of 0.12, 95% CI [0.06, 0.18],P<.0001. Conclusion: The results suggest that depressive symptoms were significantly causally associated with cognitive impair.
Key words: Cognitive function; depressive symptoms; longitudinal studies; causality inference
Abbreviation: MSM(s), marginal structural model; CES-D, Center for Epidemiologic Studies Depression Scale; MMSE, Mini-Mental State Examination;
(1) Public Health and Health Education Program, Northern Illinois University
(2) Division of Statistics, Northern Illinois University
CORRESPONDING AUTHOR:Ping Yao, Public Health and Health Education Program, Northern Illinois University, Wirts Hall 260, School of Nursing and health Studies Dekalb, Illinois, 60115; email: [email protected]
DOI: 10.2427/11262
Accepted on July 11, 2015
INTRODUCTION
Depression is a common mental disorder in the United States that is often associated with morbidity, disability or even mortality. In 2012,
indicator to measure the well-being of the elderly. The prevalence of depressive symptoms was observed to have a positive association with age among people aged 65 or older; by genders, older females seemed to have higher rate of depression than older males; but the prevalence of depression seemed to be relatively stable among both genders over years [2].
In recent years, depressive symptoms, cognitive decline and the subsequent dementia are commonly prevalent among the aging population. Langa et al. [3] estimated that the prevalence of cognitive impairment was 8.7 percent among adults aged 70 or older. In a recent study, the rate of people aged 75 or over with mild cognitive impairment progressing to dementia was 35% [4]. Other studies reported that depression is commonly found in people with mild cognitive impairment and most dementias [5]; depression can increase the risk of developing dementia [6], especially for people with mild cognitive impairment [7].
Recent studies have documented an association between depressive symptoms and cognitive decline among older adults and their subgroups [8-13]. However, the causal relationship of depression and cognitive decline still remains unclear.
This paper aimed to study the causal association between depression symptoms and cognitive decline using longitudinal marginal structural causal models [14].
METHODS
Data and Sample
We employ data from the HEPESE. This dataset comprises four waves of follow-up: 1993-1994, 1995-1996, 1998-1999 and 2000-2001. The sample consists of 3050 Mexican-Americans at baseline, aged 65 years and older, residing in the five of the southwestern states of Arizona, California, Colorado, New Mexico, and Texas. Beginning with the second wave, some of the original subjects died or were lost to follow up and only 1683 subjects were interviewed at wave four [15].
Measure of cognitive functioning: MMSE
Cognitive status was assessed using Mini-Mental Examination (MMSE) score [16], ranging
from 0 to 30 points, with lower scores indicating impaired cognitive functioning.
Measure of depressive symptoms: CES-D
Depression is measured with the Center for Epidemiologic Studies Depression Scale (CES-D) [17]. The CES-D score consists of the sum of 20 individual items measured on a four-point frequency scale, with score ranging from 0-60. Sample items include “I felt depressed,” “I felt fearful,” “I felt lonely,” and “I felt sad,” among others. Possible responses for each item on this 4-point Likert scale were: 0= never/ none; 1= some/little; 2=occasionally/moderate; 3= most or all of time. Higher scores indicate greater level of depressive symptoms.
Demographic Variables
The demographic variables include age, sex, years of education, annual household income (three categories), marital status, and body mass index (BMI). Marital status was dichotomized as unmarried (consisting of separated, divorced widowed and never married people) and currently married, with married people as the reference group.
Number of Chronic Diseases
The number of chronic diseases was determined from seven items (cardiovascular disease, stroke, hypertension, diabetes, cancer, fractures and arthritis). The presence of disease was coded as “1” for “yes” or “0) for “no.” Possible scores for chronic diseases ranges from 0-7.
Models and Estimation
time-varying covariates by standard regression. The third model is marginal structure model (MSM), which estimates the causal association between CES-D and MMSE, adjusted by baseline variables and time-varying covariates through inverse probability weights.
In observation studies such as epidemiological research, marginal structure models (MSMs) are routinely employed to adjust for time-dependent confounding [14]. In this paper, we apply MSMs to estimate the causal effect of CES-D on the cognitive functioning of elderly population. In this study, outcomes and covariates of subjects were collected at baseline and then were followed for seven years. Thus these time-dependent covariates not only are independent predictor of cognitive functioning but also predict subsequent CES-D. These covariates also affected by baseline covariates and prior CES-D.
Notation of MSMs is borrowed from Robins et al. [14]. Let A0 denote observed CES-D and C0 denote other confounders from baseline. Let A1 and A2 be the CES-D at follow-up 1 and 2. Let L1 and L2 denote measured confounder that may be associated with A1 and A2. Let D1 and D2 indicate loss to up (censoring) at follow-up 1 and 2 (D=1 if censored and o otherwise).
MSMs were fit for CES-D at follow-up visit 1, and 2 on cognitive functioning at follow-up 3. The model predicts the expected outcomes, condition on baseline and follow-up visit 1, and 2 CES-D. The model yield the following form
E[YA1A2|X=x] = κ + β1A1 + β2A2 (1)
where YA1A2 is the cognitive functioning at follow-up 3 for an individual, and X denotes all other covariates at baseline and previous treatment. The variable YA1A2 is called “counterfactual outcomes”, as it is the outcomes that would have resulted had the exposure, CES-D at follow-up visit 1 and 2.
Calculating weights
In order to fit MSMs, inverse probability of treatment weighting (IPTW) is calculated, which is used to adjust for confounding by covariates and create a pseudopopulation in which the treatment and covariates are unassociated, therefore the outcomes and treatment are independent so that effect
estimates are unbiased. The weight is calculated by taking the inverse of the probability of the estimated probability of receiving the observed treatment, condition on history including baseline covariates and previous treatment. The unstandardized weight is:
Unstandardized weights cause large standard errors, so standardized weights are more widely used:
For binary treatment model, logistical regression was used to fit and estimate the probability of receiving treatment. For continuous treatment, conditional densities obtained from linear regression was used. In this study, CES-D score was continuous variable with normal distribution, so the predicted density function as weight was calculated for each subject. The overall weight for each subject is computed by taking the product of the weight at each time period.
Censoring and missing data occurred in longitudinal studies. In order to handle censoring, logistics regression is fit to estimate the weight of inverse-probability-of-censoring (IPCW). The overall censoring weight for each subject is computed by take the product of the weight at each time period.
The final weights are the product of IPTW and IPCW for each subject. SAS 9.4 was used to conduct all the data analysis (SAS Institute, Inc.).
RESULTS
females accounted for 57.6% of the sample. Table 2 illustrates the mean of CES-D score, MMSE and the number of subjects who were followed, died or dropped out at each wave. The mean CES-D score were 14.91, 14.30 and 15.46 at the baseline, first and second visit. The mean MMSE were 24.69, 23.92, 19.99 and 21.39 at the baseline, first, second and third visit. The mortality rates were 7.84%, 21.67%, 30.59%, in the first, second and third visit, respectively.
Table 3 shows baseline factors were associated with CES-D. Sex, education level, income and number of chronic disease were associated with CES-D. Subjects who were
male, unmarried, low income, and higher chronic disease had higher depression level.
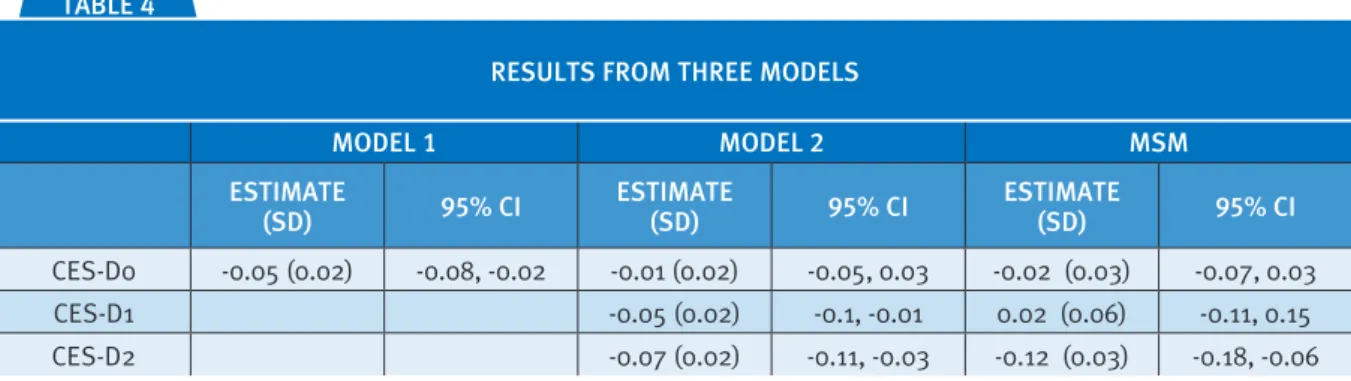
Table 4 presents the results analyzed by three different models.
The results of model I indicated that there is negative association between baseline CES-D and MMSE, which means that the higher depression at baseline was associated with lower cognitive scores at the visit III. The results from model II illustrated that all the CES-D from baseline, visit I and II had negative association with cognitive scores after adjusting all other baseline covariates. The results from marginal structural model (MSM) indicated that the causal TABLE 1
CHARACTERISTIC MEAN ± SD OR PROPORTION
CES-D score 14.91 ± 7.58
Age 73.07± 6.78
Chronic disease 1.93±0.93
Years of education 4.84± 3.89
Cognitive status 24.69±4.70
BMI 27.84±5.29
Sex: male 42.4%
female 57.6%
Income
$0-$4,999 14.24%
$5,000-$9,999 37.22%
$10,000-$14,999 21.40%
$15,000-$19,999 9.86%
>$20,000 17.28%
Marital Status 55.5%
BMI=body mass index; CES-D= Center of Epidemiological Studies Depression Scale; MMSE=Mini-Mental Examination Score; SD= standard deviation.
DESCRIPTIVE STATISTICS OF THE SUBJECTS AT BASELINE
TABLE 2
VISIT N DEATH MEAN OF MMSE % (CES-D≥16) MEAN(SD) OF CES-D
baseline 3050 0 24.69 36.71 14.91 (7.58)
I 2439 239 23.93 24.92 14.30 (5.85)
II 1981 661 19.99 33.92 15.46 (6.64)
III 1683 933 21.39 13.73 6.68 (7.33)
CES-D= Center of Epidemiological Studies Depression Scale; MMSE=Mini-Mental Examination Score
association between CES-D at baseline, visit I and II, and cognitive scores, which shows that the CES-D at visit II had the major negative causal association with cognitive scores.
DISCUSSION
In this study marginal structural model was conducted to analyze the causal relationship between depressive symptom and cognitive functioning in elderly Mexican American population. The results indicated that high levels of depressive symptoms caused cognitive function declining with controlling time-varying confounding factors such as chronic disease and body mass index.
Our results support previous researches that depression can predict subsequent cognitive decline [6, 10, 18-22], and are consistent with Raji et al. [13]’s finding in older Mexican Americans. Moreover, our findings confirm that there is a causal association from depression to cognitive decline in later life, which is similar to Bunce et al. [23]’ report. However, the relationship between cognitive function and depressive symptoms still remains inconsistent across studies. Han and colleges [24] found depression symptoms had a concurrent or temporary association with cognitive decline among older medical patients, which was against that depression symptoms were hypothesized as an independent risk factor for cognitive decline. Ganguli et al. [25] TABLE 3
VARIABLES PARAMETER ESTIMATE STANDARD ERROR P-VALUE
MMSE at baseline -0.27 0.05 <0.0001
Age -0.03 0.03 0.31
Chronic disease 1.43 0.16 <0.0001
Years of education -0.05 0.05 0.29
BMI -0.01 0.03 0.74
Sex: male 2.50 0.38 <0.0001
Marital Status: married -0.34 0.40 0.39
Income
$0-$4,999 2.30 0.66 0.0006
$5,000-$9,999 1.81 0.53 0.0008
$10,000-$14,999 1.29 0.59 0.02
$15,000-$19,999 -0.33 0.71 0.06
>$20,000 reference
BMI=body mass index; CES-D= Center of Epidemiological Studies Depression Scale; MMSE=Mini-Mental Examination Score
FACTORS ASSOCIATED WITH DEPRESSIVE SYMPTOM AT THE BASELINE BY LINEAR REGRESSION ANALYSIS
TABLE 4
MODEL 1 MODEL 2 MSM
ESTIMATE
(SD) 95% CI ESTIMATE (SD) 95% CI ESTIMATE (SD) 95% CI
CES-D0 -0.05 (0.02) -0.08, -0.02 -0.01 (0.02) -0.05, 0.03 -0.02 (0.03) -0.07, 0.03
CES-D1 -0.05 (0.02) -0.1, -0.01 0.02 (0.06) -0.11, 0.15
CES-D2 -0.07 (0.02) -0.11, -0.03 -0.12 (0.03) -0.18, -0.06
CES-D= Center of Epidemiological Studies Depression Scale; MMSE=Mini-Mental Examination Score; MSM=marginal structural model; SD=standard deviation; CI=confidence interval.
pointed out depressive symptoms probably cannot predict substantial cognitive decline although they were associated with cognitive impairment. Some papers even documented that cognitive decline preceded depressive symptoms and may predict depression [26-27]. One hypothesis that Jorm [28] stated to explain the association between depression and cognitive decline considered depression as a causal factor for dementia. A possible biological mechanism to support the causal relationship is called ‘glucocorticoid cascade’ hypothesized by Sapolsky [29], but the evidence is limited.
Cognitive functions decline with aging; but age-related decline in cognition are not similar across all older people. Some people still have good performance in cognitive function at their 70s or 80s; while others show signs of cognitive decline at their early 60s [30]. Salthouse [31] argued that age-related cognitive decline accelerated at older ages. Luboshitzky et al. [32] reported that people aged 65 to 70 years old had a mean MMSE score of 27.8, and those aged 85 to 90 years scored at 22.3 on average. In the same study, the percentage of abnormal MMSE scores (less than 24) increased gradually to 35.5% of people aged 85 to 90 years from 5.2% of those aged 65 to 70 years old. Another study found that a sample of elderly Europeans aged 74 to 79 years old had a mean MMSE score of 26.7, even though the prevalence of depression was high among in this sample [33]. However, Houx et al. [34] criticized MMSE and pointed out several drawbacks of using MMSE including ceiling effect and the possibility of direct learning effect. Moreover, MMSE aims to examine cognitive function of those who suffer from or at risk for dementia. In this case, MMSE may not be sensitive to the cognitive decline for the elderly who are not at risk of developing dementia. Other variables like SES (e.g., education) and social disengagement also affect cognitive function in later life [35-37].
Our study had several strengths. First, longitudinal design and repeated measurement of MMSE, CES-D and other covariates gave us the opportunities to explore the risk factors for
cognitive functioning over a period of seven years. Second, MSMs was used to improve causal interpretation of the estimate under the control of time-varying confounding. Most of previous studies [8-13] concluded the association between MMSE and CES-D either based on cross-section survey or longitudinal studies. The results from our study by MSMs were quite similar to those by traditional regression from the previous studies [8-13]. Our study confirmed the causal relationship between depressive symptom and cognitive functioning in elderly people.
There are three primary limitations of the current study. First, the high proportion of drop-outs and non-responses could have caused some degree of selection bias in this analysis. Analysis of time to drop-out indicated that the baseline and following wave depression scores increased the risk of drop-out, suggesting that we could have under estimated depression scores. Second, the CES-D score is not a form diagnosis of clinical depression, but actually is a scale designed to measure depressive symptomatology. Thus there is response bias to depressive symptom items compared with racially and ethnically diverse older people. The third limitation is that data for CES-D, MMSE, and other covariates were self-reported measures. This may have resulted in under or over estimates of the prevalence of depressive symptomatology and cognitive functioning.
Our results provide strong epidemiological support to better understand risk of high level of depressive symptoms for cognitive functioning in the elderly Mexican American population, which show that the necessary early intervention of depressive symptoms may help mitigate decline of cognitive functioning.
FUNDING: N/A
ACKNOWLEDGEMENTS: The authors thank Arlene
References.
[1] National Institute of Mental Health (NIMH). Major depression among adults. 2014. Retrieved from http:// www.nimh.nih.gov/statistics/1mdd_adult.shtml [2] Federal Interagency Forum on Aging-Related Statistics.
Older Americans 2012: key indicators of well-being. Washington, DC: Federal Interagency Forum on Aging-Related Statistics; 2012.
[3] Langa KM, Larson EB, Karlawish JH, et al. Trends in the prevalence and mortality of cognitive impairment in the United States: is there evidence of a compression of cog-nitive morbidity? Alzheimers Dement. 2008;4(2):134-144. [4] Palmer K, Wang HX, Backman L, Winblad B, Fratiglioni
L. Differential evolution of cognitive impairment in non-demented older persons: results from the Kungsholmen project. Am J Psychiat. 2002;159:436-442.
[5] Potter GG, Steffens DC. Contribution of depression to cognitive impairment and dementia in older adults. Neurologist. 2007;13:105-117.
[6] Wilson RS, Barnes LL, Mendes de Leon CF, et al. Depressive symptoms, cognitive decline, and risk of AD in older persons. Neurology. 2002;59:364-370. [7] Mordrego PJ, Ferrandez J. Depression in patients
with mild cognitive impairment increases the risk of developing dementia of Alzheimer type. Arch Neurol. 2004;61:1290-1293.
[8] Dotson VM, Resnick SM, Zonderman AB. Differential association of concurrent, baseline, and average depres-sive symptoms with cognitive decline in older adults. Am J Geriatr Psychiatry. 2008;16(4):318-330. [9] Paterniti S, Verdier-Taillefer M, Dufouil C, Alperovitch
A. Depressive symptoms and cognitive decline in elderly people: longitudinal study. British J Psychiat. 2002;181:406-410.
[10] Sachs-Ericsson N, Joiner T, Plant EA, Blazer DG. The influence of depression on cognitive decline in commu-nity-dwelling elderly persons. Am J Geriatr Psychiatry. 2005;13(5):402-408.
[11] Yaffe K, Blackwell T, Gore R, Sands L, Reus V, Browner WS. Depressive symptoms and cognitive decline in nondemented elderly women. Arch Gen Psychiatry. 1999;56:425-430.
[12] Cervilla JA, Prince M, Joels S, Mann A. Does depression predict cognitive outcome 9 to 12 years later? Evidence from a prospective study of elderly hypertensives. Psychol Med. 2000;30(5):1017-1023.
[13] Raji MA, Reyes-Ortiz CA, Kuo YF, Markides KS, Ottenbacher KJ. Depressive symptoms and cognitive change in older Mexican Americans. J Geriatr Psychiatry Neurol. 2007:20(3):145-152.
[14] Robins, J.M., Hernan, M.A., & Brumback, B. Marginal structural models and causal inference in epidemiology. Epidemiology. 2000;11(5):550-560.
[15] Keddie AM, Peek MK, Markides KS. Variation in the asso-ciations of education, occupation, income, and assets with functional limitations in older Mexican Americans. Ann Epidemiol. 2005;15:579-89.
[16] Tombaugh TN, McIntyre NJ. “The mini-mental State Examination: A comprehensive Review”. JAGS. 1992;40:922–935.
[17] Radloff LS. 1977. The CES-D Scale: a new self-report depression scale for research in the general population. Appl Psych Meas. 1977;1(3):385–401.
[18] Comijs H, Jonker C, Beekman ATF, Deeg DJH. The asso-ciation between depressive symptoms and cognitive decline in community-dwelling elderly persons. Int J Geriatr Psychiatry. 2001;16:361-367.
[19] Chodosh J, Kado D, Seeman TE, Karlamangla AS. Depressive symptoms as a predictor of cognitive decline: MacArthur studies of successful aging. Am. J. Geriatr. Psychiatry. 2007;15(5):406-415.
[20] Geerlings MI, Schoevers RA, Beekman ATF, et al. Depression and risk of cognitive decline and Alzheimer’s disease; results of two prospective community-based stud-ies in the Netherland. Brit J Psychiat. 2000;176:568-575. [21] Kobler S, Van Boxtel MPJ, Van Os J, et al. Depressive
symptoms and cognitive decline in community-dwelling older adults. J Am Geriatr Soc. 2010;58:873-879. [22] Wilson RS, Mendes de Leon CF, Bennett DA, Bienias JL,
Evans DA. Depressive symptoms and cognitive decline in a community population of older persons. J Neurol Neurosurg Psychiatry. 2004;75:126-129.
[23] Bunce D, Batterham PJ, Christensen H, Mackinnon AJ. 2014. Causal association between depression symptoms and cognition in a community-based cohort of older adults. Am J Geriatric Psychiatry. 2014;22(12):1583-1591. [24] Han L, McCusker J, Abrahamowicz M, Cole M, Capek
R. The temporal relationship between depression symptoms and cognitive functioning in older medical patients—prospective or concurrent? J Gerontology. 2006;12:1319- 1323.
[25] Ganguli M, Du Y, Dodge HH, Ratcliff GG, Chang CH. Depressive symptoms and cognitive decline in late life. Arch Gen Psychiatry. 2006;63:153-160.
[26] Vinkers DJ, Gussekloo J, Stek ML, Westendorp RGJ, Van der Mast RC. Temporal relation between depression and cognitive impairment in old age: prospective population based study. BMJ. 2004;329:881.
[27] Perrino T, Mason CA, Brown SC, Spokane A, Szapocznik J. Longitudinal relationships between cognitive functioning and depressive symptoms among Hispanic older adults. J Gerontal B Psychol Sci Soc Sci. 2008;63(5):309-317. [28] Jorm AF. Is depression a risk factor for dementia or
mecha-nisms of neuron death. Cambridge: MIT Press; 1992. [30] Glisky EL. Changes in cognitive function in human aging.
In D.R. Riddle, (Ed.). Brain aging: Models, methods, mech-anisms (pp. 1-15). Boca Raton, FL: CRC Press; 2007. [31] Salthouse TA. When does age-related cognitive decline
begin? Neurobiol Aging. 2008;30(4):507-514. [32] Luboshitzky R, Oberman AS, Kaufman N, Reichman
N, Flatau E. Prevalence of cognitive dysfunction and hypothyroidism in an elderly community population. Isr J Med Sci. 1996;32(1):60-65.
[33] Haller J, Weggemans RM, Ferry M, Guigoz Y. Mental health: minimental state examination and geriatric depres-sion score of elderly European in the SENECA study of 1993. Eur J Clin Nutr. 1996;50 Suppl 2:S112-116.
[34] Houx PJ, Shepher J, Blaue G-J, et al. Testing cognitive function in elderly populations: the PROSPER study. J Neurol Neurosurg Psychiatry. 2002;73:385-389. [35] Sheffield KM, Peek MK. Changes in the prevalence of
cognitive impairment among older Americans, 1993-2004: overall trends and differences by race/ethnicity. Am J Epidemiol. 2011;174(3):274-283.
[36] Bassuk SS, Glass TA, Berkman LF. Social disengagement and incident cognitive decline in community-dwelling elderly persons. Am Intern Med. 1999;131:165-173. [37] Cagney KA, Lauderdale D. Education, wealth, and