S
A J
ou
rn
al o
f I
nd
us
tria
l P
sy
ch
olo
gy
http://www.sajip.co.za Vol. 35 No. 1 Page SA Tydskrif vir Bedryfsielkunde
A
rtic
le #
73
1
Authors: Yolande Muller1
Sebastiaan Rothmann1
Affi liations:
1School of Behavioural
Sciences, North-West University, South Africa
Correspondence to: Sebastiaan Rothmann
e-mail:
Postal address: PO Box 8060, Swakopmund, Namibia, 9000
Keywords: well-being; comprehensibility; manageability;
meaningfulness; coherence
Dates:
Received: 12 July 2008 Accepted: 03 Mar. 2009 Published: 02 June 2009
How to cite this article: Muller, Y., & Rothmann, S. (2009). Sense of coherence and employees’
perceptions of helping and restraining factors in an organisation. SA Journal of Industrial Psychology/SA Tydskrif vir Bedryfsielkunde,
35(1), Art. #731, 10 pages. DOI: 10.4102/sajip.v35i1.731
This article is available at:
http://www.sajip.co.za
© 2009. The Authors. Licensee: OpenJournals Publishing. This work is licensed under the Creative Commons Attribution License.
89 1 of 10
ABSTRACT
The objectives of this study were to assess the construct validity and reliability of the 13-item version of the Orientation to Life Questionnaire (OLQ) and to investigate whether employees with a strong sense of coherence perceived helping and restraining factors in their organisation differently to those with a weak sense of coherence. A cross-sectional survey design was used. The total population (N = 2 678) of employees in a fi nancial institution in Gauteng participated in the study. The OLQ was administered and it showed acceptable reliability and construct validity. Individuals with high scores (n = 300) and those with low scores (n = 300) on sense of coherence differed regarding their perceptions of helping and restraining factors in their work and organisation.
S
ENSE
OF
COHERENCE
AND
EMPLOYEES
’
PERCEPTIONS
OF
HELPING
AND
RESTRAINING
FACTORS
IN
AN
ORGANISATION
INTRODUCTION
Modern businesses are highly competitive and demanding. Grobler, Warnich, Carrell, Elbert and Hatfi eld (2002) are of the opinion that there is no doubt that dramatic changes, in both the external and internal environments of companies during the past few decades in South Africa, have resulted in employees being faced with new and important challenges. If one considers how the psychological contract has changed in the private sector, from the encouragement of loyalty in exchange for a life-long job to one in which experience, remuneration and change is promised in exchange for innovation, it is apparent that values have changed. According to Guest (2004), advances in technology have led to the speeding up of the world of work. Speed and fl exibility of response form an important basis for a competitive advantage.
The environment in which employees fi nd themselves might impact on the work-related well-being of individuals, resulting in distress or eustress (Nelson & Simmons, 2003). Distress is defi ned as a negative psychological response to a stressor, as indicated by the presence of negative psychological states. Eustress refers to a positive psychological response to a stressor, as indicated by the presence of positive psychological states. Cooper, Dewe and O’Driscoll (2001) maintain that work-related well-being does not solely reside within the environment or the individual but is the result of a dynamic transaction between the constituting elements of the environment and the individual’s cognitive processes.
There is little doubt that the characteristics of individuals strongly determine whether events and circumstances will result in distress or eustress (Cooper et al., 2001; Semmer, 2003). These characteristics are not specifi c coping styles, but rather characteristics that affect how individuals perceive situations and co-determine coping behaviour (Semmer, 2003). Such characteristics involve beliefs regarding the world and an individual’s relationship with it, including possibilities of dealing with it. Semmer (2003) regards characteristics such as a sense of coherence (Antonovsky, 1987) and hardiness (Kobasa, 1979) as broad variables, while locus of control (Rotter, 1966) and self-effi cacy (Bandura, 1989) are regarded as specifi c variables. This study focuses on sense of coherence as a broad characteristic that infl uences an individual’s perceptions and coping behaviour.
Sense of coherence is a broad-band resource (Antonovsky, 1987; Hobfoll, 2001; Semmer, 2003) that is positively associated with coping with stress (Antonovsky, 1991). Antonovsky (1987, p. 19) defi nes sense of coherence as a global orientation expressing a person’s pervasive and enduring feeling of confi dence: (a) that the stimuli deriving from one’s internal and external environments in the course of living are structured, predictable and explicable (comprehensibility); (b) that the resources are available to one to meet the demands posed by these stimuli (manageability), and (c) that these demands are challenges worthy of investment and engagement (meaningfulness).
An individual’s sense of coherence may either alleviate or aggravate reactions to a stressor and moderate the impact of occupational stressors on the individual’s affective outcomes. This means that the impact of stressful experiences would vary for individuals with a strong and a weak sense of coherence (Bolger & Zuckerman, 1995; Cooper et al., 2001) due to differences in their perception of the comprehensibility, manageability and meaningfulness of stimuli from the environment.
An individual’s level of sense of coherence might affect the way he or she perceives factors contributing to distress and eustress at work (Amirkhan & Greaves, 2003; Nelson & Simmons, 2003). The holistic model of well-being (Nelson & Simmons, 2003) and the job demands-resources model (Demerouti, Bakker, Nachreiner & Schaufeli, 2001) predict that job demands and a lack of job resources will lead to distress, while job resources will lead to eustress. The notion of demands and resources can be linked to the theory of Lewin (1947), which states that the status quo in a situation is the result of the interaction between helping and restraining forces. In line with the theory of Lewin (1947) the factors contributing to distress and a lack of eustress can be regarded as restraining forces, while the factors contributing to lower distress and higher eustress can be regarded as helping factors.
S
A J
ou
rn
al o
f I
nd
us
tri
al P
sy
ch
ol
og
y
A
rti
cl
e
#7
31
Therefore their experience of helping and restraining factors might differ from the experience of individuals with a weak sense of coherence. Research shows that those employees with a strong and those with a weak sense of coherence indeed perceive different factors in their work as helping or restraining them, thus further research would present more evidence supporting the validity and usefulness of the sense of coherence construct in organisations. Furthermore, knowledge of the levels of sense of coherence of employees and how individuals with a strong versus a weak sense of coherence view helping and restraining factors in their work could assist psychologists and managers in making human resource decisions. For example, interventions could be implemented to reduce employees’ levels of distress and increase their levels of eustress (see Rothmann, 2001; Strümpfer, 1990). Therefore, the first research problem is that it is unclear how those employees with a weak and those with a strong sense of coherence will differ regarding their perceptions of helping and restraining factors in their work.
Studying the relationships between sense of coherence and perceptions of helping and restraining factors presupposes that the measuring instrument that is used to measure sense of coherence is valid and reliable.
Antonovsky (1979) developed the 29-item Orientation to Life Questionnaire (OLQ) to measure the three dimensions of sense of coherence. Although the 29-item OLQ seems to be internally consistent (see Rothmann, 2001), studies have failed to confirm the factorial validity of the OLQ and the hypothesised three-factor structure (see Van Schalkwyk & Rothmann, 2008). As an alternative, a 13-item OLQ was developed, the items of which seem to have more acceptable psychometric properties. Van Schalkwyk and Rothmann (2008) found acceptable psychometric properties for the 13-item OLQ but did show that some of the items were problematic. Therefore the second research problem is that, in South African circumstances, information is needed regarding the construct validity and internal consistency of the 13-item OLQ.
The objectives of this study were to validate the 13-item version of the OLQ (Antonovsky, 1987) and to investigate whether employees with a strong sense of coherence perceive helping and restraining factors in their work that differ from those experienced by individuals with a weak sense of coherence.
Definition and measurement of sense of
coherence
The definition of sense of coherence includes three components that represent the concept, namely comprehensibility, manageability and meaningfulness (Antonovsky, 1987). Comprehensibility refers to the extent to which one perceives stimuli from the external and internal environments as information that is ordered, structured and consistent. The stimuli are perceived to be comprehensible and make sense at a cognitive level (cognitive component). Manageabilityrefers to the extent to which individuals experience events in life as situations that are endurable or manageable, or even as a new challenge (instrumental component). Meaningfulness refers to the extent to which one feels that life is making sense at an emotional and not simply a cognitive level (motivational component).
The OLQ was developed to measure sense of coherence (Antonovsky 1987). Each item of the OLQ was designed to measure one of the components of the sense of coherence concept. Therefore scores on each component could be computed. However, Antonovsky (1993) warns against the use of the subscales of the OLQ. One of the reasons for this is that the three components are never found when multivariate techniques are used to analyse the structure of the questionnaire. It seems that there is a lack of empirical evidence to support the theoretical three-factor structure (Larsson & Kallenberg, 1999). Antonovsky (1987, 1993) and Sullivan (1993) state that,
although the components of meaningfulness, comprehensibility and manageability are conceptually distinguishable from one another, they are interrelated, since they form part of a unitary construct, namely sense of coherence. Although there may be individual variations on the configuration of these components and their relative contributions to the overall sense of coherence, it is not anticipated that the three components will function independently or that one dimension is causally linked to the other dimensions.
Kalimo, Pahkin and Mutanen (2002) reported acceptable construct validity and internal consistency for the 13-item OLQ. The results of Kalimo et al. (2002) showed that a one-factor structure best fitted the data. An alpha coefficient of 0.84 was found for the OLQ. Fourie, Rothmann and Van de Vijver (2008) found that sense of coherence is best represented by one factor, although one problematic item was removed from the questionnaire. They reported an alpha coefficient of 0.93 for the OLQ. Van Schalkwyk and Rothmann (2008) evaluated the psychometric properties of the 13-item OLQ. They removed two problematic items from the questionnaire, but found that a one-factor structure best fitted the data.
Hypothesis 1: Sense of coherence as measured by the 13-item OLQ has a one-factor structure and this factor shows it is reliable.
The role of sense of coherence in the work
context
Sense of coherence is a dynamic aspect of the personality that is formed throughout childhood and adolescence, and can be viewed as a stable dispositional orientation. It is believed to be a construct that is universally meaningful, cutting across lines of gender, social class, region and culture (Strümpfer, 1990). Sense of coherence is a worldwide view in which people expect that things will work out and that life is understandable, manageable and meaningful, and it indicates an individual’s general orientation to life.
Studies have shown that sense of coherence is positively related to job satisfaction (Rothmann, 2001; Strümpfer, Danana, Gouws & Viviers, 1998); work engagement (Fourie et al., 2008; Rothmann, Steyn & Mostert 2005); competence and life satisfaction (Kalimo & Vuori, 1990); general well-being (Feldt, 1997), and active coping with stressors (Redelinghuys & Rothmann, 2005). Sense of coherence is negatively related to burnout (Fourie et al., 2008; Rothmann et al., 2005), measures of negative affectivity such as anxiety and neuroticism (Flannery & Flannery, 1990; Frenz, Carey & Jorgenson, 1993), and depression and job stress (Feldt, 1997).
There are various ways in which sense of coherence can affect individuals. Firstly, sense of coherence affects the coping strategies individuals choose (Antonovsky, 1987). A person with a strong sense of coherence tends to select the particular coping strategy that seems most appropriate for dealing with the stressor he/she is being confronted with (Antonovsky, 1987). Secondly, individuals with a strong sense of coherence tend to accept setbacks and failures as normal and neither necessarily indicative of their incompetence nor indicative of a hostile world (Semmer, 2003). Through the dimensions of comprehensibility and meaningfulness they put negative experiences into perspective, interpret them as part of a larger picture and as having meaning beyond the present situation. Thirdly, sense of coherence affects the probability of individuals exploiting potential resources (Antonovsky, 1987). Individuals with a strong sense of coherence see themselves as capable of influencing life (because they experience life events as manageable) and perceive events as challenges rather than threats (because they experience life as meaningful).
http://www.sajip.co.za Vol. 35 No. 1 Page SA Tydskrif vir Bedryfsielkunde
S
A J
ou
rn
al o
f I
nd
us
tria
l P
sy
ch
olo
gy
A
rtic
le
#7
31
91
3 of 10 and Greaves (2003), namely that a person with a strong sense of
coherence tends to see things differently to individuals with a weak sense of coherence. Amirkhan and Greaves (2003) studied three mechanisms that could underlie the health-promoting benefits of sense of coherence, namely (a) perceptual, (b) cognitive and (c) behavioural mechanisms. They found that a strong sense of coherence impacts on perception – such that individuals with a strong orientation are likely to view more life events as having coherence. This perceptual process seems to be subtle: it influences individuals’ perceptions of stressful events, but it does so without their conscious awareness. Evidence was also obtained of a behavioural influence: individuals with a strong sense of coherence used more instrumental and fewer avoidant responses to cope with stressors in their lives (Amirkhan & Greaves, 2003). Sense of coherence does not appear to influence individuals’ attributions, that is, individuals with a strong sense of coherence (when compared with those with a weak sense of coherence) did not make different attributions.
A study by Feldt, Kivimäki, Rantala and Tolvanen (2004) focused on sense of coherence as a predictor of perceived job characteristics. Feldt et al. (2004) argued that if sense of coherence is indeed a stable personality construct in adulthood, it is better viewed as a predictor of perceptions at work than as an outcome of such perceptions. An individual with a strong sense of coherence tends to experience environmental stimuli in a manner sufficiently structured to enable him or her to anticipate events and the resources required to meet the demands imposed on him or her. Such experiences are likely to lead to favourable perceptions of a person’s influence at work and of his or her receiving support from supervisors and colleagues. In a longitudinal study Feldt et al. (2004) showed that sense of coherence influences the ability to mobilise and generate social resources in the workplace but not the ability to produce job control. In a study of non-professional counsellors in South Africa Fourie et al. (2008) found that sense of coherence has a significant effect on how individuals perceive the demands and resources in their work. However, a cross-sectional design was used in their study, which makes it difficult to prove the causality of relationships.
Based on previous research findings that were reported here, it might be expected that employees with a weak sense of coherence will perceive that it is difficult to mobilise and generate resources, including money, supporting relationships with colleagues and supervisors, and even having a job. Extrinsic resources might be perceived as helping factors. They might perceive work as stressful and tend to disengage from it. In contrast, employees with a strong sense of coherence might perceive that they can mobilise resources, such as money (salary), and good relationships with colleagues and supervisors. These resources might restrain them if they do not exist, or when they exist in low quantities, but they may not be helping them. In fact, employees with a strong sense of coherence might find the intrinsic nature of the work they are doing to be engaging and satisfying to them. It is not expected that sense of coherence would make a difference regarding perceptions of overload of employees, because it does not seem to influence the ability to produce job control.
Hypothesis 2: Employees with a strong and weak sense of coherence respectively will experience helping and restraining factors in their work and organisation differently.
RESEARCH DESIGN
Research approach
A cross-sectional survey design was utilised to reach the study objectives, whereby a sample is drawn from a population at a given point in time (Shaughnessy & Zechmeister, 1997).
Research method
Sample and sampling procedure
The participants were employees from a financial institution in the Gauteng Province (N = 2 678).
This study consisted of two phases. In phase 1 the construct validity and internal consistency of the OLQ was investigated for the total population of employees in the financial institution (N = 2 678). The characteristics of the participants are displayed in Table 1.
As can be seen from Table 1, 59.9% of the participants were female, 52.1% of the participants were married, and 44.9% were aged between ages 30 and 39 years, while 47.7% were English speaking (47.7%). Grade 12 was the highest qualification of 50% of the participants, while 34.1% of the participants were in possession of a 3–4 year degree or diploma.
In phase 2 the OLQ scores of the 2 678 participants were compared with a South African norm and expressed as sten scores (Rothmann, 2008). Sten scores of 1, 2 and 3 were regarded
TABLE 1
Demographic characteristics of the participants
Item Category FrequenCy PerCentage
Gender Male 1074 40.1
Female 1604 59.9
Marital
status Single 1050 39.2
Engaged 54 2.0
Married 1395 52.1
Divorced 145 5.4
Widow 29 1.1
Widower 5 0.2
Language Afrikaans 1054 39.4
English 1278 47.7
Sepedi 61 2.3
Sesotho 40 1.5
Setswana 64 2.4
isiSwati 9 0.3
Tshivenda 8 0.3
isiZulu 83 3.1
isiNdebele 5 0.2
isiXhosa 53 2.0
Xitsonga 10 0.4
Other 13 0.5
Education Grade 8 – Grade 11 190 7.1
Grade 12 1339 50.0
3–4 year degree/diploma 913 34.1
5–7 year degree 96 3.6
Masters degree 74 2.8
Doctors degree 3 0.1
Technical College
qualification 63 2.4
Age
category 19–29 years 730 27.3
30–39 years 1208 44.9
40–49 years 551 20.7
50–59 years 159 6
S
A J
ou
rn
al o
f I
nd
us
tri
al P
sy
ch
ol
og
y
A
rti
cl
e
#7
31
as low (indicating a weak sense of coherence), scores of 4, 5, 6 and 7 were regarded as average, while scores of 8, 9 and 10 were regarded as high (indicating a strong sense of coherence). The results showed that 386 participants (14.4%) obtained low sten scores, 867 (32.4%) obtained average sten scores, and 1 425 (53.2%) obtained high sten scores. Consequently, random samples of 300 employees with low sten scores and 300 employees with high sten scores were taken from the total population.
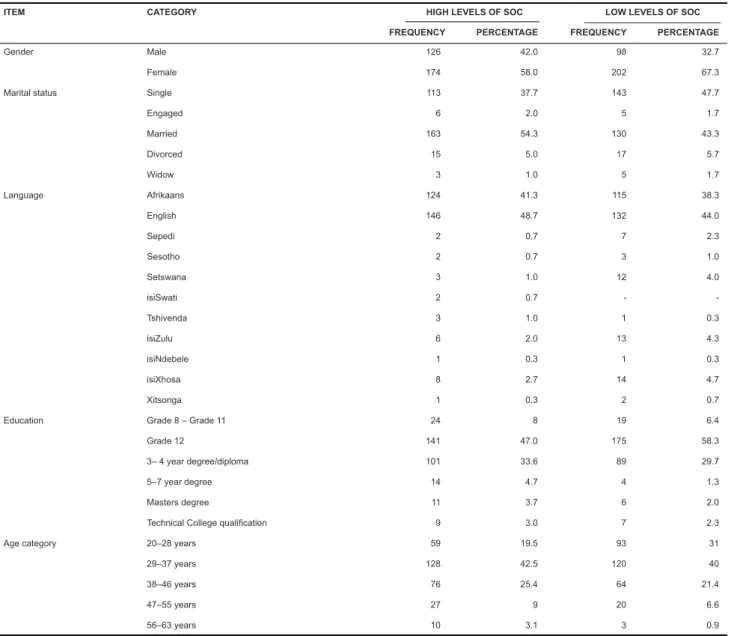
Table 2 shows the descriptive statistics of participants with high and low sten scores on the OLQ. As can be seen from Table 2, in both samples, females constituted the largest percentage of the sample. Most of the participants in both samples were between ages 29 and 37 years and spoke English, and most of the individuals had a Grade 12 qualification. Most of the individuals in the sample with high sten scores were married (54.3%), while most of the individuals in the sample with low sten scores were single (47.7%).
Measuring instruments
The Orientation to Life Questionnaire (Antonovsky, 1987) and a biographical questionnaire were used to reach the objectives set for this study.
The Orientation to Life Questionnaire (Antonovsky, 1987) was used to measure the construct sense of coherence. For purposes of this study the 13-item short form of the OLQ was used. The 13-item version of the OLQ includes four items measuring meaningfulness (e.g. ‘How often do you have a feeling that there is little meaning in the things you do in your daily life?’), five items measuring comprehensibility (e.g. ‘Do you have the feeling that you are in an unfamiliar situation and do not know what to do?’) and four items measuring manageability (e.g. ‘Has it ever happened that people you counted on disappointed you?’). Answers had to be given on a seven-point Likert scale on which the extreme answers (e.g. 1 = never and 7 = always) were formulated for each question. Antonovsky (1993) reported alpha coefficients of the OLQ in 29 research studies varying between 0.85 and 0.91. Van Schalkwyk and Rothmann (2008) found an alpha coefficient of 0.75 for an 11-item OLQ, while Fourie, Rothmann and Van de Vijver (2008) reported an alpha coefficient of 0.93 for a 12-item OLQ. High inter-correlations between the three components of meaningfulness, comprehensibility and manageability have been found in previous studies (Flannery & Flannery, 1990; Kravets, Drory & Florian, 1993).
A biographical questionnaire was used to gather information concerning the demographic characteristics of the participants,
taBLe 2
Demographic characteristics of the participants with high and low levels of sense of coherence
Item Category HIgH LeveLs oF soC Low LeveLs oF soC FrequenCy PerCentage FrequenCy PerCentage
Gender Male 126 42.0 98 32.7
Female 174 58.0 202 67.3
Marital status Single 113 37.7 143 47.7
Engaged 6 2.0 5 1.7
Married 163 54.3 130 43.3
Divorced 15 5.0 17 5.7
Widow 3 1.0 5 1.7
Language Afrikaans 124 41.3 115 38.3
English 146 48.7 132 44.0
Sepedi 2 0.7 7 2.3
Sesotho 2 0.7 3 1.0
Setswana 3 1.0 12 4.0
isiSwati 2 0.7 -
-Tshivenda 3 1.0 1 0.3
isiZulu 6 2.0 13 4.3
isiNdebele 1 0.3 1 0.3
isiXhosa 8 2.7 14 4.7
Xitsonga 1 0.3 2 0.7
Education Grade 8 – Grade 11 24 8 19 6.4
Grade 12 141 47.0 175 58.3
3– 4 year degree/diploma 101 33.6 89 29.7
5–7 year degree 14 4.7 4 1.3
Masters degree 11 3.7 6 2.0
Technical College qualification 9 3.0 7 2.3
Age category 20–28 years 59 19.5 93 31
29–37 years 128 42.5 120 40
38–46 years 76 25.4 64 21.4
47–55 years 27 9 20 6.6
http://www.sajip.co.za Vol. 35 No. 1 Page SA Tydskrif vir Bedryfsielkunde
S
A J
ou
rn
al o
f I
nd
us
tria
l P
sy
ch
olo
gy
A
rtic
le
#7
31
93
5 of 10 including gender, age, language, race, level of qualification and
job title. Furthermore, two open-ended questions directed at identifying the most important helping and restraining factors in the work environment were included. The helping factors were measured by means of the following question: ‘What factors are helping you to be motivated and effective in your current job and organisation?’ The restraining factors were measured by means of the following question: ‘What factors are preventing you from being motivated and effective in your current job and organisation?’
Research procedure
Participation was voluntary, and the measuring battery was administered and completed electronically on a website on the employees’ personal computers.
Data analysis
The statistical analysis was carried out by means of the SPSS programme (SSPS, 2003) and the AMOS programme (Arbuckle, 2003). Cronbach alpha coefficients were used to assess the reliability (i.e. internal consistency) of the measuring instrument (Clark & Watson, 1995). Descriptive statistics (e.g. means and standard deviation) were used to analyse the data.
Structural equation modelling (SEM) as implemented in AMOS (Arbuckle, 1997) was used to test the factorial models for the OLQ. Hypothesised relationships were tested empirically for goodness-of-fit with sample data (Byrne, 2001). Among the fit indices produced by the AMOS programme is the Chi-square (χ2) statistic – the test of absolute fit of the model. However,
the χ2 value is sensitive to sample size. Therefore additional
goodness-of-fit indices were used in this study, such as the χ2/
degrees of freedom ratio (CMIN/df) (Wheaton, Muthen, Alwin & Summers, 1977), the Goodness-of=Fit Index (GFI), the Adjusted Goodness-of-Fit index (AGFI), the Normed Fit Index (NFI), the Comparative Fit Index (CFI), the Tucker-Lewis Index (TLI) and the Root Means Square Error of Approximation (RMSEA).
Content analysis was used to define and categorise all written replies to the two questions and to eliminate redundant data. This was done separately for the helping and restraining factors identified by individuals with a strong sense of coherence and those with a weak sense of coherence. Themes were the units of analysis in this study. Once the themes had been identified, the frequencies of themes in the low and high sense of coherence groups were determined. Ranks were given to the themes based on their frequencies starting with a rank of ‘1’ for the theme with the highest frequency. Ties were computed when the frequencies of themes were equal. Spearman rank correlations (rs) were used to assess the relationship between helping factors as identified by employees with a strong versus a weak sense of coherence, as well as the relationship between restraining factors as identified by individuals in the high and low groups. Spearman correlations are applicable to ranked data (Tredoux & Durrheim, 2002).
RESULTS
Construct validity and reliability of the 13-item
OLQ
SEM methods, as implemented by AMOS (Arbuckle, 1997), were used to test the factorial model for the OLQ. Before performing SEM, the frequency distribution of the items of the OLQ was checked in order to assess deviations from normality, and multivariate outliers were removed. It was assumed that the χ2 goodness-of-fit statistics are not likely to be inflated if
the skewness and kurtosis for individual items do not exceed the critical values of 2.00 and 7.00 respectively (West, Finch & Curran, 1995).
Data analyses proceeded as follows: Firstly, a quick overview of model fit was done by looking at the overall χ2 value together with
its degrees of freedom and probability value. Global assessments of model fit were based on several goodness-of-fit statistics (GFI, AGFI, PGFI, NFI, TLI, CFI and RMSEA). Secondly, given findings of an ill-fitting initially hypothesised model, analyses proceeded in an exploratory mode. Possible misspecifications as suggested by the modification indices were looked for, and a revised, respecified model was fitted to the data.
Hypothesised model
Prior to testing the 1-factor model of sense of coherence, a 3-factor model (labelled Model 1) was tested. Model 1 was based on Antonovsky’s (1987) three components of the sense of coherence concept, namely comprehensibility, manageability and meaningfulness. However, the solution was not admissible, which indicates that some variance estimates were negative. This suggests that the model is wrong.
Following the above-mentioned procedure, the full hypothesised 1-factor model (labelled Model 2) consisting of all 13 items (assuming to constitute the sense of coherence construct) was tested. Model 2 consisted of five items that measured comprehensibility, four items that measured manageability, and 4 items that measured meaningfulness. It was assumed that the errors of items are uncorrelated. The model was over-identified: It had 91 distinct sample moments, 26 distinct parameters to be estimated, and 65 degrees of freedom. Table 3 presents fit statistics for Model 2.
The statistically significant χ2 value of 2410.09 (df = 65; p <
0.01) revealed a poor overall fit of Model 2. However, both the sensitivity of the likelihood ratio test to sample size and its basis on the central χ2 distribution, which assumes that the model
fits perfectly in the population, have been reported to lead to problems of fit. Jöreskog and Sorbom (1993) point out that the use of χ2 is based on the assumption that the model holds exactly in
the population, which is a stringent assumption. A consequence of this assumption is that models that hold approximately in the population will be rejected in a large sample. Furthermore,
TABLE 3
Goodness-of-fit statistics of the models
χ² χ² /df gFI agFI nFI tLI CFI rmsea
Model 2 2410.09 37.08 0.88 0.83 0.77 0.73 0.77 0.12
Model 3 1133.04 17.70 0.94 0.91 0.89 0.88 0.90 0.08
Model 4 897.41 14.25 0.95 0.93 0.91 0.90 0.92 0.07
TABLE 4
Descriptive statistics and Cronbach’s alpha coeffient of the 13-iterm OLQ
Item n mean sD skewness kurtosIs α
S
A J
ou
rn
al o
f I
nd
us
tri
al P
sy
ch
ol
og
y
A
rti
cl
e
#7
31
the hypothesised model (Model 1) was also not that good, seen from a practical perspective. The NFI, TLI and CFI values lower than 0.90 and RMSEA values higher than 0.08 are indicative of failure to confirm the hypothesised model. Thus it was apparent that some modification in specification was needed in order to determine a model that better represents the sample data.
Post hoc analyses
Given rejection to the initially hypothesised 1-factor model, the focus shifted from model testing to model development (exploratory factor analysis). Modification indexes (MI) were considered to pinpoint areas of misspecification in the model. The constrained parameters exhibiting the highest degree of misfit lay in the error covariance matrix and represented a correlated error between item 5 and item 6 (MI = 1051.60). When compared with MI values for all other error covariance parameters, it was found that this value was exceptionally high and clearly in need of re-specification. Based on the modification index and on theoretical considerations, Model 2 was re-specified, with these parameters freely estimated. The errors of OLQ5 and OLQ6 were allowed to correlate. This model was labelled as Model 3. Table 3 summarises the goodness-of-fit statistics of Model 3.
The fit statistics in Table 3 indicate an improved fit for the re-specified model. Although the χ2 value of 1 133.04 (df = 64; p < =
0.01) was still high, it was considerably lower than in Model 1. All the other fit statistics indicated a better fit of the measurement model to the data (∆χ2 =. 1 277.05, ∆df = 1, p < 0.01). However,
the fit statistics were still not acceptable and further modification in specification was needed to determine a model that better represents the sample data.
Inspection of the modification indices showed that a high degree of misfit was caused by a correlated error between item 9 and item 12 (MI = 226.46). When compared with MI values for all other error covariance parameters, it was found that this value was high and in need of re-specification. Based on the modification index and on theoretical considerations, Model 3 was re-specified, allowing the errors of OLQ5 and OLQ6 to correlate. This model was labelled as Model 4. Table 3 summarises the goodness-of-fit statistics of Model 4.
The fit statistics in Table 3 indicate an improved fit for the re-specified model. Although the χ2 value of 897.41 (df = 63; p <
0.01) is still high, it was statistically significantly lower than the value for Model 3 (∆χ2 = 205.63, ∆df = 1, p < 0.01). The other fit
statistics (CFI < 0.90) indicated acceptable fit of the model to the data, although the RMSEA (0.07) indicated a mediocre fit. No further modifications of the model were deemed necessary.
TABLE 5
Perceptions of helping and restraining factors of employees with high and low scores on sense of coherence (SOC)
High soC Low soC Frequency rank FrequenCy rank
HeLPIng FaCtors
Having a challenging job
1. 65 1 21 7
Being satisfied and passionate about the job
2. 50 2 0
-Colleagues’ support and cooperation
3. 50 3 18 10
Reaching goals and being performance driven
4. 36 4 30 3
Obtaining knowledge - training and development
5. 30 5 23 6
Being able to render support to others and delivering a high-quality service
6. 26 6 0
-Managerial style and skills
7. 25 7.5 0
-Relationships among colleagues, management and workers
8. 25 7.5 20 8
Monetary reward (monthly salary)
9. 23 9 46 1
Being self-driven/self-motivated
10. 22 10 19 9
Gratitude; being thankful for having a job
11. 0 - 27 4
Good team work among colleagues
12. 0 - 25 5
Receiving support and motivation from management
13. 0 - 38 2
restraInIng FaCtors
Work overload and long working hours
1. 30 1 35 2
Workforce being unskilled and having no knowledge of product selling
2. 27 2 13 9.5
Monetary reward (salary) insufficient
3. 26 3 43 1
Managerial style being autocratic
4. 21 4 30 3.5
Unnecessary administrative tasks and meetings (not using time optimally)
5. 21 5 0
-Company bureaucracy/red tape/company culture
6. 18 6 0
-No training, exposure or possible career progression
7. 17 7 18 7
No recognition and appreciation from management, colleagues and clients
8. 16 8 27 5
Mistrust among colleagues (working environment)
9. 16 9 15 8
No assistance and support from management and colleagues
10. 14 10 0
-Quality relationship between management and workers and among colleagues
11. 0 - 30 3.5
Stress and pressure in the workplace
12. 0 - 24 6
Experiencing uncertainty regarding the future of the company
http://www.sajip.co.za Vol. 35 No. 1 Page SA Tydskrif vir Bedryfsielkunde
S
A J
ou
rn
al o
f I
nd
us
tria
l P
sy
ch
olo
gy
A
rtic
le
#7
31
95
7 of 10 Table 4 reveals that an acceptable alpha coefficient (α = 0.85) was
obtained for the 13-item OLQ (Nunnally & Bernstein, 1994). It is evident from Table 4 that the scores on the OLQ were relatively normally distributed, with low skewness and kurtosis. Based on the above-mentioned findings, Hypothesis 1 was accepted.
Themes and Spearman correlations
Next, the themes mentioned by participants with a strong sense of coherence (n = 300) and a weak sense of coherence (n
= 300) were analysed. The themes were classified separately for employees with a strong sense of coherence (sten ≥ 8; Mean = 9.27; SD = 0.82) and employees with a weak sense of coherence (sten ≤ 3, Mean = 1.97; SD = 0.80). The alpha coefficient of the OLQ for employees with a strong sense of coherence was 0.83, and the alpha coefficient of the OLQ for employees with a weak sense of coherence was 0.85. These coefficients indicate acceptable reliability of the scores of participants.
Table 5 indicates the identified helping and restraining factors perceived by employees with a high score on sense of coherence and those with a low score. The themes are ranked (with ‘1’ as the most frequently mentioned theme and ‘10’ as the least frequently mentioned theme).
Table 5 reveals that the first most frequently mentioned helping factor by employees with a strong sense of coherence was a challenging job (rank = 1), while being satisfied with and passionate about the job was the second most frequently mentioned helping factor (rank = 2). In comparison, employees with a weak sense of coherence mentioned monetary rewards most frequently (rank = 1), while receiving support and motivation from top management was the second most frequently mentioned (rank = 2).
Helping factors mentioned only by employees with a strong sense of coherence include being satisfied with and passionate about the job (rank = 2), being able to render support to others (rank = 6), and managerial style and skills (rank = 7.5). Helping factors mentioned only by employees with a weak sense of coherence include receiving support from management (rank = 2), being thankful for having a job (rank = 4), and good teamwork among colleagues (rank = 5).
Table 5 reveals that the first most frequent restraining factor mentioned by employees with a strong sense of coherence was work overload and long working hours (rank = 1), while a lack of skills of the workforce was the second most frequently mentioned restraining factor (rank = 2). In comparison, employees with a weak sense of coherence mentioned monetary rewards most frequently (rank = 1), while they mentioned work overload and long working hours second most frequently (rank = 2).
Restraining factors mentioned only by employees with a strong sense of coherence, include unnecessary administrative tasks and meetings (rank = 5), company bureaucracy and company culture (rank = 6), and no assistance and support from management and colleagues (rank = 10). Restraining factors mentioned only by employees with a weak sense of coherence include poor quality relationships between management and workers and among colleagues (rank = 3.5), stress and pressure in the workplace (rank = 6), and experiencing uncertainty regarding the future of the company (rank = 9.5).
The ranks of the following helping factors were similar for those employees with a strong and those with a weak sense of coherence: reaching goals and being performance driven; training and development; relationships among management, colleagues and workers; and being self-driven. The ranks of the following restraining factors were similar for employees with a strong and a weak sense of coherence: autocratic managerial style, lack of training and career progression, and mistrust among colleagues.
Next, Spearman correlation coefficients were computed between the helping factors identified by those individuals with a strong
and those with a weak sense of coherence, as well as between the restraining factors as perceived by these two groups. No statistically significant correlation was found between the helping factors as perceived by individuals with a strong versus a weak sense of coherence (rs= –0.15, p = 0.60). Furthermore, no statistically significant correlation was found between the restraining factors as perceived by individuals with a strong versus a weak sense of coherence (rs = 0.20, p = 0.50). This finding provides support for Hypothesis 2.
DISCUSSION
The objectives of this study were to validate the 13-item version of the OLQ (Antonovsky, 1987) and to investigate whether employees with a strong sense of coherence perceived helping and restraining factors in their organisation differently from employees with a weak sense of coherence. The results obtained using structural equation modelling supported a one-factor structure for sense of coherence amongst employees in a financial institution. It can be concluded that the 13-item version of the OLQ shows construct validity and is a reliable measuring instrument. No statistically significant correlation coefficients were found between either helping or restraining factors reported by employees with a strong versus a weak sense of coherence. It seems that employees with respectively a strong and a weak sense of coherence experience helping and restraining factors differently.
The results showed that a three-factor model for the OLQ did not fit the data. A one-factor model did indeed fit the data and the fit was improved when some error terms were allowed to correlate. This finding supports the idea of Antonovsky (1987), namely that the three components of sense of coherence, namely comprehensibility, manageability, and meaningfulness are only conceptually distinguishable and that these components form part of one unitary construct. This finding is also in line with the findings of Larsson and Kallenberg (1999) and Van Schalkwyk and Rothmann (2008).
Error terms within subscales were also allowed to correlate in order to improve model fit. Correlated error terms in measurement models represent systematic, rather than random, measurement error in item responses. They may derive from characteristics specific either to the items or the respondents (Aish & Jöreskog, 1990). For example, if these parameters reflect item characteristics, they may represent a small omitted factor. However, as may the case be here, correlated errors may represent respondent characteristics that reflect bias such as yea-/nay-saying and social desirability (Aish & Jöreskog, 1990) as well as a high degree of overlap in item content (when an item, although worded differently, essentially asks the same question) (Byrne, 2001).
The errors of item 5 (‘Has it happened in the past that you were surprised by the behaviour of people you thought you knew well?’) and item 6 (‘Has it happened that people you counted on disappointed you?’) were correlated. It is obvious from the wording of the items that there is some relationship between the items, because people count on others but are disappointed by them and are then surprised by this outcome because they actually thought they knew them well. The errors of item 9 (‘Do you have the feeling that you are being treated unfairly?’) and item 12 (‘Do you have the feeling that you are in an unfamiliar situation and do not know what to do?’) were also correlated. It is possible that the covariation between the items occurred because participants who felt that they were in an unfamiliar situation felt they were being treated unfairly. Although the fit of the one-factor model of sense of coherence was acceptable after the errors of items were correlated, it should be noted that the fit was not optimal. More research is needed to adapt some of the items of the OLQ.
S
A J
ou
rn
al o
f I
nd
us
tri
al P
sy
ch
ol
og
y
A
rti
cl
e
#7
31
of coherence and those with a weak sense of coherence. This finding confirms that significant differences exist regarding the way employees with a strong and those with a weak sense of coherence perceive helping factors. The most notable differences in helping factors perceived by employees with a strong versus a weak sense of coherence pertained to the nature of the job, monetary rewards, receiving support from management, and the effects of administrative tasks, meetings and bureaucracy.
The helping factors most frequently reported by employees with a strong sense of coherence concerned a challenging and satisfying job they are passionate about. Hence it seems that factors intrinsic to the job were most frequently listed by employees with a strong sense of coherence. In contrast, employees with a weak sense of coherence most frequently reported factors extrinsic to the job as helping factors for them, including monetary rewards and the relationship with managers. Although some employees with a weak sense of coherence also mentioned a challenging job as a helping factor, the frequency of this theme was lower among them. They did not mention being satisfied and passionate about a job as a theme, while some employees even indicated that they should be thankful for having a job. Employees with a strong sense of coherence search for meaning in life; consequently they also expect it from challenging assignments in their work (Antonovsky, 1987). Rothmann (2001) also showed that sense of coherence is significantly related to job satisfaction.
No statistically significant relationship could be found between the restraining factors reported by employees with a strong sense of coherence and those reported by employees with a weak sense of coherence. This finding confirms that significant differences exist regarding the way in which employees with a strong and those with a weak sense of coherence perceive restraining factors. The most notable differences in restraining factors perceived by employees with a strong versus a weak sense of coherence pertain to the unskilled levels of the workforce, the effects of administrative tasks, meetings and bureaucracy, the quality of the relationships between management and workers and among colleagues, stress and pressure in the workplace, and uncertainty regarding the future of the company.
Employees with a strong sense of coherence perceived unnecessary administrative tasks and meetings, bureaucracy and red tape to be restraining factors (while these factors were not even mentioned by employees with a weak sense of coherence). On the other hand, employees with a weak sense of coherence reported that they found the quality of the relationships between management and workers and among colleagues, stress and pressure in the workplace, and uncertainty regarding the future of the company as restraining factors. Employees with a strong sense of coherence might perceive unnecessary administrative tasks, bureaucracy and red tape as withholding them from maintaining coherence. In contrast, employees with a weak sense of coherence report that they are restrained by the relationships in the organisation, stress and pressure, and uncertainty with regard to the future of the organisation. Previous studies (e.g. Feldt, 1997; Frenz et al., 1993) found that individuals with a weak sense of coherence display negative affect and occupational distress. Indeed, sense of coherence is presumed to alleviate distress by affecting the overall quality of cognitive and emotional appraisal of stimuli. Antonovsky (1987) also stated that a weak sense of coherence is likely to result in poor tension management and an inability to mobilise adequate resources.
The most frequently mentioned restraining factor indicated by employees with a weak sense of coherence was insufficient monetary reward. This restraining factor was also relatively important to employees with a strong sense of coherence. Work overload was also an important restraining factor for both groups. This is in line with the idea that sense of coherence does not affect perceptions of job control (Feldt et al., 2004).
Having a positive relationship with colleagues and management and receiving recognition are helping factors both employee
groups’ experience, but they are experienced with a higher frequency by individuals with a strong sense of coherence. Individuals who have rewarding interpersonal interactions with their co-workers experience more meaning in their work (May, Gilson & Harter, 2004). When individuals are treated with dignity and respect and are valued for their contributions, and not simply as the occupants of that role, they are likely to obtain a sense of meaningfulness from their interactions. Qualitative (Isaksen, 1995) and quantitative (May et al., 2004) research support the relationship between rewarding co-worker interactions and meaningfulness. The above-mentioned helping factors are therefore to be added and reinforced by those individuals who find it difficult to define demands as being meaningful.
An unskilled workforce is the only restraining factor experienced with a higher frequency by employee groups with a strong sense of coherence compared to groups with weak of sense of coherence. Employees with a strong sense of coherence experienced time management issues and the company bureaucracy as restraining factors within their working environment, whereas employee groups with weak sense of coherence identified restraining factors within their working environment to be occupational stress, uncertainty regarding the future of the company and the lack of procedures being in place.
In conclusion, employees who have a weak sense of coherence perceive factors within the workplace as unpredictable, uncontrollable and uncertain (Antonovsky, 1987). These employees find it difficult to structure their world to be understandable, manageable and meaningful, and find it more difficult to make cognitive sense of the environmental stimuli (Strümpfer, 1990). This might explain why they perceive factors extrinsic to the job (e.g. monetary rewards and supervision) as helping factors. In contrast, employees with a strong sense of coherence perceive stimuli from their environment as making cognitive sense, as being under control and as being meaningful (Antonovsky, 1987). These groups have a better understanding of the dimensions of the stressors within their environment and regard it as manageable by making use of effective coping strategies, and by looking for meaning in their life.
This study had several limitations. Firstly, the study population was quite homogeneous. Most of the participants were English-speaking females with a grade 12 qualification. Future studies should include more males and different language groups. Secondly, the effect of the position in which employees find themselves was not controlled for. It is possible that employees with a weak sense of coherence find themselves in high-stress jobs. Indeed, as Semmer (2003) points out, there may be a tendency for people low in resources (including a strong sense of coherence) to find themselves in more stressful situations, which might contribute to their perceiving different factors as more restraining than those high in resources Finally, the conclusion might seem plausible that a strong sense of coherence will always be positive, helping employees to interpret things in a positive way. However, this is not always the case – a minimum amount of correspondence between an employee’s beliefs and reality is also necessary (Semmer, 2003).
Recommendations
http://www.sajip.co.za Vol. 35 No. 1 Page SA Tydskrif vir Bedryfsielkunde
S
A J
ou
rn
al o
f I
nd
us
tria
l P
sy
ch
olo
gy
A
rtic
le
#7
31
97
9 of 10 tasks. Their working environment should be defined by a
trusting relationship among colleagues. A clear-set career path with continuous opportunities to obtain knowledge should be reinforced for these groups. Vague communication should be avoided within the working environment.
Team building activities should be reinforced for individuals with a weak sense of coherence in order to enhance good teamwork and positive relationships among colleagues and management. These individuals should be assisted in dealing with distress they experience at work. Support, motivation and recognition from management and colleagues should be reinforced. These individuals should be well informed about processes and procedures within the company. Interventions should be implemented to assist both employees with a weak and a strong sense of coherence to deal with a high workload.
REFERENCES
Aish, A.M., & Jöreskog, K.G. (1990). A panel model for political efficacy and responsiveness: An application of LISREL 7 with weighted least squares. Quality and Quantity, 19, 716– 723.
Amirkhan, J.H., & Greaves, H. (2003). Sense of coherence and stress: The mechanics of a healthy disposition. Psychology and Health, 18(1), 31–62.
Antonovsky, A. (1979). Health, stress and coping: New perspectives on mental and physical well-being. San Francisco: Jossey-Bass. Antonovsky, A. (1987). Unravelling the mystery of health: How
people manage stress and stay well. San Francisco: Jossey-Bass. Antonovsky, A. (1991). The structural source of salutogenic
strength. In C.L. Cooper & R. Payne (Eds.), Individual differences in the stress process (pp. 67–110). New York: Wiley. Antonovsky, A. (1993). The structure and properties of the
sense of coherence scale. Journal of Science and Medicine, 36, 725–733.
Arbuckle, J.L. (1997). Amos user’s guide version 4.0. Chicago: Smallwaters.
Arbuckle, J.L. (2003). Amos 5.0. Update to the AMOS User’s Guide. Chicago: Smallwaters.
Bandura, A. (1989). Human agency in social cognitive theory.
American Psychologist, 44, 1175–1184.
Bolger, N., & Zuckerman, A. (1995). A framework for studying personality in the stress process. Journal of Personality and Social Psychology, 69, 890–902.
Byrne, B.M. (2001). Structural equation modelling with AMOS: Basic concepts, applications and programming. Mahwah: Erlbaum. Clark, L.A., & Watson, D. (1995). Constructing validity:
Basic issues in objective scale development. Psychological Assessment, 7, 309–319.
Cooper, C.L., Dewe, P.J., & O’Driscoll, M.P. (2001). Organizational stress: A review and critique of theory, research and applications. Thousand Oaks: Sage.
Demerouti, E., Bakker, A.B., Nachreiner, F., & Schaufeli, W.B. (2001). The job demands-resources model of burnout. Journal of Applied Psychology, 86, 499–512.
Feldt, T. (1997). The role of sense of coherence in well-being at work: Analysis of main and moderator effects. Work and Stress, 11, 134–147.
Feldt, T., Kivimäki, M., Rantala, A., & Tolvanen, A. (2004). Sense of coherence and work characteristics: A cross-lagged structural equation model among managers. Journal of Occupational and Organizational Psychology, 77, 323–342. Flannery, R.B., & Flannery, G.J. (1990). Sense of coherence,
life stress, and psychological distress: A prospective methodological inquiry. Journal of Clinical Psychology, 46, 415–420.
Fourie, L., Rothmann, S., & Van de Vijver, A.J.R. (2008). A model of work wellness for non-professional counsellors in South Africa. Stress and Health, 24(1), 35–47.
Frenz, A.W., Carey, M.P., & Jorgensen, R.S. (1993). Psychometric evaluation of Antonovsky’s Sense of Coherence Scale.
Psychological Assessment, 5, 145–153.
Grobler, P.A., Warnich, A., Carrell, M.R., Elbert, N.F., & Hatfield, R.D. (2002). Human resources management in South Africa. (2nd edn.). London: Thomson Learning.
Guest, D.E. (2004). The psychology of the employment relationship: An analysis based on the psychological contract. Applied Psychology: An International Review, 53, 541–555.
Hobfoll, S.E. (2001). The influence of culture, community and the nested-self in the stress process: Advancing conservation of resources theory. Applied Psychology: An International Review,
50, 337–369.
Isaksen, J. (1995, September). The process of creating meaning in repetitive work. Paper presented at the Work, Stress, and Health ’95: Creating Healthier Work-places Conference (sponsored by APA, NIOSH, OSHA, and the U.S. Office of Personnel Management), Washington, DC.
Joreskog, K.G., & Sorbom, D. (1993). LISREL 8: Structural equation modelling with the SIMPLIS command language. Hillsdale: Lawrence Erlbaum Associates.
Kalimo, R., Pahkin, K., & Mutanen, P. (2002). Work and personal resources as long-term predictors of well-being. Stress and Health, 18, 227–234.
Kalimo, R., & Vuori, J. (1990). Work and sense of coherence: Resources for competence and life satisfaction. Behavioural Medicine, 16(2), 76–89.
Kobasa, S.C. (1979). Stressful life events, personality, and health: An inquiry into hardiness. Journal of Personality and Social Psychology, 37, 1–11.
Kravetz, S., Drory, Y., & Florian, V. (1993). Hardiness and sense of coherence and their relation to negative affect. European Journal of Personality, 7, 233–244.
Larsson, G., & Kallenberg, K.O. (1996). Sense of coherence, socio-economic conditions and health: Interrelationship in a nation-wide Swedish sample. European Journal of Public Health, 6(3), 175–180.
Lewin, K. (1947). Group decisions and social change. In T.M. Newcomb & E.L. Hartley (Eds.), Readings in social psychology
(pp. 330–344). New York: Henry Holt.
May, D.R., Gilson, R.L., & Harter, L.M. (2004). The psychological conditions of meaningfulness, safety and availability and the engagement of the human spirit at work. Journal of Occupational and Organizational Psychology, 77, 11–37. Nelson, D.L., & Simmons, B.L. (2003). Health psychology and
work stress: A more positive approach. In J.C. Quick & L.E. Tetrick (Eds.), Handbook of occupational health psychology
(pp. 97–119). Washington, DC: American Psychological Association.
Nunnally, J.C., & Bernstein, I.H. (1994). Psychometric theory. (3rd edn.). New York: McGraw-Hill.
Redelinghuys, F.J., & Rothmann, S. (2005). Koherensiesin, coping, uitbranding en begeestering van predikante.
Tydskrif vir Geesteswetenskappe, 45, 466–477.
Rothmann, S. (2001). Sense of coherence, locus of control, self-efficacy and job satisfaction. Journal of Economic and Management Sciences, 5, 41–65.
Rothmann, S. (2008). Norms for the Orientation to Life Questionnaire.
Potchefstroom: Afriforte.
Rothmann, S., Steyn, L.J., & Mostert, K. (2005). Job stress, sense of coherence and work wellness in an electricity supply organisation. South African Journal of Business Management,
36(1), 55–63.
Rotter, J.B. (1966). Generalized expectations for internal versus external control of reinforcement. Psychological Monographs,
80, 1–28.
Semmer, N. (2003). Individual differences, work stress and health. In M.J. Schabracq, J.A.M. Winnubst & C.L. Cooper (Eds.), Handbook of work and health psychology (pp. 83–120). New York: Wiley.
Shaughnessy, J.J., & Zechmeister, E.B. (1997). Research methods in psychology. (4th edn.). New York: McGraw-Hill.
SSPS Inc. (2003). SPSS 12.0 for Windows. Chicago: SPSS.
S
A J
ou
rn
al o
f I
nd
us
tri
al P
sy
ch
ol
og
y
A
rti
cl
e
#7
31
Strümpfer, D.J.W., Danana, N., Gouws, J.F., & Viviers, M.R. (1998). Personality dispositions and job satisfaction. South African Journal of Psychology, 28, 92–99.
Sullivan, G.C. (1993). Towards clarification of convergent concepts: Sense of coherence, will to meaning, locus of control, learned helplessness and hardiness. Journal of Advanced Nursing, 18, 1772–1778.
Tredoux, C., & Durrheim, K. (2002). Numbers, hypotheses and conclusions: A course in statistics for the social sciences.
Lansdowne: UCT Press.
Van Schalkwyk, L., & Rothmann, S. (2008). The validation of the Orientation to Life Questionnaire in a chemical factory. SA Journal of Industrial Psychology, 34(2), 31–39.
West, S.G., Finch, J.F., & Curran, P.J. (1995). Structural equation models with nonnormal variables: Problems and remedies. In R.H. Hoyle (Ed.), Structural equation modeling: Concepts, issues, and applications (pp. 65–75). Thousand Oaks: Sage. Wheaton, B., Muthen, B., Alwin, D.F., & Summers, G.F. (1977).