141
e,
y
¡s.
gr.
¡r.,
Atm6'lera (1988), 1, PP. 141-156
Volcanic activity parameters and volcanism-climate
relationships within the recent centuries
CHRISTIAN-D. SCHONWIESE
J. W. Goethe Univer81'tl/, Institute 01 MeteorolOfll/l1nd Geophl/81"c8, FRG
(Manuscript received October 30, 1987; accepted March 10, 1988)
RESUMEN
Los productos arrojados por el vulcanismo incluyendo las convel'llione·s de gas a partlcula, forman capas de aerosoles atmosféúcos que influyen sobre los procesos de radiación y en consecuencia el clima. Por esto las mayores erupciones explosivas son de interés predominante. Estas causan calentamientos estratoaféricos mientras que la capa limite atmosférica cercana a la superficie sufre enfriamiento. Con el propósito de estudiar estos efectos vistes a través de las variaciones de temperatura ocunidas durante siglos recientes (la estratosfera desde 1958), se ha definido un índice nuevo de actividad volcánica "SVI" basado en la cronologla de volcanes de la institución Smithsoniana. Este parámetro se compara con parámetros similares y se usa para realizar el análisis del forzamiento volcánico sobre la estratosfera y la troposfera. En el análisis estadístico se utilizan técnicaa de correlación, de coherencia móvil e "integrada" y se consideran datos con filtros pasa bajo de uno y de 10 años (low-paBs). Las series de tiempo de la temperatura del aire corresponden al Hemisferio Norte, a la media del Artico así como a las estaciones Filadelfia (USA) y Hohenpeissenberg (RFA). En términos generales las relaciones vulcanismo clima, son más pronunciadas para intervalos grandes de tiempo que para eventos particulares. Finalmente se lleva a cabo un análisis de señal móvil en el que s610 en algunos caaos 1M señales volcánicM en el clima y las razones señal, ruido, exceden el nivel de con.6.dencia de 95%.
ABSTRACT
The ejeeta of volcanism, induding gas-to-partide conversions, form atmospheric ae.rosollayers which inBuence the radiation processes and in consequence the c1imate. Thereby, the major explosive eruptions are of predominant interest. They cause stratospheric warmings whereas the atmospheric boundary layer near surface is cooled. In order to study these e8'eets, focussed on air temperature variations within the recent centuries (stratosphere only since 1958) a new volca.nic aetivity index "SVI" is defined based on the Smithsonian volcano chronology. This parameter is compared with other similar parameters and used for an stratosphere· troposphere analysis of volcanic Corcing. A long-tenn statistical all&lysis uses correlation and coherence techniques "integrated" and moving 'Nith time, considering the annual and 10 yr low-pass filtered data. The air temperature time series refer to the Northern Hemispbere and Arctic mean as well as to the stations Philadelphia (USA) and Hobenpeissenberg (FRG). lo general, tbe long-term volcani m-climate relationshjps may be more pronounced than singular events. Finally, a moving signal analysis is performed where tbe vo1canic signals in c1imate and tile signal-to-noise ratios exceed the 95% confidence level in some cases.
1. Illtroductioll
The mechanism of vo1canic activity is not only a matter of discussion in the field of geology, geophysics and mineralogy but also of great interest in climatology. Newhall and Self (1982) who have interpreted the most comprehensive volcano chronology based on historical and geological sources (Simkin et al.,
1981, 1985) recommend, similar to other authors, to focus the attention to the major explosive eruptions for the purpose of a climatological analysis. These major eruptions in contrast to minor ones, inject the volcanic material (particles and gases) into the stratosphere (predominantly 20 - 50 km) where the rock particles have a residence time oC a few months but the sulfuric acid aerosols
formed by gas-to-particle conversions remain approximately 1 - 5 yr (Hammer et al., 1981; Rampino
and Self, 1984; Jager et al., 1984).
142 CHRISTIAN-D. SCHONWIESE
El Chichón eruption (Mexico, 1982) where the atmospheric transmission dropped from 92% to 79% 2. Vol at Mauna Loa Observatory (Newell and Hsiung, 1984). Simultaneously, LIDAR measurements of Lamb the stratospheric integrated particulate backscattering indicated an approximately 7 -fold increase at voleani
station Garmisch-Partenkirchen (FRG). This increase, however, may be due to several volcanic erup in term tions (additionally Gareloi, Sto Helens and Manam just before the El Chichón eruption, Galunggung Fig. 1] nearly at the same time, aH in 1983 and recorded by Simkin et al., 1985). One more important feature using a of these LIDAR measurements (Jager et al., 1984; Reiter and Jager, 1986) is the long-term increase eruptiol of the stratospheric backscattering since 1977 culminating in 1982-1983 (see also Schonwiese, 1988). observe(
The absorption of solar irradiation by the volcanogenic stratospheric aerosol layers may lead to a warming of these layers whereas the decrease of the atmospheric transmission should lead to a cooling of the atmospheric boundary layer near the surface. (Weak volcanic eruptions, if only affecting the troposphere, may lead to a warming of the atmospheric boundary layer.) Moreover, the c1imate response to explosive volcanic activity should be large-scale in space because the stratospheric sulfuric
been fu. this DV indepenl 1916-19f vo!cano
acid aerosols, due to their long residence time, undergo a wide-spread mixing (and are transported in direction to the stratospheric polar low; McCormick et al., 1978). Any analysis of volcanism-climate
relationships must account for these features in time and space.
The temperature response of the atmosphere to volcanic forcing was discussed in a number of deterministic studies (see e.g., Oliver, 1976; Pollack et al., 1976; Bryson and Goodman, 1980). A
case study of Toon and Pollack (1980) concerning the Agung eruption (1963) was able to simulate both a pronounced stratospheric warming and a relatively weak cooling of the atmospheric boundary layer, in fair coincidence with physical expectations and the observations (se e also Hansen et al.,
1981). Sorne empirical studies considering particularly the temperature response in the atmosphere near the ground inc1ude time series analysis covering the recent centuries (Miles and Gildersleeves, 1978; Schowiese, 1983, 1984), case studies (Sear and Kelly, 1982; Mitchell, 1982; Robock, 1983) and the superposed epoch method (Angell and Korshover, 1985), just to mention a few of these papers. Stratospheric warmings following the major volcanic eruptions have been described and interpreted by Labitzke and Naujokat (1983) and by Labitzke et al. (1986a, 1986b) for the last 20 years.
Handler (1986) has supposed that tropical explosive volcanoes could cause a warming oí the sea surface temperatures and he assumes a connection with the EN SO (El Niño, southern oscillation) events. This is in contrast to Newell and Hsiung (1984) who argue that the El Chichón eruption has been balanced, to a certain extent, by the 1983 ENSO event as far as the temperature response near the ground is concerned. A statistical analysis of volcanism-precipitation relationships performed by Cress (1987) was not very successful. These findings confirm that hypotheses concerning the volcanic forcing of other c1imatic elements than air temperature are very problematic.
This paper is focussed on the air temperature during the recent centuries for which continuous instrumentally-based direct measurements are available. The large-scale feature of volcanic forcing is taken into account by using mean Northern Hemisphere and mean arctic temperature data (near surface) 1851-198~provided by Jones (1985a, 1985b). The records of two stations, Hohenpeissenberg
(FRG, mountain station) and Philadelphia (USA) for 1981-1985, are also considered (aH data. are Fig. 1. Mean from Grove annual averages). Mean Northern Hemisphere data for the stratosphere are available since 1965
(Labitzke et al., 1986a) or since 1958 (Angell and Korshover, 1984) the latter data being very uncer
line¡ Iower I SVI 175D-H
on ice core
tain in the interval 1968/69 (not used here) and before 1964 (for a detailed discussion see Labitzke et
al., 1986b). A reconstruction of the mean Northern Hemisphere temperatures near the surface back It is ver
.
to 1579 (Groveman and Landsberg, 1979) is again very uncertain (see discussion Schonwiese, 1984, core measw
VOLCANIC ACTIVITY PARAMETERS AND VOLCANISM-CLIMATE 143 2. Volcanic activity pararneters
Lamb (1970, 1983) was the first who tried to evaluate a parameter time series which quantifies the volcanic particle loading of the stratosphere within the recent centuries. His "dust veil index" DVI in terms of mean annual data, available for the Northern Hemisphere since 1500 (data since 1750, Fig. 1) and for the Southern Hemisphere since 1890, is based on empirical regression equations using alternatively the observations of the direct solar irradiation (decreased by known volcanic eruptions) or the assessed volume of the volcanic ejecta or (5% of the northern hemisphere data) observed temperature drops which may be hypotheticalIy forced by volcanism. These data have been frequently used in climate analysis. Despite of Lamb's intensive and careful work, however, this DVI time series is inhomogeneous (due to the different regression equations) and not strictly independent from the temperature response which will be analysed. Moreover, within the interval 1916-1962 the DVI data are zero which seems to be unrealistic when compared with the Smithsonian volcano chronology (Simkin et al., 1981).
Kr---jy--¡
800 DVl
I
600 I I
I
-.2 t
I -.4 :
-.6
I
I
-.8
I
1760
3
2
.4
.2
yr
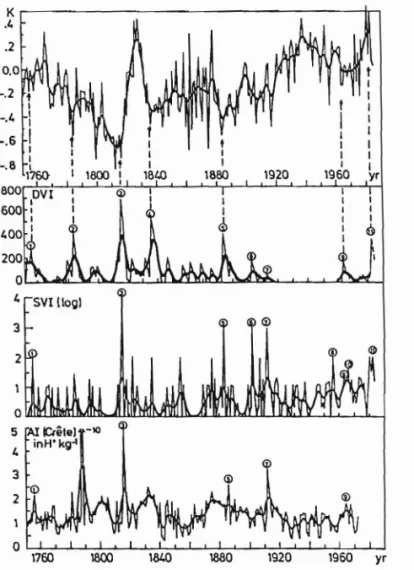
Fig. 1. Mean Northern Hemisphere annual air temperature variations TNH 1750-1985 (deviations [rom the 1880-1979 average, data [rom Groveman and Landsberg, 1979, since 1851 [rom Jones, 1985), thin line, and 10 yr Gaussian low-pass filtered data, heavy line; lower plots corresponding data o[ the volcanic activity parameters DVI 1750-1983 (annual data [rom Lamb, 1970, 1983), SVI 1750-1983 (Smithsonian volcanic index as presented in this paper, logarithmic scale) and Al 1750-1972 (acidity index based on ice core measurements at station Crete, central Greenland, annual data [rom Hammer d aJ., 1980, 1981).
CHRISTIAN·D. SCHÓNWIESE
144
the acid volcanogenic material deposited in the polar ice. This Crete "acidity index" Al series was provided by Hammer et al. (1980, 1981) also in terms of annual data (553-1972, Fig. 1). These data, however, are regional and not necessarily representative for the mean Northern Hemisphere. This is clearly indicated in case of the Laki (Iceland) eruption in 1783 which is extremely outstanding in the Al series but comparably small in the DVI series and Simkin's et al. (1981) chronology. Moreover, the Al series does not strietly discern between eruptions which have affected the stratosphere and those which have noto Finally, the H+ ion concentration may be infiuenced by non-volcanic environmental effects.
These shortcomings of DVI and Al favour the evaluation of a third volcanic aetivityparameter based on the Smithsonian volcano chronology (Simkin et al., 1981, 1985; Hirschboeck, 1980). This chronology classifies all volcanic eruptions known from historical or geological sources with respeet to both their column height and the volume of their ejeeta in terms of the "volcanic explosivity index" VEI = O, 1, ... , 8. Newhall and Self (1982) describe details and state that "the set of eruptions which needs too be considered for volcano-climate studies is probably the set with VEI ~ 3, from 1755 to the present". VEI
=
3 means a column height of 3 - 15 km so that the stratosphere may or may not be affected. Evidently, this poses a problem if this recommendation is followed. Moreover, there exists an increasing trend of the VEI ~ 3 observations in the 20th century probably not correlated with the real volcanic aetivity.Despite these difficulties, Bissolli (1985) and Schonwiese (1986) tried to evaluate an annual volcanic aetivity parameter based on the VEI ~ 3 eruptions which includes the major ones (maximum Tambora 1815, VEI
=
7) but also frequent minor eruptions (VEI=
3) with the exception of those which did certainly not affeet the stratosphere (as far as known from Simkin et al., 1981). In respeet to the volume of the mass m ejected by the volcanoes Smikin's et al. (1981) chronology uses the relationm = 10V EI+4.5
or
(1)
3 3
(V El
=
3 -+ m=
107 - 108 m ; V El=
4 -+ m=
108 - 109 m ; etc.). In consequence, the "Smithsonian volcanic index"n
SVl=
LlO
VE1 (2)i=l
was defined which summarizes the VEI ~ 3 eruptions for each year (n eruptions per particular year) weighted by the volume of the assessed ejecta. Because sorne tropical eruptions on the Southern Hemisphere (e.g., Krakatau 1883) have also infiuenced the Northern Hemisphere climate, all eruptions 100 S to 900 N were included (nearly the same results were obtained if also the volcanoes 100 S to 23
1/2°
S were considered (Bissolli, 1985).In Fig. 1 the annual and 10 yr low-pass filtered data of the DVI, SVI and Al (CrHe parameter) time series are compared (the temperature record will be discussed later) covering the interval 1750 - 1983 (Al until 1972; data before 1750 are more uncertain, see Schonwiese, 1986). Table 1 specifies
sorne ~
(since eruptil
Table 1 data coell
Table 175
DV
wh
No~u.
ue
178
NI
VOLCANIC ACTIVITY PARAMETERS AND VOLCANISM-CLIMATE 145
a,
IS
le
le
¡e
il
IS
o
h
o
y
e
e
sorne statistical properties of these time series (unfiltered data) and Table 2 compares the VEI
>
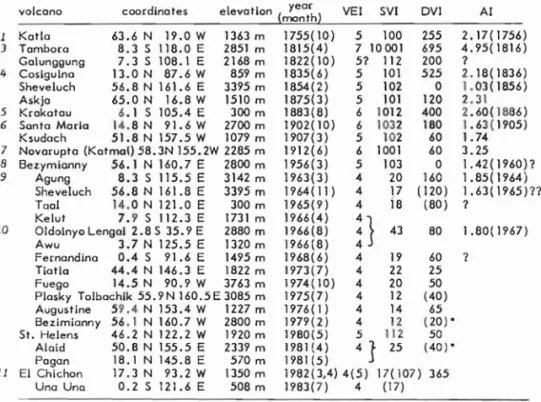
4 (since 1960 including VEI = 4) volcanoes with the annual parameter values. Sorne major volcanic eruptions are denoted by numbers in Figure 1 and Table 2 which may be helpful for intercomparisons.parameter time ¡ntervaI m sk r. r( DVI) r( SVI) r( Al)
a
DVI 1500-1980 56.9 93.6 2.6 +.67 +.33 +.16
1781-1980 65.6 106.8 2.7 +.69 +.45 +.21"
SVI 1500-1980 35.2 464.8 20.6 .00 +.33 +.22
1781-1980 73.7 716.3 13.4 -.01 +.45 +.30"
Al 1500- 1972 1.56 .69 4.5 +.30 +.16 +.22
1781-1972 1.44 .83 6.0 +.16 +.21" +.30"
") time lag 1 year (DVI or SV1, respectlvely, leading)
Table 1. Some statistical properties oC the volcanic aetivity parameters DVI, SVI and Al Crete, annual Northern Hemisphere data (definitions see text); m: arithmetic mean, s: standard deviation, sk: moment coefficient oC skewness, r,.: autocorrelation coefficients (time lag 1 yr), r: correlation coefficients oC the parameters (confidence level 95% exceeded).
l yeor
vol cono coordino tes e evotlon (month) VEl SVI DVl Al
1 Kotlo 63.6 N 19.0 W 1363 m
3 Tambora 8.3 S 118.0 E 2851 m
Golunggung 7.3 S 108.1 E 2168 m
4 Coslgulna 13.0 N 87.6 W 859 m
Sheveluch 56.8 N 161.6 E 3395 m
Askjo 65.0 N 16.8 W 1510 m
5 Krokotou 6.1 S 105.4 E 300 m
6 Santa Marla 14.8 N 91.6 W 2700 m
Ksudach 51.8 N 157.5 W 1079 m
7 Navorupto (Kotmol) 58. 3N 155. 2W 2285 m
8 Bezymianny 56.1 N 160.7 E 2800 m
9 Agung 8.3 S 115.5 E 3142 m
Sheveluch 56.8 N 161.S E 3395 m
TaoI 14.0 N 121.0 E 300 m
Kelut 7.9 S 112.3 E 1731 m
10 Oldolnyo Lengol 2.8 S 35.9 E 2880 m
Awu 3.7 N 125.5 E 1320 m
Fernandíno 0.4 S 91.6 E 1495 m
Tiotlo 44.4 N 146.3 E 1822 m
Fuego 14.5 N 90.9 W 3763 m
Plosky Tolbachik 55.9 N 160.5 E 3085 m
Augustine 59.4 N 153.4 W 1227 m
8ezimianny 56.1 N 160.7 W 2800 m
Sto Helens 46.2 N 122.2 W 1920 m
Alaid 50.8 N 155.5 E 2339 m
Pagan 18.1 N 145.8 E 570 m
11 El Chichon 17.3 N 93.2 W 1350 m
Una Una 0.2 S 121.6 E 508 m
1755( 10) 5 100 255 2.17(1756)
1815(4) 7 10001 695 4.95( 1816)
1822( 10) 51 112 200 1
1835(6) 5 101 525 2.18(1836)
1854(2) 5 102 O 1.03( 1856)
1875(3) 5 101 120 2.31
1883(8) 6 1012 400 2.60(686)
1902( 10) 6 1032 180 1. 63( 1905)
1907(3) 5 102 60 1. 74
1912(6) 6 1001 60 3.25
1956(3) 5 103 O 1.42( 1960)1
1963(3) 4 20 160 1.85( 1964)
1964( 11) 4 17 ( 120) 1.63( 1965)11
1965(9) 4 is (80) 1
1966(4)
1966(8) 43 80 1 .80( 1967)
1966(8)
n
1968(6) 4 19 60 1
1973(7) 4 22 25
1974( lO) 4 20 50
1975(7) 4 12 (40)
1976( 1) 4 14 65
1979(2) 4 12 (20)"
1960(5) 5 112 50
1981 (4) 4
J
25 (40)" 1981 (5)1982(3,4) 4(5) 17( 107) 365
1983(7) 4 (17)
Table 2. Chronologicallist oC explosive volcanic eruptions VEI > 4 compared witb the annual index values SVI, DVr and Al (Crete) 1755·1983, since 1963 (availability oC stratoapheric temperature measurements) also including VEr = 4 (definitions VEI, SVI, DVI and Al .ee text) In the last coluron (Al) the year oC assumed deposition in the polar ice is indicated in tbe parentheses wbere "7" meana tbat no relative maximum can be detccted (similar DVI values in parenthesis).
Notca. The numbers in the first column reCer to Fig. 2. The Al series ends in 1972. In this aeries some "missing" major volcanoes are indic'!-ted (each second year lB the year oC deposition): 1780/1781, 1800/ 1801, 1831/1832; in addition Lakagigar (Laki) 1783/1788, No. 2 (maximum oC Al data).
CHRISTIAN-D. SCHONWIESE
146
time in the stratosphere). The Al data autocorrelation is in between that of SVI and DVI which may point to the fact that the real residence time is somewhat shorter than supposed by Lamb (1970), approximately 1 - 4 years (Table 2).
The intercorrelations of the volcanic activity parameters are relatively weak and more pronounced in the recent two centuries when compared with the 1500 - 1980 (1972) interva1. The index level of sorne prominent eruptions, see Tablp '2 and Fig. 1 (in particular those denoted by numbers), is quite different although, for example, Ka,,:..¡, (1755, No. 1), Tambora (1815, No. 3), Krakatau (1883, No. 5) and Agung (1963, No. 9) are prominent in aH these parameter series, perhaps also Laki (1783, No. 2), Cosiguina (1835, No. 4) and Novarupta (1912, No. 7). Galunggung (1822), Bezymianny (1956) and some other eruptions cannot be identified in the Al series (Santa Maria, 1902, No. 6, only very weak). On the other hand, some VEI
á
4 eruptions are very prominent in the Al series, see Table 2. To summarize, the relatively weak intercorrelations of the volcanic activity parameters and their shortcomings indicate that it is not justified to prefer any particular parameter, namely DVI or Al, as often done in the literature.3. StatisticaI anaIysis of volcanisDl-cliDlate relationships
9.1 Simultaneous stratosphere-troposphere analysis
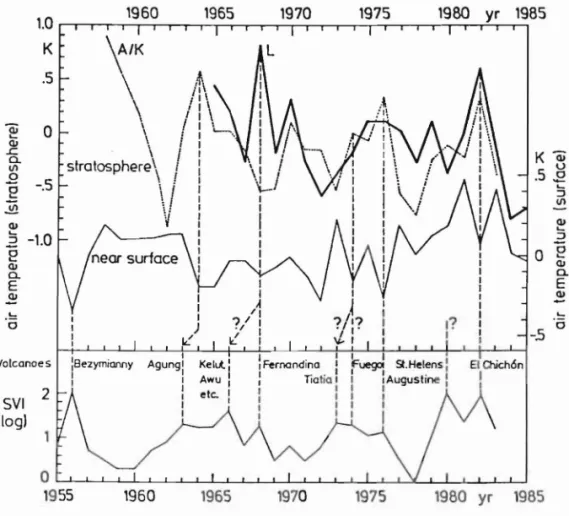
The expected effect of explosive volcanism in the atmosphere, as outlined in the Introduction (upr:r warming, lower cooling), may be appropriate for a hypothetical identification of volcanism-climate relationships. In Fig. 2 which covers the recent three decades the SVI time series (logarithmic scale, lower plot) is compared with corresponding air temperature series (aH data are annual and Northern Hemisphere average). The stratospheric data"A/K" from Angell and Korshover (1984), 100 - 30 hPa mean (corresponding to 16 - 24 km), are uncertain before 1970 as already mentioned (see
Introductionj the 1964 warming, however, may be more or less correct), whereas the data "L" from Fig. 'l. M
!un) ~I
Labitzke et al. (1984, 1986a) are representative for the 30 hPa layer (24 km). The data eoneerning
level D
the atmospheric layer near surface are from Jones (1985a). According to Table 2, the VEI ~ 4 eruptions are indicated as far as they can hypothetically be relat d to the simultaneous temperature effects (upper warmings, lower coolings).
Evidently, some stratospherie warmings are very pronounced, for instance in 1964 (one year after the Agung eruption), 1968 (Fernandina
7)
and 1982 (El Chichón). Labitzke and Naujokat (1983) have analized these stratospheric warmings and state that in 1964 and partieularly in 1982 the effeets are very significant (1982 signal exceeding three times the temperature data standard deviation). The 1968 signal is somewhat problematic because it can be attributed also to the Kelut, Awu and Oldoinyo (1966) eruptions. AH these stratospheric warmings, hypothetically attributable to volcanism, coincide with coolings oí the atmosphere near the surface but these latter temperature effects are very weak and not significant. It may be of interest that from this point of view the climatic influence oí the Sto Helens eruption (1980) cannot be identified. It may be that this eruption is overestimated and9.2 Le
El Chichón is underestimat d by the VEI c1assification or that the chemical properties of the El
Bel Chichón eruption were more effeetive in a climatological senee (higher sulfur content) or that other
roosp non-volcanic effects dominated in 1980/81. The 1983 warming of the atmospheric layer near surface
sudal - in the same year a further cooling oí the stratosphere was observed - could have been due to the
strong ENSO event in that year. temp
1980 yr 1985 1975
1970 1965
1960
,,\,/K
\
I~
\ I!l,
strotosPhere\
I
¡
\I :
V
¡
I
I
I I
I
la
K
.5
O
-.5
-LO
.2
2
VOLCANIC ACTIVITY PARAMETERS AND VOLCANISM-CLIMATE 147
lich may ) (1970),
nounced level of is quite l83, No. r83, No. , (1956) l!y very e Table Id their . or Al,
UPf :r
limate thmic
LI and 984), d (see from rning . >
==4 'ature
after (983) [fects
The linyo lcicle ~eak . the
and e El ther Cace
the
1960 1965 1970 1975 1980 yr 1985
a:;
"-ClJ
L Ka:;
el. u
.9I/l .5E
e
"~ I/l
Vi
ClJ
ClJ "
"-.2
o e
e
ClJClJ
el.
E
el.
E
2 ClJ
.!:: "
o '0
-5
Volcanoes
SVI
[log)
Fig. 2. Mean Northern HemiBphere annual temperature varill.tions (deviations (rom the average) 01 tbe etratoephere leveJ 30 hPa (24 km) "L" aCter Labitr;ke et aJo (1986) or "AIK" alter Angell and Korshover (1984; uncertain before 1970) and 01 tbe atmoBpberic level near Burface (aa in Fig. 1). Sorne major volcanic eruptions are indicated &long with the annual SVI data (see Fig. 1) .
9.2 Long-term corre1ation and coherence analysis
148 CHRISTIAN-D. SCHONWIESE
there are no correlations of the volcanic activity parameters (DVI, Al and SVI) and the mean North ern Hemisphere temperature (near surface) detectable before approximately 1765. This may be due to unreliable data in respect to both the volcanic activiy parameters (confirming the statements oC
Newhall and Self, 1982) and the temperature reconstructions. Moreover, it was demonstrated that in the time interval since c. 1765 the correlation oC SVI and temperature are relatively stable with
Q
time, in contrast to Al (enormous correlation increase within the recent decades) and DVI where the e
latter parameter may systematically overestimate the relationships.
e
~
Table 3, col ums 1 - 4, specifies the correlation coefficients not only of the mean Northern Hemisphere Q
by also of the mean arctic as well as the Hohenpeissenberg and Philadelphia temperature time series .t.
e
with the SVI and DVI parameters. Note that the SVI correlations exceed only the 90% confidence l
level. In contrast to that, the DVI correlations exceed the 95% confidence level in the case of the 1781 - 1984 Northern Hemisphere series and even the 99% confidence level in the case oC the 1738 1984 Philadelphia series. All correlation confidence tests are corrected for autocorrelation by reduced degrp.es of freedom and for non-Gaussian distributed quantities by means of the Fisher transforma tion. If one maintains the assumption that the DVI parameter overestimates the relationships, the overall correlations are very weak and not far from speculations.
correlatlon coefflclents signals (signal - to - noise ratlos)
temperature series time Interval annual LP annual LP
SVI DVI SVI DVI SVI DVI SVI DVI
northern hemisphere* 1851-1983 -.17 -.27 - .34 -.62 -.28K(1.12) -.38K(1.52) -. 26K (1.04) -.57K (2.28)
1781-1983 ~~Ií_ :~34 -.38 - .51 - .47K ( 1. 68) -.62K(2.21) - .70 K (2.50) -.57K (2.04)
arctic (650
-850 N) 1851-1983 :~J!l_ ::.1!l_ - .34 -.64 - .73K (1.22) -. 95K (1.58) -.61 K (1.02) -1.37K (1.58)
Philadelphia (USA) 1738- 1983 :.:J.1. 2L -.26 - .48 -.99K( 1.74) -1.24K (2. 18) -.9IK(i.60) -.96K (1.68)
Fig. 3. Se
Hohenpeissenberg(FRG) 1781-1983 -.06 -.12 -.22 -.30 -. 63K (0.83) -.43K(0.57) -.69K(0.91) -.56K(0.74) nell.r SUE
conlidell *) average based on grid-palnt assessments of Jones (1985)
**) similar but 65 o N to 85o N
Table 3. Correlations and signals of annual or 10 yr low-pass filtered (LP) air temperature data (near surface) in respect to the lteting
volcanic activity indices SVI or DVI. The signal.to-noise ratios are added in parenthesis where the Mnoiae" 18 simply the observed
Table 3
temperature data standard deviation. Correlation conJidence level exceeded: • - • 90%, - 95%, = 99% (autocorrelation i.B tll.ken
into account for by means of reduced degrees of freedom, non-Gaussian distributed series by means of the Fisher transformation). increase autocor to be Ir
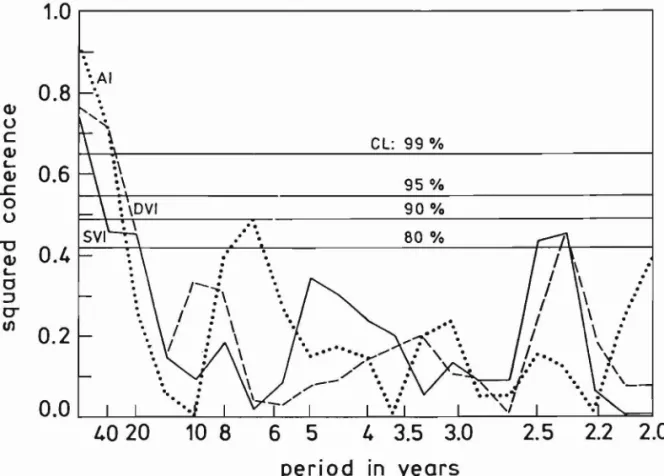
The squared coherence analysis, however, see Fig. 3 (spectrally desintegrated correlation anaIy
order
te
sis), reveals a very important resulto All volcanic forcing parameters, including SVI, prove to be
significantly correlated with the Northern Hemisphere mean temperature TNH in the long-term do This main w here the periods greater than roughly 20 or 30 years exceed the 99% confidence level. This 20 yr l confirms the hypothesis that single volcanic events - except very few extremely explosive eruptions [oughl; are climatologically less meaningful than relatively long-term f1uctuations. Qualitatively the results C. 181 presented in Fig. 3 are hard to interprete. It may be that not only accumulation effects of volcano somel.i genic aerosols due to their stratospheric residence time but also volcanism itself occuring in typical proble long-term fiuctuations (Fig. 1) are responsible for the result~oC the coh rence anaIysis. In detail, tempe
these results are open for discussion and further investigations. 1910-]
c. 191 In order to study sorne details oC the volcanism-temperature relationships in the long-ter m domain
only I it is possible to use low-pass filtered data which focus the attention on the long-term fiuctuations. This There is, however, a statistical complication. The more intensive the low-pass filtering of the time
imply series data the great r is the autocorrelation which hampers the identification of the real correlation
~
VOLCANIC ACTIVITY PARAMETERS AND VOLCANISM-CLIMATE 149
North
1.0
be duelents of ed that
··.AI
.
le with
0.8
.
(1)
ere the
U
e
eL: 99 %(1)
isphere L
0.6
series
..c.
(1) 95 %idence O 90 %
U of the
"U
1738 (1)
duced L
e
[)rma :J
o
s, the
CIl
..
.
.
80 %..
.
0.4
.
. .
..
.
.
.
.
.
0.2
o the erved I en 'ion).
aly I be
do 'his
lS ¡]ts 10
cal
l.i1)
~in
IS.
ne m ss
f.O 20
10 8
6 5
4 3.5 3.0
2.5
2.2 2.0
period in years
Fig. 3. Squared coherence (disintegrated correlation) speetra oC the mean Northern Hemisphere annual air temperature data
near surface 1881-1980 correlated with the volcanic aetiviy parameters, Al, DVI and SVI (compare Fig. 1). CL indicates the conlidence levels 80% (error probability 0.2) oo. 99% (0.01).
filtering (Fig. 1), and in addition aH computations were performed using unfiltered annual data. In
Table 3 (column 5 and 6) "LP" means low-pass filtered data and it can be seen that the correlations increase in case of low-pass filtering but these correlation coefficients are not significant (due to autocorrelation). One needs both) the coherence analysis which specifies the long-term relationships to be more significant than the relationships in the annual domain and the low-pass filtered data in order to study the details of the fiuctuations in time.
CHRISTIAN-D. SCHONWIESE
150
log (SVIl
Figs..'
'
.
1950
yr
:.DVI :,SVI I I J ,
( I
I \ , I
..
..
I \
,
:\
I \,
.,
,
:
\ I I.
,
..
1900
..
1850
,) ,1 , Jr
t
,
1\ 1
\,.
,
,.
'J' .'1800
1750
DVI
0.4
Fig. 4. 20 yr Gaussian low-pa8s filtered data oC the mean Nortbern Hemiaphere annual air temperature variations compared wítb
correponding data oC tbe volcanic aetivity parameters SVI (dashed line) and DVI (dotted line). The arrows indicate some
negatively correlated maxima or minima.
2.0
2.2
2.5
(J) 2.9 Lo.
O
m·
5Q) 3.3
>
e 4.0 ~.5
"O 5.0 ~--=-.s
o
.5
~5Lo. 6.7
Q)
a.
10.5 20
.5
O O O O O
O N M ~ U1 r--. co en O ... N M ~ U1 r--. <Xl
<Xl <Xl <Xl <Xl <Xl <Xl co
'"
CO co co en en en en en en en'"
en en 9. 91...
...
...
...
...
...
...
ThO N M ~ U1 r--. co en O N M ~ U1 r--. CO
r--. r--. r--. r--. r--. r--.
'"
r--. r--. r--. r--. CO <Xl co CD CD CD co'"
ce ce sameperat
time s u binterval
find fFig. 5. Moving squared coberence speetrum oC the mean Northern Hemiapbere annual air temperature variations near surface and I correlated with the volcanic activity parameters DVI (100 yr subintervals moved in 10 yr steps 1701-1800, ...• 1881.1980). The
lies e
contour lines indicate correlation coellicients r:l ~ 5.
O O O O O O O O O O O O O O
K
1.0
(J)
0.2
Q)
o
O
E
o
e
0.5
o
-0.2
Q) Lo.-
o
::J-0.4
Lo.Q)
O
a.
E
Q)
-0.6
-
-0.8
5 é
tervals in 1
300
contour Un trate in th
250
subintervain case of1 parameter
200
(compare 2). In sur
150
relationshparameteJ the 1821
100
50
VOLCANIC ACTIVITY PARAMETERS AND VOLCANISM-CLIMATE 151
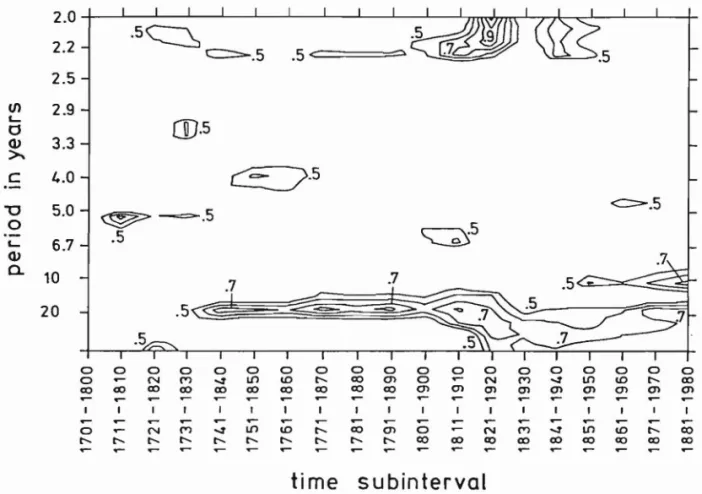
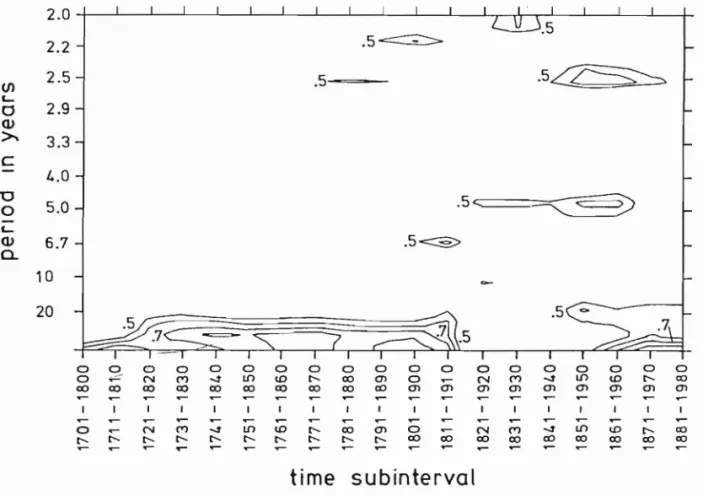
Figs. 5 and 6 present a moving squared coherence analysis where the coherence of 100 yr subin tervals in 10 yr steps (1701-1800, 1711-1810, ... ) is computed. The results are plotted in the terms of contour lines of the correlation coefficients (r 2 ~ .5). Note that in case of SVI the correlations concen trate in the long-term part of the spectrum with a well-marked interruption of coherence within the subintervals c. 1821-1920 (after Tambora eruption) unti11851-1950 (before Agung eruption) whereas in case of DVI the correlations seem to concentrate in a c. 15-25 yr period bando In addition, the DVI parameter points to a pronounced year-to-year coherence with respect to the 1821-1920 subinterval (compare eruptions of Tambora, Krakatau, Santa Maria and Novarupta in this subinterval, see Table 2). In summary, moving coherence analysis confirms the predominant long-term vo1canism-c1imate relationships but also indicates that these relationships are not stable in time. In particular, the SVI parameter refiects the weak vo1canic activity and, in consequence, the weak relations with c1imate in the 1821-1920 -+ 1851-1950, subintervals.
2.0
2.2
red with Lte some
(J) L..
O
Q)
>.
e
2.5
2.9
3.3
4.0
"'O
o 5.0
L.. Q)
el. 6.7
10
20
.5~
.5~~-
.5~
.5~
o ~. o o o o o o o o o o o o o o o o o
o N M -.: Ll"l tD r-- co en o N M -..t Ll"l tD r-- co
co co co co co co co co co co en en en en en en en en en
o ... N M -..t Ll"l tD r-- co en o N M -..t Ll"l tD r-- co
r-- r-- r-- r-- r-- r-- r-- r-- r-- r-- co ro co co ro co co ro co .
time subinterval
Fig. 6. Similar to Fig. 5 but SVI volcanic parameter.
9. 9 Long-term signal and signal-to-noise analysis
The correlations describe the strength of the time series relationships and the coherence does the same in a spectrally disintegrated way. These correlations say nothing about the quantitative tem perature effects both in the year-to-year as well as in the long-term domain. (It may be possible to find small temperature effects des pite of high correlations and vice versa). Therefore, the correlation
:ace and regression analysis must be extended in the way that also the volcanogenic temperature anoma rhe
CHRISTIAN-D. SCHONWIESE
152
variability referred to as "noise". In this context an observational-statistical measure of "noise" is used represented by the observed c1imatic annual data standard deviation.
Table 3 summarizes not only the correlations with respect to the unfiltered and 10 yr low-pass filtered data but also to the related maximum temperature effects. First, in case of the annual data, the numbers based on the DVI parameter are again greater than those based on the BVI parameter.
Ir one assumes that the BVI results may be more realistic then it can be seen that the mean Northern Hemisphere temperature signals are in the order of .3 K but .7 K in the arctic region both based on the 1851-1983 interval (Northern Hemisphere 1781-1983 c. .5 K). These numbers are computed in the way that the observed maximum and, alternatively, minimum value of BVI (or DVI, respectively) is used in the corresponding regression equation in order to assess a temperature decrease (forced by the difference of the DVI or BVI extreme values). This temperature decrease is called the "signal" which can be hypothetically attributed to volcanic forcing. Note that in case of Philadelphia this signal is as high as 1 K (or even 1.2 K based on the DVI parameter) and that also on the mountain Hohenpeissenberg signals of .6 K (or .4 K) are found despite of the extreme weak (and strictly non-significant) correlations.
Performing the same procedure in the long-term domain (10 yr low-pass filtered data) the signals increase considerably in case of the Northern Hemisphere data 1781-1984 and based on BVI (in the arctic region a weak de crease is found). Using the DVI parameter this increase is found in case of Northern Hemisphere 1851-1980, Hohenpeissenberg 1781-1984 and very pronounced in case of the arctic data 1851-1984.
Most of the signal-to-noise ratios exceed the observed annual data standard deviation (numbers >
1),
except Hohenpeissenberg. The most confident results (signal-to-noise ratio>2
corresponding to > 95% confidence leve!) are obtained in case of the low-pass filtered Northern Hemisphere data, except BVI 1851-1984 (similarly confident annual data, DVI 1781-1984).I I I
:
...:
.::
I : I
I ... : . :
: . , ~J
I :: ,.'
I . , ... I
: • : Philadelphia
: Ii'-.../ ·
!,,""
0.0
K
(f)
O
e
-0.5
O'l
.
C/)
Q)
::J
- 1.0
...
Lo
L Q)o..
E
Q)
- 1.5
...
Hohenpeissenberg :
...
::-:
.,,:.
..
'.
.
.
..
".
~:.
1750
1800
1850
1900
1950
yr
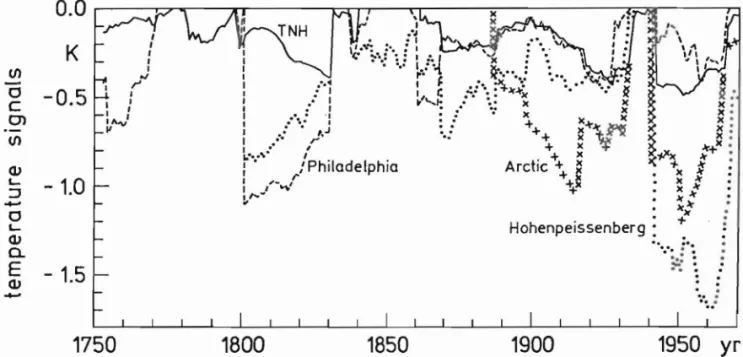
Fig. 7. Moving temperature signa! analysÍ8 eoneeroing the vo1canic parameter SVI and the rollowing aonual air temperature variations: mean Northern Hemisphere TNH (solid line), mean arctie (erosses) as well as the stations Phyladelphia (USA, dashed line) and Hohenpeisseoberg (FRG, dotted lioe), 30 yr subiotervals moved io 1 yr step (1750.1779, 1751-1780 •...• 1951 1980).
Finally, to particul plotted wh results poi signal c.
Hohenpeh indicated 30 yr subi mean NOI in genera signal in
the signa due to a'
and Kor NortherI and -.31
Conclu
The an: recent 1
temper be pos~
relatiOl lnstitu based other' includ Son spheri in
thE
sugge Th veala main mear inflUi a.nal: Ft pred for I
VOLCANIC ACTIVITY PARAMETERS AND VOLCANISM-CLIMATE 153
"noise" is
. low-pass ~ual data, arameter.
~orthern
based on Iputed in ectively) prced by
"signal" lhia this lountain
strictly
signals
(in the case of of the
1mbers mding
data,
:ure
SA,
151·
Final!y, the concept of moving signal analysis allows to study the temperature effects in respect to particular epochs of the climate history. In Fig. 7 the results of a moving signal analysis are plotted where 30 yr subintervals are moved in 1 yr steps (1750-1779, 1751-1780,... , 1951-1980). These results point to sudden infiuences of particular volcanic eruptions at particular stations: Tambora signal c. -1.1 K in Philadelphia and c. - .9 K in Hohenpeissenberg; Krakatau signal c. -.7 K in Hohenpeissenbergj Agung signal c. -1.3 K in Hohenpeissenbergj in Philadelphia a further signal is indicated which should be attributed to any volcanic eruptions approximately in 1770 ( in terms of 30 yr subinterval moving analysis the signals appear 15 yr before the center of the time interval. The mean Northern Hemisphere signals are in the order of not more than c. -.4 K at maximum. Note that in general signals decrease slowly after their sudden appearance with the exception of the Tambora signal in the N orthern Hemisphere data and the Agung signal in the Hohenpeissenberg data where the signal increase with time. This can be only interpreted in the sense of an accumulation effect due to additional volcanic eruptions. These signals are quite different from those found by Angell and Korshover (1985) by means of the superposed epoch method with the exception of the mean Northern Hemisphere data where sorne similarities can be seen (-.25 K signal in case of Krakatau and -.31 K in case of Agung).
Conclusions
The analysis of volcanism-climate relationships on an observational-statistical basis and within the recent centuries from where directly measured climatic data are available must be emphasized on temperature effects although an infiuence on the atmospheric circulation and precipitation may also be possible. The parameterization of volcanism which is needed for an analysis of volcanism-climate
relationships can be based on the VEI (volcanic explosivity index) chronology of the US Smithsonian Institution (Simkin et al., 1982, 1985) where the "S VI" parameter (Smithsonian volcanic indexo based on the VEI data) presented in this paper may be an appropriate alternative hypothesis to other volcanic activity parameters. This parameter is focussed on the major explosive eruptions but includes also sorne "volcanic noise".
Sorne particular outstanding eruptions can be hypothetically identified simultaneously by strato spheric warmings and cooling of the atmospheric layer near surface. Particularly the cooling effects in the atmosphere near surface are, however, very weak on a year-to-year time scale and it can be suggested that they are often masked by additional superimposed processes.
The statistical technique of coherence analysis, however, "integrated" and moving with time, re veals that the volcanism-temperature correlations become significant in the relatively long-term do main of the variance spectrum, whereas only very few singular volcanic events are climatologically meaningful. Moving signal analysis, finally, shows that - particularly in this long-term domain - the infiuence of volcanism on climate is not negligible and must be taken into account in multivariate analyses of climate variations.
.
CHRISTIAN-D. SCHÓNWIESE
154
Aeknowledge:rnents
This study was supported by the German Goverment Climate Research Programme (BMFT, Project No. K. F. 2012 8) I am grateful to H. Jager (Garmisch-Partenkirchen, FRG), K. Labitzke (Berlin West) and T. Simkin (Washington, USA) for providing data and also for sorne comments, in addition to C. Newhall (Vancouver, USA) for critical suggestions concerning an earlier draft of this papero
REFERENCES
Angell, J. K., J. Korshover, 1984. Seasonal tropospheric and stratospheric temperature anomalies for the northern hemisphere, 1958-1984. CDIC Numeric Data Collection NDP-008. US Department of Energy, National Laboratory, Oak Ridge, 57 pp.
Angell, J. K., J. Korshover, 1985. Surface temperature changes following the six major volcanic episodes between 1780 and 1980. J. Climate Appl. MeteoroL, 24, 937-951.
Bissolli, P., 1985. Der Einfiuss des Vulkanismus uild der hypothetischen Variationen der Emission solarer Strahlung auf die bodennahe Lufttemperatur der Nordhermisphare 1881-1981. Diploma thesis, Inst. Meteoro!. Geophys. Univ. Frankfurt (FRG) 202 pp.
Bryson, R. A., B. M. Goodman, 1980. Volcanic activity and climatic changes. Science, 207, 1041 1044.
Cress, A., 1987. Statistische Analyse des Zusammenhangs swischen Vulkanismus und Klima seit 1100 n. Chr. Diploma thesis, Inst. Meteoro!. Geophys. Univ. Frankfurt (FRG), 203 pp.
Groveman, B. S., H. E. Landsberg, 1979. Reconstruction of the Northern Hemisphere temperature: 1579-1880. Pub!. No. 79181/182, Department of Meteorology, University of Maryland, College Park, 59
+
46 pp.Hammer, C. U., H. B. Clausen, W. Dansgaard, 1980. Greenland ice sheet evidence of post-glacial
volcanism and its climatic impacto Nature, 288, 230-235.
Hammer, C. U., H. B. Clausen, W. Dansgaard, 1981. Past volcanism and climate revealed by Greenland ice cores. J. Volcanol. Geoth. Res., 11, 3-10.
Handler, P., 1986. Possible association between the climatic effects of stratospheric aerosols and sea surface temperatures in the eastern tropical Pacific Ocean. J. Climatol., 6, 31-41.
Hansen, J., D. Johnson, A. Lacis, S. Lebedeff, P. Lee, D. Rind, G. Rusell, 1981. Climate impact of increasing atmospheric carbon dioxide. Science, 213, 957-966.
Hirschboeck, K. K., 1980. A new world-wide chronology of volcanic eruptions. Palaeogeogr. Palaeo
climatol. Palaeoecol., 29, 223-241.
Jager, H., R. Reiter, W. Carnuth, W. Funk, 1984. El Chichón cloud over Europe. Geof. Int., 23-2, 243-257; privo comm. (Jager), 1987.
Jones, P. D., 1985a. Northern Hemisphere temperatures 1851-1984. Climat. Monitor, 14, 14-21.
Jones, P. D., 1985b. Arctic temperatures 1851-1984. Climat. Monitor, 14, 43-50.
Labitzke, K., B. Naujokat, 1983. On the variability and on trends of the temperature in the middle stratosphere. Contr. Atm. Physics., 56,495-507; privo comm. (Labitzke), 1987.
Labitzke, K., G. Brasseur, B. Naujokat, A. de Rudder, 1986a. Long-term temperature trends in the stratosphere: Possible infiuence of anthropogenic gases. Geophys. Res. letters, 13 52-55.
Labitzke, l'
tosphere
Lamb, H. meteoro
Lamb, H. Monitol
McCormic measur
MUes, M. rature.
Mitchell,
Newell, ] budge
Clima
Newhall tude
Oliver, empi
pollack clim¡
Reiter, stra' on t
Ramp
Robo<
SehoI
AI
SchOI
Al
Scho
M
Sch< ir
Sch o Sch
(
155
, Project
! (Berlin
addition laper.
ilies for ~rtment
olcanic
hission ploma
1041 ,1100
iture: )!lege
lacial
1 by
sea
t of
~eo--2,
[le
le
VOLCANIC ACTIVITY PARAMETERS AND VOLCANISM-CLIMATE
Labitzke, K., B. Naujokat, J. K. Angell, 1986b. Long-term temperature trends in the middle stra tosphere of the Northern Hemisphere. Adv. Space Res., 6, 7-16.
Lamb, H. H., 1970. Volcanic dust in the atmospherej with a chronology and assessments of its meteorological significance. Philos. Trans. Roy. Met. Soc., A 266, 425-533.
Lamb, H. H., 1983. Update of the chronology of assessments of the volcanic dust veil indexo Clim. MonitoT, 12, 79-90.
McCormick, M. P., T. J. Swissler, W. P. Chu, W. H. Fuller jr., 1978. Post-volcanic aerosol decay as measured by lidar. J. Atmos. Sci., 35, 1296-1307.
Miles, M. K., P. B. Gildersleeves, 1978. Volcanic dust and changes in Northern Hemisphere tempe rature. NatuTe, 271, 735-736.
Mitchell, J. M., 1982. El Chichón weather-maker of the century? WeatheTwise, 35, 252-262.
Newell, R. E., J. Hsiung, 1984. Sea surface temperature, atmospheric C02 and the global energy budget: sorne comparisons between past and presento In: Morner, N. A., Karlén, W. (eds):
Climatic changes on a yeaTly to millennial basis. Reidel, Dordrecht, pp 533-561.
Newhall, C. G., S. Self, 1982. The volcanic explosivity index (VEI): an estimate of explosive magni tude for historical volcanism. J. Geophys. Res., 87, 1231-1238.
Oliver, R. C., 1976. On the response of hemispheric mean temperatures to stratospheric dust: an empirical approach. J. Appl. MeteoTol., 15, 933-950.
Pollack, J. B., O. B. Toon, A. Summers, B. Baldwin, W. von Camp, 1976. Volcanic explosions and c!imatic change: a theoretical assessment. J. Geophys. Res., 81, 1071-1083.
Reiter, R., H. Jager, 1986. Results of 8-year continuous measurements of aerosol profiles in the stratosphere with discussion of the importance of stratospheric aerosols to an estimate of effects on the global climate. MeteoTol. Atmos. Phys., 35, 19-48.
Rampino, M. R., S. Self, 1984. Sulfur-rich eruptions and stratospheric aerosols. NatuTe, 310, 677-679. Robock, A., 1983. El Chichón eruptions: the dust cloud of the century. NatuTe, 301, 373-374. Schonwiese, C. D., 1983. Northern Hemisphere temperature statistics and forcing. Part A: 1881-1980
AD. ATCh. Met. Geophys. Bioclimat., B32, 337-360.
Schonwiese, C. D., 1984. Northern Hemisphere temperature statistics and forcing. Part B: 1579-1980 AD. ATCh. Met. Geophys. Bioclimat., B 35, 155-178.
Schonwiese, C. D., 1986. Zur Parameterisierung der Nordhemispharischen Vulkantatigkeit seit 1500.
MeteoTol. Rdsch, 39, 126-132.
Schonwiese, C. D., 1987a. Observational assessments of the hemispheric and global response to increasing greenhouse gases. ContT. Atmos. Phys., 60, 48-64.
Schonwiese, C. D., 1987b. Moving spectraI variance and coherence analysis and sorne applications on long air temperature series. J. Clim. Appl. MeteoTol., 26, 1723-1730.
Schonwiese, C. D., 1988. Volcanism and air temperature variations within the recent centuries. Conference of the IGU Study Group on Recent Climatic Changes, Sheffield, UK, Proceedings to be published in 1988 (S. Gregory, ed.).
CHRISTIAN-D. SCHONWIESE
156
Simkin, T., L. Siebert, 1. McClelland, D. Bridge, C. Newhall, J, H.Latter, 1981. Volcanoes of the
Atm6.fera (1988 world. Smithsonian Institution, Hutchinson, Stroudsburg (USA), 233pp., supplements 1985.
Toon, O. B., J. B. Pollack, 1980. Atmospheric aerosols and climate. Amer. Scientist, 68, 268-278.
US Department of Energy, M. C. MacCracken, and F. M. Luther (eds.), 1985. Detecting the cli matic effects of increasing carbon dioxide. US Department of Energy, Publ. No. DOEjER-0235,
Lawrence Livermore National Laboratory, Livermore, 198 pp.
El espectro
Esta fo vapor de I
longitud ¿
El agu el modelo Con e
agua; e81
El n¡ Goody Y
Smith'l
This water v'
The
model:
Wit
itl grel Tb. ud R.
1.1:
In a an < atm