WIK-Consult
Report
Study for Ofcom
Competition & investment:
An analysis of the drivers of
investment and consumer welfare
in mobile telecommunications
Authors: Dieter Elixmann Ilsa Godlovitch Iris Henseler-Unger Rolf Schwab Ulrich Stumpf WIK-Consult GmbH Rhöndorfer Str. 68 53604 Bad Honnef GermanyThe views and opinions expressed in this study are those of the authors and do not necessarily reflect the position of Ofcom
Bad Honnef, 3 July 2015
Executive summary
Main findings
The aim of this study is to provide evidence-based analysis of the effect of competition on investment and consumer outcomes in the mobile sector. It explores the hypothesis as to whether there is a ‘virtuous circle’ between competition and investment, or whether, as has been claimed, more intense competition may undermine investment, harming consumer outcomes in the long term. Our assessment is based on empirical analysis from 12 countries, eight of which are European (besides the UK: Austria, France, Germany, Ireland, Italy, Netherlands, Spain) and four are non-European (Australia, Japan, South Korea und the U.S.).
This study aims to provide insights that may be relevant to competition and spectrum policy at European level, as well as providing an input to Ofcom’s Strategic Review of Digital Communications which specifically considers competition and investment in converged communications infrastructure.
On the basis of our analysis including econometric assessments, we have found no linkage between consolidation or higher concentration in mobile markets and an increase in investment. Investment tends to follow long-term investment cycles which appear to be largely unrelated to developments in market structure in the countries assessed.
The evidence also does not confirm that consolidation and higher concentration in mobile markets is linked to an improvement in consumer outcomes. The major potential drivers of better consumer outcomes - notably higher connection speeds, higher mobile penetration and higher data usage - can be found on the demand side. Higher connection speeds are linked to higher smartphone penetration. Both higher mobile penetration and higher data usage are linked to higher mobile video usage. Demand factors thus seem to have a major role in explaining better consumer outcomes.
Our analysis also does not confirm the hypothesis that the UK falls behind major European countries such the U.S., Australia, Japan and South Korea. While the non-European countries have a higher investment in the period assessed, the UK fares well in terms of consumer outcomes. There has been an initial delay in the licensing of 4G spectrum and the subsequent roll-out of 4G networks (not just in the UK, but generally within Europe), which however has been substantially reduced over time.
Although there has been a trend towards approval of consolidation in Europe, we note that in the US the competition authority has sought to maintain a 4 player market, while in Korea the Government is considering reserving spectrum for a 4th mobile entrant in an upcoming auction.
Background
The effect of competition on investment and consumer outcomes in mobile networks has been subject to intense debate. Some mobile operators and analysts have put forward an argument that in the mobile sector there is a virtuous circle between less intense competition, higher operator profitability, and increased investment, which has resulted in better consumer outcomes. The US is often presented as an example of this dynamic. In contrast, they claim that in the EU, mobile network operators make lower returns on capital because of intense competition and stringent regulation, which in turn has led to lower investment and relatively poor consumer outcomes. Meanwhile, some smaller operators, regulators and competition authorities have voiced concerns that consolidation will harm consumers without delivering substantial investment gains. These questions are especially relevant in Europe, because there is currently a trend towards consolidation that has led to a reduction in the number of mobile operators from 4 to 3 in several countries.
A key focus of the study is to understand the main drivers of investment and consumer outcomes, whether the UK and Europe are ‘falling behind’ other regions internationally and what role competition policy (and especially measures to promote market entry or permit consolidation) might play, in relation to other factors, in determining consumer outcomes.
Do consolidated markets lead to increased investment?
Economic theory suggests ambiguous effects of competition on investment. One theory suggests that competition may stimulate investment as operators seek to leapfrog each other in order to gain competitive advantage. On the other hand, the Schumpeterian view holds that there may be greater incentives to invest and innovate if operators can maintain the resulting returns in a concentrated market. A further perspective combining both theories is that there is ‘turning point’ (inverted U-shaped curve) within which it is possible to identify an ‘optimal’ level of competition in order to spur investment.
Various studies have used econometric techniques to assess whether there is a link between mobile market structure and investment, and to highlight what they view as the implications for policies concerning market entry and merger control. A 2015 study by Frontier for the GSMA (2015
)
suggests that the level of competition (measured through HHI or number of operators) does not have a clear influence on investment (capex per subscriber). On the other hand, a report by HSBC (2015) claims to have found an inverted U-shaped relationship between investment and competition, in which the optimal level of competition is found to correspond to an EBITDA margin of 38%.On the basis of our own analysis including econometric assessments, similarly to Frontier, we have found no linkage between consolidation or higher concentration in
mobile markets and an increase in investment1. We also find no compelling evidence that consolidation or a higher HHI impacts on investment through higher profitability, thus casting some doubt on whether assessments based on profitability measures can reliably be used to draw conclusions around consolidation.
Rather, our analysis suggests that investment levels in mobile markets may depend on a range of – often nationally specific – factors, which might for example include demand factors such as mobile video usage, cost drivers such as a high rural population or potentially auction dates and coverage obligations. E.g. investment in the U.S. is higher than in the UK, while the extent of concentration as measured by the HHI is similar to the UK. Possible factors that could explain the higher US investment are earlier assignment of 4G spectrum, higher network deployment costs (lower user density in covered areas) and higher demand for video services.
We also note that, while econometric analysis can provide more comprehensive insights than “simple” (one-dimensional) comparisons between operators or countries on the basis of descriptive statistics, it is rarely definitive. The specific datasets and the operators/countries as well as the time periods observed do matter, and could miss specific features which may explain results in particular markets. A thorough market-by-market investigation is therefore needed for assessing the effects of consolidation and new entry in any particular country.
Do consumer outcomes in mobile markets increase with less competition?
Economic theory predicts that there is a certain level of competition which is best for consumer outcomes in industries characterized by economies of scale and innovation such as the mobile industry. There is thus unlikely to be a single ‘optimal’ market structure in terms of number of mobile network operators and market concentration that is best for consumer outcomes. Rather each national market needs to be examined in the light of local characteristics.The qualitative evidence does not confirm that consolidation and higher concentration in mobile markets is linked to an improvement in consumer outcomes. However, neither does it show a clear link between increased competition and consumer outcomes.2 The reason may be that any effects from competition are outweighed by effects from other factors.
The major linkages to consumer outcomes - notably connection speeds, mobile penetration and data usage - can be found on the demand side. Higher connection speeds are linked to higher smartphone penetration. Both higher mobile penetration
1 Neither a decrease in the number of MNOs nor an increase in the Hirschman-Herfindahl Index (HHI)
is linked to higher CAPEX/revenue or higher CAPEX per subscriber.
2 We found no statistical linkage between number of MNOs or HHI and CAPEX/revenue (or CAPEX per
and higher data usage are linked to higher mobile video usage. Demand factors thus seem to have a major role in explaining better consumer outcomes.
This is also demonstrated by Table A, which ranks the countries by
Consumer outcomes (average of all consumer outcome variables, with equal weights attached to each outcome)3,
Investment (CAPEX/revenue),
Competition (Hirschman-Herfindahl Index - HHI),
Deployment costs (we use share of rural population as a proxy), and
Demand factors (GDP per capita, smartphone penetration, mobile video usage).
Table A: Country rankings for consumer outcomes, competition, investment and other factors, 2013
C onsum e r outc om e s Inve s tm e nt C A P E X /re v e n ue Com pet it ion - HHI C ost s s har e of rura l popu la ti on D e m a nd – GD P per c a pi ta D e m a nd – S m a rt p hone pene tra ti on D e m a nd – m ob il e v ideo usa ge South Korea 1 4 10 4 12 1 1 Australia 2 na 11 2 1 4 4 UK 3 10 2 5 8 3 5 US 4 2 4 6 2 7 2 Japan 5 1 9 1 9 12 3 France 6 9 6 7 7 11 8 Austria 7 7 7 11 4 8 na Netherlands 8 3 8 3 3 6 na Ireland 9 na na 12 5 5 na Italy 10 5 3 10 10 9 7 Spain 11 8 5 8 11 2 6 Germany 12 6 1 9 6 10 9
3 Consumer outcomes include broadband outcomes (3G and 4G availability, connection speed, prices
of mobile baskets including mobile Internet, mobile broadband and 4G penetration, data usage) and voice outcomes (prices of mobile baskets including voice, mobile subscriber penetration and voice usage).
Two of the countries doing best in consumer outcomes are among the least concentrated countries (US and UK), while the other two are among the highest concentrated (South Korea and Australia). This example also illustrates that the relationship between competition (HHI) and consumer outcomes is not clear-cut.
It is however clearly visible that the good consumer outcomes of the top-4 countries are associated with demand factors. The countries performing best in consumer outcomes rank higher in smartphone penetration and mobile video usage (resulting in higher demand for broadband services).
It should be noted that different metrics, a different list of consumer outcomes, and/or other weightings can result in a lower rank for the UK, but would not put in question the overall positive picture for the UK.
An analysis of this kind also highlights that it is simplistic to characterize US mobile markets as ‘lacking competition’. Rather the US compares in the level of mobile competition with many 4 player European markets if competition is measured by the HHI.
Case studies
The countries covered in case studies are characterised by four-to-three consolidation: Netherlands in 2007, Austria in 2010, Ireland and Germany in 2014. The market consolidation led to the removal of the most disruptive operators, and – notably in the latter three countries - to more symmetric market shares of the leading MNOs, structures which might in theory provide fewer incentives for ‘disruptive’ competition. In the more recent mergers in Austria, Ireland and Germany, the Commission tried to avoid the deterioration of competition by making the mergers subject to MVNO access and spectrum divestiture commitments. Although the design of new mobile ‘bitstream’ remedies in Ireland and Germany with high upfront commitments are interesting, given the recent occurrence of the mergers, it is to early to draw definitive conclusions as regards how these remedies will affect competition and consumer outcomes. In general, there are doubts whether the MVNO access arrangements can compensate for the removal of competitors with a maverick role. It is also doubtful whether the MVNOs that benefit from the commitments will ultimately develop into MNOs and acquire or lease the spectrum provided for in the commitments.
In the Dutch case, the earlier merger was not subject to similar commitments. However, Tele2 which operated as an MVNO on commercially negotiated terms, became a fourth operator in 2013 using spectrum acquired in the 2010 and 2012 auctions, following policies by the Dutch Government to reserve spectrum for a new entrant. The market impact of Tele2 as new entrant MNO, however, is to date small.
Implications for competition policy
As regards questions over the approach towards merger control, our analysis suggests that a benign merger control approach which generally welcomes three-to-four consolidation in mobile markets would not be grounded on empirical facts.
UK consumers have benefited from generally positive outcomes, for which the competitive market structure may have been a contributing factor. It is important not to jeopardize the existing positive outcomes by taking decisions which change the market structure without a thorough analysis which focuses on specific factors affecting the UK. Countries which are ahead of the UK in terms of 4G deployment have benefited from earlier licensing of 4G spectrum. Deployment also has been stimulated in many of those countries by a higher demand for data-intensive mobile services. Meanwhile the UK has caught up with 4G rates reaching 84% in 2014.
Competition policy should take account of the particular national circumstances of the UK mobile market. Previous commitments by merging parties in other jurisdictions would have to be carefully scrutinized as to whether they would be effective in a UK environment. It is not clear that they would be able to substitute for the current amount of network competition in the UK. It should also be noted that 4 to 3 consolidations are difficult to reverse und the merger commitments, while striving to keep markets open, do not appear to be effective in this respect.
Contents
Executive summary III
Main findings III
Background IV
Do consolidated markets lead to increased investment? IV
Do consumer outcomes in mobile markets increase with less competition? V
Case studies VII
Implications for competition policy VIII
Figures XII
Tables XIV
1 Introduction 16
1.1 Context 16
1.2 Structure of report 16
2 How do consumer outcomes in mobile markets compare? 18
2.1 Metrics 18 2.2 Countries compared 21 2.2.1 Availability 21 2.2.2 Speed 22 2.2.3 Prices 22 2.2.4 Penetration 24 2.2.5 Usage 25
2.2.6 Linkages between consumer outcomes 26
2.2.7 Rankings 27
3 Does competitive intensity reduce investment? 33
3.1 Theoretical arguments 33
3.2 Empirical evidence 36
3.2.1 Metrics 36
3.2.2 Quantitative evidence 40
3.2.3 Econometric evidence 54
4 Do consumer outcomes in mobile markets improve with less competition? 62
4.1 Theoretical arguments 62
4.2.1 Metrics 64
4.2.2 Quantitative evidence 66
4.2.3 Econometric evidence 71
4.2.4 Observations 74
5 What effect did entry and consolidation have on investment and consumer outcomes?
– Case studies 76
5.1 Austria 76
5.1.1 Consolidation in the Austrian mobile market 76
5.1.2 Competition 77
5.1.3 Profitability 78
5.1.4 Investment 79
5.1.5 Prices 80
5.2 Germany 83
5.2.1 Consolidation in the German mobile market 83
5.2.2 Competition 83
5.2.3 Profitability 86
5.2.4 Investment 86
5.2.5 Prices 87
5.3 Ireland 88
5.3.1 Entry and consolidation in the Irish mobile market 88
5.3.2 Competition 89
5.3.3 Profitability 91
5.3.4 Investment 91
5.3.5 Prices 92
5.4 Netherlands 94
5.4.1 Entry and consolidation in the Dutch mobile market 94
5.4.2 Competition 94 5.4.3 Profitabililty 95 5.4.4 Investment 96 5.4.5 Prices 97 6 References 100 7 Annexes 102 7.1 Alternative rankings 102
7.2 Econometric evidence on linkage between consolidation and investment 104 7.3 Econometric evidence on linkage between consolidation and consumer outcomes 119
7.3.1 Studies relating to prices 119
Figures
Figure 1: Consumer outcomes 18
Figure 2: Coverage of 3G and 4G services 21
Figure 3: Connection speed of mobile broadband services 22
Figure 4: Prices of mixed calls/broadband baskets 23
Figure 5: Prices of broadband-only baskets (laptop use) 23
Figure 6: Prices of calls-only baskets 24
Figure 7: Penetration with mobile subscriptions, mobile broadband services and 4G
services 25
Figure 8: Usage intensity of voice and broadband 26
Figure 9: U-shaped theory – posited relationship between market power and investment 35
Figure 10: Factors potentially driving investment 36
Figure 11: CAPEX to revenue ratio and CAPEX per subscriber 41
Figure 12: CAPEX trends 41
Figure 13: Profitability 42
Figure 14: Profitability trends 43
Figure 15: HHI based on subscriber numbers 45
Figure 16: Spectrum auction dates 49
Figure 17: Wireless connections per square kilometer of wireless network 50
Figure 18: Share of rural population and population density 50
Figure 19: GDP per capita 52
Figure 20: Smartphone penetration and mobile video usage 53
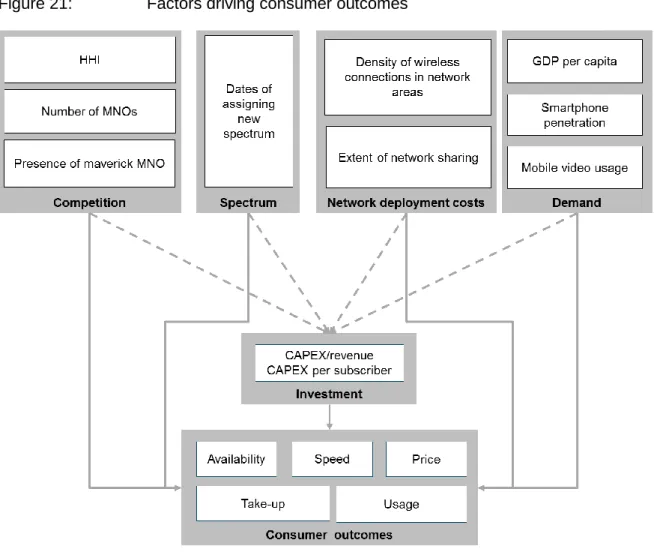
Figure 21: Factors driving consumer outcomes 65
Figure 22: Herfindahl-Hirschman-Index (HHI) in Austrian mobile market, 2005-2014 77 Figure 23: Market shares based on subscribers in Austrian mobile market, 2005-2014 78 Figure 24: EBITDA/revenue margins of MNOs in the Austrian mobile market, 2008-2014
79 Figure 25: CAPEX/revenue ratios of MNOs in the Austrian mobile market, 2008-2014 79 Figure 26: Mobile price indices in Austria by user profiles, January 2011 -December 2014
81 Figure 27: Herfindahl-Hirschman-Index (HHI) in German mobile market, 2005-2015 84 Figure 28: Market shares based on subscribers in German mobile market, 2005-2014 85 Figure 29: EBITDA/revenue margins of MNOs in German mobile market, 2008-2014 86
Figure 30: CAPEX/revenue ratios of MNOs in German mobile market, 2008-2014 87
Figure 31: Mobile price index in German mobile market, 2008-2015 88
Figure 32: Market shares (subscribers) in Irish mobile market, 2005-2013 89 Figure 33: Market Share by Subscription (incl. HSDPA and M2M), Q3‘13 – Q3’14 90
Figure 34: Capex/revenues of Telefonica O2 Ireland 91
Figure 35: Capex/revenues (national – OECD) 92
Figure 40: Average revenue per GB 93
Figure 41: Voice, SMS, MMS and Other Data Volumes Q3’10 – Q3‘14 93
Tables
Table A: Country rankings for consumer outcomes, competition, investment and other
factors, 2013 VI
Table 1: Consumer outcomes: Metrics and sources of data used 18
Table 2: Correlations between consumer outcomes 26
Table 3: UK versus all other countries - Ranking 28
Table 4: UK versus other EU countries – Ranking 29
Table 5: UK versus non- EU countries - Ranking 30
Table 6: Overall ranking with equal weighting of consumer outcomes 31
Table 7: Investment and factors driving investment: Metrics and sources of data used37 Table 8: Correlation coefficients between investment and profitability, country averages,
2005-14 43
Table 9: Mergers and new entry, and number of MNOs, 45
Table 10: Presence of maverick firms, 2005-April 2015 46
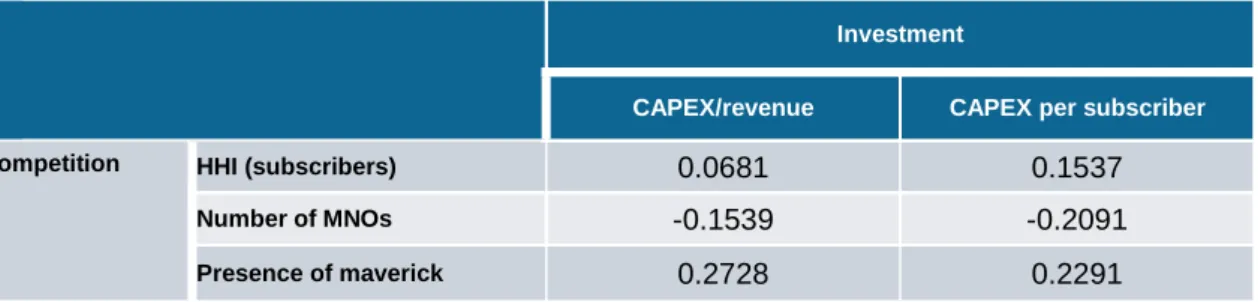
Table 11: Correlation coefficients between investment and competition, aggregate
country data, 2005-14 48
Table 12: Use of network sharing, April 2015 51
Table 13: Correlation coefficients between consumer outcomes and competition as well
as other factors, aggregate country data, 2013 67
Table 14: Country rankings for consumer outcomes, competition, investment and other
factors, 2013 69
Table 15: Overall ranking with equal weighting of consumer outcomes (broadband and
voice), with connection speed measured by Ookla 102
Table 16: Overall ranking with equal weighting of consumer outcomes (broadband only),
with connection speed measured by Akamai 103
Table 17: Overall ranking with equal weighting of consumer outcomes (broadband only),
with connection speed measured by Ookla 104
Table 18: Econometric results achieved by Frontier concerning the key factors
determining investment in mobile markets 106
Table 19: Estimates based on the approach: Capex = f (Ebitda, Ebitda-1, HHI, GDP,
Capex-1) 112
Table 20: Estimates based on the approach: Capex = f (Ebitda, HHI, Capex-1, Revenues,
Revenues-1) 113
Table 21: Estimate based on the approach: Capex = f (Capex-1, Ebitda, HHI, GDP, Auction date, Percentage of rural population, Number of operators) 114
Table 22: Estimate based on the approach: Capex/sub = f (Capex/sub-1, Ebitda/revenue, HHI, GDP per capita, Auction date, Percentage of rural population) 116 Table 23: Estimate based on the approach: ln Capex/sub = f (ln Capex/sub-1, ln
Ebitda/revenue, ln HHI, ln GDP per capita, Auction date, ln percentage of rural
population; ln number of operators) 118
Table 24: Econometric results achieved by Frontier as to the relationship between
competition and prices 120
Table 25: Hedonic Price Model estimation for Austria according to Houngbonon (2015) 123 Table 27: Econometric results of Shinohara, Morikawa, and Tsuji regarding the key
drivers of mobile broadband adoption 126
1 Introduction
1.1 Context
Mobile network operators (“MNOs”) across Europe have put forward the argument that they are hampered by the degree of competition in their markets, chiefly because the high level of competition leads to lower levels of investment. Less investment, the argument runs, slows down the roll-out of new networks and prevents better consumer outcomes in terms of availability, choice, price and speed. Specifically, there is an argument sometimes put forward that in the US mobile sector there is a virtuous circle between less intense competition, higher operator profitability, and increased investment, which has resulted in better consumer outcomes. The contrasting position sometimes put forward is that in the EU, mobile network operators make lower returns on capital because of intense competition and stringent regulation, which in turn has led to lower investment and relatively poorer consumer outcomes.
This study provides evidence-based analysis of the effect of competition on investment and consumer outcomes in the mobile sector. It explores the hypothesis as to whether there is a ‘virtuous circle’ of competition and investment in mobile markets, and the conditions under which there may be potential conflict between the two policy objectives of promoting competition and investment.
In doing so, we have assessed evidence from 12 countries, eight of which are European (besides the UK: Austria, France, Germany, Ireland, Italy, Netherlands, Spain) and four are non-European (Australia, Japan, South Korea und the U.S.). The data available at the time of the study mostly relate to 2013.
This study aims to provide insights that may be relevant to competition and spectrum policy at European level, as well as providing an input to Ofcom’s Strategic Review of Digital Communications which specifically considers competition and investment in converged communications infrastructure.
1.2 Structure of report
The report is structured as follows:
Section 2 assesses consumer outcomes in mobile markets by means of rankings regarding availability, connection speed, price, take-up and usage, and draws insights as to the UK’s positioning versus other EU and non-EU countries.
Section 3 assesses investment in mobile markets by means of CAPEX rankings and looks at the UK’s positioning.
Section 4 identifies the factors that drive investment. It assesses the empirical evidence as to whether more concentrated markets with three players lead to higher investment
than less concentrated markets with four players. It also identifies the important role that other factors play for investment.
Section 5 looks at the factors which explain consumer outcomes. A major question is whether more concentrated markets with three players lead to better consumer outcomes. The answer critically hinges on the relationship between competition and investment. Again, as the study shows, other factors exert an important role.
Section 6 presents case studies of four countries where consolidation has taken place as a result of mergers and looks at the impact of consolidation in these countries. Countries assessed are Austria, Germany, Ireland and the Netherlands.
Section 7 summarises the conclusions on the existence of a virtuous circle between less intense competition, higher operator profitability, and increased investment, and good consumer outcomes.
The Annex shows country rankings based on alternative consumer outcomes and metrics for connection speeds. It also provides an overview of econometric studies on the relationship between competition and investment, respectively consumer outcomes.
2 How do consumer outcomes in mobile markets compare?
2.1 Metrics
Consumer outcomes include the availability of mobile voice and broadband services, connection speeds and price. Availability, connection speed and price are major determinants of two other consumer outcomes which are the take-up (or penetration) of the services and their usage intensity (Figure 1).
Figure 1: Consumer outcomes
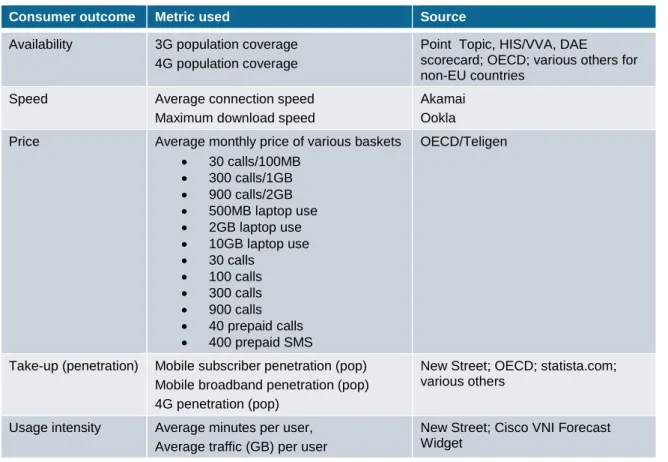
Table 1 shows the metrics and data sources we have used in the empirical analysis. While we have also included voice outcomes, the emphasis of the analysis is on broadband outcomes.
Table 1: Consumer outcomes: Metrics and sources of data used Consumer outcome Metric used Source
Availability 3G population coverage
4G population coverage
Point Topic, HIS/VVA, DAE scorecard; OECD; various others for non-EU countries
Speed Average connection speed
Maximum download speed
Akamai Ookla
Price Average monthly price of various baskets
30 calls/100MB 300 calls/1GB 900 calls/2GB 500MB laptop use 2GB laptop use 10GB laptop use 30 calls 100 calls 300 calls 900 calls 40 prepaid calls 400 prepaid SMS OECD/Teligen
Take-up (penetration) Mobile subscriber penetration (pop)
Mobile broadband penetration (pop) 4G penetration (pop)
New Street; OECD; statista.com; various others
Usage intensity Average minutes per user,
Average traffic (GB) per user
New Street; Cisco VNI Forecast Widget
Availability
As 2G services are generally available throughout the countries studied, we focus on availability of 3G and 4G services. Availability is measured by the percentage of the population to which 3G and 4G services are available as measured by HIS/VVA (2014) for the Euroepan Commission. According to the definition a household has 4G coverage if it is in the stated coverage area for at least one 4G mobile network
It should be noted that the metric cannot provide a full picture. First, as HIS/VVA states, “definitions are not designed to be rigorous definitions from an engineering point of view, but rather are intended to reflect practical definitions used by NRAs and ISPs.” Second, it does not capture the extent to which locations outside inhabited areas are covered, e.g. roads, ports and waterways, which are also important to users. Population coverage is however a better measure than overall territorial coverage, notably if countries are included which comprise large parts of remote and uninhabited areas where mobile networks are not rolled out (cf. Australia). Third, the metric only considers outdoor coverage. Equally important, notably for 3G/4G, is indoor coverage.
Connection speed
For measuring connection speeds, we use data from software-based tests of end users’ connections provided by Akamai and Ookla.
Akamai estimates users’ average connection speed for a large number of countries from the time taken to deliver content of a known size from Akamai’s platform.
Ookla provides users with applications, which they can download for testing their connection speed. The results are collated by Ookla into estimates of average speeds in a country.
We use Akamai and Ookla, because results are publicly available for a number of years for all countries selected in our study. We note however that the results should be treated with caution as it is difficult to control the environment in which software testing takes place.4 It would be more appropriate to use equipment-based testing using the same methodologies in all countries compared. Data based on equipment-based testing was however not available for the set of countries selected for this study.
Speeds measured by Ookla are considerably higher than those measured by Akamai. However, this should not matter for analytical purposes if the ranking of countries is similar for both measures. In practice, there is a weak correlation between Akamai and
4 See Ofcom (2014, p. 37-38) about its reservations with regard to software-based testing of fixed-line
Ookla on mobile.5 Given differences in the ranking for the UK, we have shown how the results would differ if different sources were used.6
Price
Price is measured by the monthly average expenditure incurred by users of predefined baskets of mobile services. We have used the widely cited OECD/Teligen data, which provide prices for mixed voice/data baskets, baskets for laptop-only use and voice/SMS-only baskets.
A problem with predefined price plans is that the plans selected may not be representative, at least not for all countries compared. The large number of baskets defined by OECD/Teligen however largely mitigates this potential problem.
For consolidating the pricing information we have calculated simple averages of prices for bundles that include voice calls and for bundles that include broadband Internet. Weighted averages would have been more appropriate, but the lack of the relevant subscriber weights did not allow us to do so.
Basket-based prices are more likely to offer a direct comparison between services than ARPU, which may be affected by volumes and types of services consumed.
Take-up
Take-up or penetration is measured by the percentage of the population that has subscribed to a mobile service (‘mobile penetration’), a mobile broadband service (‘mobile broadband penetration’) or specifically a 4G service (‘4G penetration’). Mobile broadband penetration is usually higher than LTE penetration as it also takes into account 3G-only use.
The penetration of the population is a widely used measure of take-up. It may however not reveal the „unsubscribed“ portion of the population because multi-SIM usage drives penetration rates above the “true” population penetration. This may distort rankings that include both countries where most mobile connections are pre-pay and characterised by high levels of multi-SIM usage (i.e. Italy) and countries where connections are mainly post-pay and there is lower multi-SIM use (i.e. U.S.).
Usage
Usage intensity for a service is measured by the average monthly usage per subscriber.
5 The correlation coefficient is 0.6 for mobile. There are stronger ranking correlations for fixed broadband speeds.
For mobile voice services, we use average monthly number of minutes per user as reported by New Street.
For mobile broadband services, we use the average monthly traffic (measured in GByte) per user. Usage of bandwidth is an important indicator as to the extent to which consumers and business make use of broadband connections in practice. Bandwidth usage per subscriber per month, can be measured by operators directly (but is often not published), collected by applications installed on end-user equipment or predicted by equipment manufacturers. In this study, we use estimates of bandwidth usage from Cisco Visual Networking Index (VNI).
2.2 Countries compared
2.2.1 Availability
3G services are now widely available in developed countries. All countries in our comparison, except Ireland and Germany have 3G coverage of more than 97%. With 3G coverage of almost 99%, UK is among the best covered countries. 7 other countries have only marginally higher coverage than the UK.
4G networks are still rolled-out in most countries depending on the date of licensing of new 4G spectrum and refarming of existing spectrum. In 2013, the UK had not yet caught up with other countries, some of which have licensed 4G spectrum much earlier. The picture had already changed by the end of 2014, when the most extensive network operated by EE already covered 81% of UK premises.7 As part of the 800MHz license terms, Telefonica O2 has an obligation to deliver at least 98 per cent indoor reception nationwide by the end of 2017 (expected to cover at least 99% when outdoors). The Commission’s recent Implementation Report notes an LTE coverage of 84% for 2014.8
Figure 2: Coverage of 3G and 4G services
Source: IHS/VVA/DAE scorecard; OECD; various others for non-EU countries
7 See Ofcom (2015, p. 61), which regularly measures mobile broadband performance.
2.2.2 Speed
The lower roll-out of 4G networks is not reflected in lower UK connection speeds if Akamai data is used. In fact, average connection speed in 2014, as measured by Akamai, is higher in the UK than in any other EU or non-EU country.
There are however substantial differences between the Ookla and Akamai ranking as Figure 3 shows, which affect the UK’s relative position. While we report this metric, we therefore treat it with some caution – and refer to both sources.
Figure 3: Connection speed of mobile broadband services
Source: Akamai, Ookla
2.2.3 Prices
UK consumers get a particularly good deal in terms of prices. The OECD pricing data shows that, across the whole range of mobile baskets, the UK fares particularly well, whether compared to EU or non-EU countries. For all mobile baskets – mixed calls/data baskets, data-only baskets and calls/SMS-only baskets – the UK is among the top countries and in many cases the most advantageous for consumers. This is shown by Figure 4 (mixed calls/data bundles), Figure 5 (laptop use) and Figure 6 (calls/SMS only). The favorable position of the UK among the EU countries included in this study is confirmed by recent Digital Agenda Scoreboard data.9
Figure 4: Prices of mixed calls/broadband baskets
Source: OECD
Figure 5: Prices of broadband-only baskets (laptop use)
Figure 6: Prices of calls-only baskets
Note: The UK is equally well ranked for very large bundles of minutes (900 minutes) and SMS (400 SMS), which are not shown in the Figure.
Source: OECD
2.2.4 Penetration
The UK is well penetrated with mobile services as Figure 7 shows. Because of multi-SIM usage the mobile penetration rate stands at 121%. The UK has a middle place in the EU, and – if compared to non-EU countries - is only passed by Australia.
The picture with regard to mobile broadband services is mixed. With a mobile broadband penetration of 80% in Q2/2014, the UK was clearly ahead of other EU countries, but behind the assessed non-EU countries.
Because of the relatively late licensing of new 4G spectrum, the UK encountered an initial delay compared to non-EU and other EU countries. With 4G penetration of 4%, the UK was number 5 among the EU countries, and behind the non-EU countries.
Figure 7: Penetration with mobile subscriptions, mobile broadband services and 4G services
Source: New Street; OECD; statista.com; various others
2.2.5 Usage
Good consumer outcomes in the UK in terms of availability, prices and connection speeds should promote usage of mobile services. In fact, the UK is among the top-3 countries in terms of mobile voice usage: With 221 minutes per subscriber, the UK is 2nd placed in the EU (behind France) and also 2nd if compared with non-EU countries (behind the U.S.) as Figure 8 shows.
In turn, good prices and high connection speeds are not yet reflected in a top UK rank for mobile data usage. With 862 MB per subscriber, the UK is 3rd among EU countries, but well behind data usage in most non-EU countries.
Mobile data usage is to a large degree driven by mobile video. The countries that have the highest data usage – Korea, USA and Japan – are also those with the highest mobile video usage, as we will discuss in Section 4.2.2.
Figure 8: Usage intensity of voice and broadband
Source: New Street; Cisco VNI Forecast Widget
2.2.6 Linkages between consumer outcomes
Table 2 shows the linkages between consumer outcome variables: 4G coverage, connection speed, price of mobile baskets, mobile broadband penetration, and usage. The Table indicates strong correlations (if the correlation coefficient is 0.7 or higher, it is marked in green with “++”) and weak correlations (if the correlation coefficient is between 0.5 and 0.7, it is marked in yellow with “+”).
Table 2: Correlations between consumer outcomes
4 G ocv e ra ge C onnec ti on s pee d (A k a m a i) C onnec ti on s pee d (Ook la ) P ri c e f o r m o bi le bas k e t incl udi ng c a ll s P ri c e f o r m ob il e inclu di n g Int e rne t Mo bi le broadba nd pene tra ti on V oi c e u s a ge D a ta usa ge 4G coverage Connection speed (Akamai) Download speed (Ookla) ++ +
Price for basket including calls Price for baskets
including Internet ++
Mobile broadband
penetration +
Voice usage
Data usage + + ++
Note: Green (++) if correlation coefficient is above 0.7. Yellow (+) if correlation coefficient is between 0.5 and 0.7.
To measure speed, price and usage, we have used two variables in each case. It is interesting to note how the variables are correlated:
Speed is measured by Akamai or Ookla. Both variables are positively correlated, though the correlation is weak as measurement approaches of Akamai and Oookla are different.
Prices are measured for (i) baskets that include calls and for (ii) baskets that include mobile Internet. There is a strong correlation between both price measurements. The reason is that mixed baskets that include both calls and Internet enter into both price measurements.
Usage intensity is measured for voice and data. There is a strong positive correlation between data usage and voice usage.
Regarding the linkages between the five consumer outcomes - availability, speed, price, penetration and usage, the following correlations exist:
4G coverage has a strong positive linkage with download speeds measured by Ookla. This linkage, however, does not exist between 4G coverage and connection speeds measured by Akamai.
There is a weak positive linkage between 4G coverage and mobile broadband penetration. This may be explained by availability of fast mobile broadband connections being a necessary condition for users to subscribe to mobile broadband accesses.
There is a weak positive linkage between 4G coverage and mobile data usage. Again this may be easily explained: availability of fast mobile broadband connections is a necessary condition for subscribers to use data-intensive services.
Finally, there is a weak positive linkage between mobile broadband penetration and data usage. The availability of, and demand for, data-intensive services may provide an incentive for users to connect to a mobile broadband network.
2.2.7 Rankings
2.2.7.1 UK versus all other countries
Compared to 11 other countries, UK customers overall get a good deal. The UK ranks high in two voice outcomes (average minutes of use and price of baskets including voice) and two broadband outcomes (average connection speed and price of baskets including Internet). Note that, for 3G coverage, the difference between the UK and the leading countries is very small, such that 3G coverage in the UK is comparable to the top countries.
In many other consumer outcomes, the UK has a medium rank. This includes mobile penetration, mobile broadband penetration and data usage. The exception is 4G
coverage and 4G penetration, where the delay in licensing of new 4G spectrum is the prime reason why the UK was placed behind in 2013. It should be noted that 4G coverage has increased since then and likely improved the UK rank.
Table 3: UK versus all other countries - Ranking
Broadband outcomes Voice outcomes
3 G C o v e ra g e 4 G C o v e ra g e A v e ra g e c o n n e c tion s p e e d (A k a mai) A v e ra g e P ric e o f mob ile b a s k e ts w it h int e rn e t Mob ile B B p e n e tr a tion L TE p e n e tr a tion D a ta u s a g e A v e ra g e P ric e o f mob ile b a s k e ts w it h c a lls Mob ile p e n e tr a tion V o ic e u s a g e UK 8 8 1 2 5 9 6 2 5 3 France 2 6 2 4 11 8 10 3 11 2 Germany 12 5 9 10 12 6 11 9 3 9 Italy 10 10 11 8 8 na 9 10 2 5 Spain 3 9 10 11 7 na 8 11 7 8 Austria 9 12 8 1 9 10 7 1 1 4 Ireland 11 11 4 5 6 7 4 5 10 na Netherlands 3 3 5 6 10 5 12 7 6 7 Australia 3 7 12 3 1 2 5 4 4 na Japan 1 3 3 12 2 3 2 12 8 10 South Korea 3 1 5 7 3 1 1 6 9 6 US 7 2 5 9 4 4 3 8 12 1
2.2.7.2 UK versus other EU countries
If the UK is compared to other EU countries, UK consumers mostly get a very good deal. In many respects, consumers are better served in the UK than in other EU countries: The UK ranks 1st or 2nd in two voice outcomes (price and average minutes of use) and four broadband outcomes (mobile broadband penetration, average connection speed, price and data usage). For all other consumer outcomes, the UK has a medium rank, except for LTE penetration, where in 2013 it still lagged behind.
Table 4: UK versus other EU countries – Ranking
Broadband outcomes Voice outcomes
3 G C o v e ra g e 4 G C o v e ra g e A v e ra g e c o n n e c tion s p e e d (A k a mai) A v e ra g e P ric e o f mob ile b a s k e ts w it h c a lls Mob ile B B p e n e tr a tion L TE p e n e tr a tion D a ta u s a g e A v e ra g e P ric e o f mob ile b a s k e ts w it h int e rn e t Mob ile p e n e tr a tion V o ic e u s a g e UK 4 4 1 2 1 5 2 2 4 2 France 1 3 2 3 7 4 6 3 8 1 Germany 8 2 6 6 8 2 7 7 3 7 Italy 6 6 8 7 4 na 5 6 2 4 Spain 2 5 7 8 3 na 4 8 6 6 Austria 5 8 5 1 5 6 3 1 1 3 Ireland 7 7 3 4 2 3 1 4 7 na Nether-lands 2 1 4 5 6 1 8 5 5 5
2.2.7.3 UK versus non-EU countries
While comparisons between the EU, the U.S. and Asia have often placed Europe behind the other regions, a direct comparison of the UK with major non-EU countries provides positive results. The UK ranks 1st or 2nd in three voice outcomes (price, mobile penetration and voice usage) and two broadband outcomes (price and average connection speed as measured by Akamai). The 3G coverage difference to the leading non-EU countries is negligible.
A gap exists with regard to other broadband outcomes, namely 4G coverage, mobile broadband penetration, 4G penetration, and data usage.
Table 5: UK versus non- EU countries - Ranking
Broadband outcomes Voice outcomes
3 G Co v e ra g e 4 G Co v e ra g e Av e ra g e c o n n e c ti o n s p e e d (Ak a m a i) Av e ra g e Pri c e o f m o b ile b a s k e ts wi th c a lls M o b ile BB p e n e tra ti o n L TE p e n e tra ti o n Dat a u s a g e Av e ra g e Pri c e o f m o b ile b a s k e ts wi th i n te rn e t M o b ile p e n e tra ti o n Vo ic e u s a g e UK 5 5 1 1 5 5 5 1 2 2 Australia 2 4 5 2 1 2 4 2 1 na Japan 1 3 2 5 2 3 2 5 3 4 South Korea 2 1 3 3 3 1 1 3 4 3 US 4 2 3 4 4 4 3 4 5 1
2.2.7.4 Overall ranking with equal weighting of consumer outcomes
Table 6 provides an overall ranking on the basis of an equal weighting of all consumer outcomes for purely illustrative purposes. Based on an equal weighting of all consumer outcome parameters used, the top-4 performers comprise South Korea, Australia, UK and the US. The good performance of the UK reflects its low price level and high connection speed (as measured by Akamai).
It should be noted that different metrics, a different list of consumer outcomes, and/or other weightings can result in a lower rank for the UK.
Using connection speed measurements by Ookla does not affect the UK rank (see Annex/Section 7.1).
Considering only broadband outcomes (either with Akamai or Ookla measurements of connection speeds) moves the UK to the middle group of countries (see Annex/Section 7.1 for alternative rankings).
It is debatable whether attaching equal weights to all consumer outcomes reflects consumer preferences. Reasonable alternative weightings, however, are unlikely to change the overall positive picture for the UK.
Table 6: Overall ranking with equal weighting of consumer outcomes
Broadband outcomes Voice outcomes
3 G Co v e ra g e 4 G Co v e ra g e Av e ra g e c o n n e c ti o n s p e e d (Ak a m a i) Av e ra g e Pri c e o f m o b ile b a s k e ts wi th i n te rn e t M o b ile BB p e n e tra ti o n L TE p e n e tra ti o n Dat a u s a g e Av e ra g e Pri c e o f m o b ile b a s k e ts wi th c a lls M o b ile p e n e tra ti o n Vo ic e u s a g e Num b e r o f o b s e rv a ti o n s Av e ra g e ra n k v a lu e O v e ra ll ra n k South Korea 3 1 5 7 3 1 1 6 9 6 10 4,2 1 Australia 3 7 12 3 1 2 5 4 4 na 9 4,6 2 UK 8 8 1 2 5 9 6 2 5 3 10 4,9 3 US 7 2 5 9 4 4 3 8 12 1 10 5,5 4 Japan 1 3 3 12 2 3 2 12 8 10 10 5,6 5 France 2 6 2 4 11 8 10 3 11 2 10 5,9 6 Austria 9 12 8 1 9 10 7 1 1 4 10 6,2 7 Nether-lands 3 3 5 6 10 5 12 7 6 7 10 6,4 8 Ireland 11 11 4 5 6 7 4 5 10 na 9 7,0 9 Italy 10 10 11 8 8 na 9 10 2 5 9 8,1 10 Spain 3 9 10 11 7 na 8 11 7 8 9 8,2 11 Germany 12 5 9 10 12 6 11 9 3 9 10 8,6 12 Conclusions
The UK’s performance in context:
The UK mobile industry generally performs well and UK customers get a good deal: Mobile voice services are ubiquitously available in the UK at a low price. Mobile
subscriber penetration and voice usage is high.
concerned. In contrast, availability of 4G services in 2013 was behind most other countries due to the delay in licensing of 4G spectrum, but this has subsequently changed. Average connection speeds (as measured by Akamai) and prices are very favorable. The UK must however further catch up in terms of 4G penetration and data usage.
Based on a simple average of all consumer outcome parameters, including broadband and voice outcomes, the UK is placed among the top-4 countries. Different metrics, list of consumer outcomes and/or weightings can change the rankings, but do not to affect the overall positive picture for the UK.
Is Europe ‘falling behind’?
While comparisons between the EU, the U.S. and Asia have often placed Europe behind the other regions, this is not generally confirmed by our analysis. Many European countries fare well in terms of 3G coverage, connections speeds and prices as well as mobile subscriber penetration and voice usage. However, many European countries also have to catch up in 4G outcomes. Europe, as a whole, certainly has to further improve 4G coverage, mobile broadband penetration (notably 4G penetration) and data usage (which is driven by 4G).
Overall, all consumer outcomes taken together, the UK leads the European countries. The direct comparison of the UK with major non-EU countries also suggests that the UK is not behind. The UK ranks generally high in voice outcomes and also performs well in three broadband outcomes (3G coverage, average connection speed and price). There is however a gap in terms of 4G coverage (which has subsequently narrowed down), 4G penetration and data usage which is visible if the UK is compared with non-European countries. The later 4G spectrum auction may be one cause of this difference.
3 Does competitive intensity reduce investment?
In this section we assess the hypothesis that competition may hamper investment, and discuss other factors that may explain differing investment levels in different countries. Our main focus is whether a reduction of the number of MNOs and an increase in market concentration influences investment. Section 3.1 first summarises theoretical arguments on the relationship between competition and investment. Section 3.2 sets out the empirical evidence in qualitative and econometric terms.
3.1 Theoretical arguments
The impact of consolidation on investment is complex as different effects overlap. In a market with a few larger players, operators may be better able to achieve efficiencies. Three efficiencies have been considered as relevant for mobile markets:10
Larger operators are able to spread fixed network and spectrum costs over a larger customer base and realise lower unit costs (economies of scale). At lower unit costs, it may become profitable to further roll out 3G/4G networks into areas that cannot be profitably served by smaller operators. Thus there may be a positive effect on investment.
Larger operators which have more spectrum can more easily aggregate spectrum assets into technically and economically efficient packages. LTE requires a minimum amount of contiguous spectrum and connection speeds can be further increased with larger blocks of spectrum.11 Larger operators may also be able to realise a more efficient mix of spectrum in low frequency bands (for coverage) and spectrum in high frequency bands (for capacity). Finally, the relative amount of spectrum required for maintaining continuity of 2G services will be smaller in a 3-player market than in a, say, 4-player market.
Larger operators can more easily develop commercial partnerships to deploy innovative services, e.g. mobile banking or ‘smart car’ technologies. The chances of finding a partner in the financial or car sector to deploy an innovative service may be higher for a mobile operator with a large customer base than for a small operator.
It should be noted that some, if not all, of the mentioned benefits could also be realised under certain cooperative or regulatory arrangements. The efficiencies that a large operator may achieve over smaller operators are less pronounced or largely evaporate if the following alternative approaches are considered:
10 See e.g. Frontier (2015).
11 E.g., 2x10MHz is generally considered necessary for 800MHz spectrum and 2x20MHz for 1800MHz
Economies of scale could also be achieved through network sharing agreements. Mobile operators could strike network sharing arrangements for lower density areas in order to share the cost of network deployment.
Efficient spectrum aggregation could be promoted by appropriate spectrum management policies. In fact, when new spectrum is auctioned, regulators pay much attention to safeguarding that bidders can realise efficient blocks of contiguous spectrum. Regulators may also make refarming of spectrum bands subject to a reallocation of spectrum if this is required to ensure efficient block sizes or avoid competitive distortions. Finally, spectrum trading may play an important role in fine-tuning spectrum assignments.
Commercial partnerships of MNOs with the banking and car industry could be arranged in a cooperative approach. In fact, it may be preferable to have common arrangements agreed upon by MNOs provided that new players and/or MVNOs can enter into such arrangements on a non-discriminatory basis.
Moreover, it is debatable whether the efficiencies claimed to occur in consolidated markets are fully exploited by the larger entities. Consolidated markets may be characterised by less competition and more market power. Market power gives operators discretion over prices and quality. They may choose not to lower prices or not to improve services, or delay price decrease and service innovations if such strategy preserves profit margins.
The impact of market power on investment in technologically progressive industries is however more complex:
With an increase in market concentration, firms will have a weaker incentive to leapfrog their rivals by investing in new technologies to gain higher profits, since firms can generate higher profits without investing. Higher concentration levels in this context reduce the incentive of operators to ‘escape competition’.
This is counter-balanced by what has been termed the Schumpeterian effect. With increasing market power, firms can expect higher future profitability when investing (which is an important investment incentive). With less competition, it becomes less likely that profits from an investment will be competed away. It is hypothesized that this Schumpeterian effect would increase in a concentrated market with market power.12
Another theory, incorporating both the ‘escape-competition’ and Schumpeterian effect, is offered by Houongbonon and Jeanjean (2014).13 They have constructed a model for
the mobile industry that yields an inverted-U shaped relationship between market power and investment as depicted in Figure 9. It should be noted that the model equates
12 Industry representatives also attribute a positive effect to market power, because current profitability may facilitate funding of investment.
market power with the profit margin and not with the number of MNOs or a market concentration measure14. The model predicts that, at low levels of market power,
investment can be increased through consolidation and the resulting increase in market power. The inverted U-shaped relationship between market power and investment is created by the specific modelling assumptions. Note that the model relates firm investment to market power as perceived by the firm. It does not allow to conclude that a 4 to 3 consolidation would increase aggregate industry investment.
Figure 9: U-shaped theory – posited relationship between market power and investment
Conclusions
On the theoretical relationship between investment and competition:
The impact of consolidation on investment is complex as different effects overlap: Consolidation is more likely to decrease investment of individual firms if the
“escape-competition” effect dominates: The escape-competition effect predicts that, with a decrease in competition intensity, firms will have a weaker incentive to leapfrog their rivals, since market power will already generate profits in the absence of investments.
Consolidation is more likely to increase investment of individual firms if the Schumpeterian effect dominates: The Schumpeterian effect postulates that, as consolidation decreases competition intensity, firms can expect higher future profitability (which creates an incentive to invest) and also achieve higher
14 Houongbonon and Jeanjean (2014) use the Lerner Index as a measure of monopoly power. The
Lerner Index is the difference between price and marginal cost over price. [1-Lerner Index] serves as the measure of competition intensity.
current profitability (which may facilitate funding of investment).
There are theoretical models that predict an inverted U-shaped relationship between competition intensity as perceived by individual firms (measured by profit margins) and investment. Thus market consolidation may result in an increase or decrease of investment of firms. Ultimately, the precise nature of the relationship between consolidation and investment can only be established on the basis of an empirical analysis. It should also be noted that consolidation may reduce
aggregate investment in the mobile market even though each of the remaining
players may invest more than prior to consolidation.
3.2 Empirical evidence
3.2.1 Metrics
The relevant factors potentially driving investment are depicted in Figure 10. Besides competition, there are a variety of other factors that may impact on investment and therefore might explain differences in investment in international comparisons.
Figure 10: Factors potentially driving investment
Table 7 lists the metrics and data sources we have used. The metrics are discussed thereafter.
Table 7: Investment and factors driving investment: Metrics and sources of data used
Indicator Metric used Source
Investment
CAPEX-revenue ratio , CAPEX per subscriber
New Street
Profitability
EBITDA/revenue margin ,
ROCE (return on capital employed)
New Street
Competition
HHI based on revenues or subscribers New Street
Number of MNOs WIK
Presence of maverick MNO WIK
Dates of assigning new spectrum and refarming existing spectrum
Year of first 3G/2000MHz and 4G/700-800MHz auction
WIK WIK
Network deployment costs
Share of rural population Worldbank, OECD
Form of network sharing (site/mast sharing, RAN sharing, national roaming)
GSMA, Frontier, other sources
Demand
GDP per capita Worldbank
Smartphone penetration Cisco VNI Forecast
Widget; New Street
Use of mobile video Cisco VNI Forecast
Widget; New Street
Investment
Investment is measured by the CAPEX/revenue ratio and CAPEX per subscriber as reported by New Street. CAPEX figures must be interpreted with care.
First, CAPEX measurements in different countries may be based on different methodologies, in particular as regards the treatment of spectrum acquisitions. Second, CAPEX comparisons between MNOs or between countries may be
misleading if limited to a single year. CAPEX follows a cyclical pattern, since technological change is implemented in successive generations of technologies. CAPEX is closely correlated to periods in which there are network deployments and technology upgrades.
Third, it is useful to relate CAPEX to subscribers or revenue, in order to adjust for different market sizes in international comparisons. We prefer to use the CAPEX to revenue ratio, as CAPEX per subscriber, if used in international comparisons, is sensitive to exchange rate changes.
Profitability
Profitability is measured by the EBITDA to revenues ratio (EBITDA margin) as reported by New Street and defined as follows:
𝐸𝐵𝐼𝑇𝐷𝐴 𝑚𝑎𝑟𝑔𝑖𝑛 = 𝑅𝑒𝑣𝑒𝑛𝑢𝑒𝑠𝐸𝐵𝐼𝑇𝐷𝐴, where
𝐸𝐵𝐼𝑇𝐷𝐴 = 𝐸𝑎𝑟𝑛𝑖𝑛𝑔𝑠 𝑏𝑒𝑓𝑜𝑟𝑒 𝐼𝑛𝑡𝑒𝑟𝑒𝑠𝑡, 𝑇𝑎𝑥, 𝐷𝑒𝑝𝑟𝑒𝑐𝑖𝑎𝑡𝑖𝑜𝑛 𝑎𝑛𝑑 𝐴𝑚𝑜𝑟𝑡𝑖𝑠𝑎𝑡𝑖𝑜𝑛 𝑅𝑒𝑣𝑒𝑛𝑢𝑒𝑠 = 𝑅𝑒𝑡𝑎𝑖𝑙 𝑎𝑛𝑑 𝑤ℎ𝑜𝑙𝑒𝑠𝑎𝑙𝑒 𝑟𝑒𝑣𝑒𝑛𝑢𝑒𝑠, 𝑖𝑛𝑐𝑙. 𝑓𝑟𝑜𝑚 𝑠𝑎𝑙𝑒𝑠 𝑜𝑓 𝑡𝑒𝑟𝑚𝑖𝑛𝑎𝑙 𝑒𝑞𝑢𝑖𝑝𝑚𝑒𝑛𝑡
An alternative measure is post-tax ROCE (Return on Capital Employed):
𝑅𝑂𝐶𝐸 = 𝐹𝐶𝐹
𝐶𝑎𝑝𝑖𝑡𝑎𝑙 𝐸𝑚𝑝𝑙𝑜𝑦𝑒𝑑, where
𝐹𝐶𝐹 = 𝑂𝑝𝑒𝑟𝑎𝑡𝑖𝑛𝑔 𝐹𝑟𝑒𝑒 𝐶𝑎𝑠ℎ𝑓𝑙𝑜𝑤 𝑡𝑎𝑥 = 𝐸𝐵𝐼𝑇𝐷𝐴 − 𝐶𝐴𝑃𝐸𝑋
𝐶𝑎𝑝𝑖𝑡𝑎𝑙 𝐸𝑚𝑝𝑙𝑜𝑦𝑒𝑑 = 5 year rolling sum of CAPEX plus a fair value of spectrum
holdings (5 years' CAPEX implies a ten year average asset life, half depreciated).
A core difference between the measures is that EBITDA margins do not reflect expenditure on spectrum, while typically the measure of ‘capital employed’ used in the context of ROCE includes spectrum costs. In its assessment of ROCE, New Street uses what it deems a ‘fair value’ for spectrum costs.15 In markets where spectrum is
allocated without spectrum charges, such as in Japan, New Street uses zero for capital employed in spectrum.
In Europe, New Street has also calculated an 'adjusted FCF' based on a normalised capex figure (a five year average), with the aim of smoothing spikes.
Competition
Competition between MNOs is measured by the Hirschman-Herfindal Index (the sum of the squared percentage market shares, which may take a value of up to 10.000 in case of a monopoly) and the number of MNOs. While HHI and number of MNOs are often used as proxies, they are incomplete measures of competition intensity. In a multi-country study they are however the best available indicators. We also use them as we are primarily interested in the impact of consolidation – as reflected in number of operators and market concentration - on investment and consumer outcomes.
15 With regard to the 'fair value' for spectrum, New Street uses certain base valuations. Where there have been auctions at prices that are materially higher than the base case valuations, New Street uses the higher figure for one year, and then tapers back to the base case valuation over the following four years. For example this applies to the expensive EU 3G auctions in 2000 and to the Austrian and Dutch multiband auctions more recently.
The HHI is calculated on the basis of subscriber numbers as well as revenues reported by New Street. The revenue-based HHI may be more appropriate for competition analysis. However, as shown below, correlation is strong between both indices such that they can be considered substitutes. As we measure infrastructure competition, customers of MVNOs are included in the host network operators’ market shares.
Maverick MNOs are identified as smaller MNOs, which actively try to win market share by undercutting prices of the larger operators, and/or by offering service innovations. Mavericks are usually latecomers or new entrants. More concretely, mavericks are characterized by a commercial strategy to increase market share given their (i) limited scale and subscriber base and (ii) low costs of acquiring additional customers due to available spare capacity which provide strong incentive to grow by competing vigorously.16
Dates of assigning new spectrum and refarming existing spectrum
Deploying new generation networks requires the prior assignment of new spectrum and/or the refarming of existing spectrum.17 It is clear that a late auction date delays
investment into new networks. The auctioning of spectrum for 3G, and subsequently 4G, triggered new investment cycles. There should be a close relationship between date of auctioning and investment, because spectrum license conditions usually contain roll-out obligations and firms usually roll out networks once they have won spectrum. We focus on the two most important dates for 3G and 4G spectrum assignments: the date when new 3G/2000MHz spectrum has been licensed (this was at the beginning of the 2000s) and the date when new 4G/700 or 800MHZ spectrum has been licensed (this was at the beginning of the 2010).
Network deployment costs
Countries may substantially differ in terms of deployment costs. Geographical coverage area and the distribution of population in coverage area have an important influence on the cost of network deployment, both in terms of investment for coverage and capacity. A larger geographical area requires more investment into coverage.18 Moreover, the parts of the coverage area that are densely populated require additional investment into capacity.
Wireless connections per sqm of network area would be a good proxy for network deployment cost, for which however data was not available for the countries compared. Inhabitants per sqkm of national territory is also often used. However, as totally
16 See the Commission’s characterisation of Three in Ireland before its merger with Telefónica.
European Commission (2014), summary.
17 3G networks operate in the 2.1GHz band (new spectrum). The new 4G networks operate in the
700/800MHz and 2.6GHz bands (new spectrum) as well as 1800MHz band (refarmed spectrum).
18 A certain minimum amount of population coverage and sometimes territorial coverage is often