Almatourism
Journal of Tourism, Culture and Territorial Development
___________________________________________________________
Marketing Mix and Destination Image, Case Study:
Batu Caves as a Religious Destination
Arasi Paniandi, T.* Albattat, A.R.†
Management and Science University (Malaysia) Bijami, M.‡
University Sains Malaysia Alexander, A.§
Balekrisnan, V.**
Management and Science University (Malaysia)
ABSTRACT
Batu Caves have become famous when the limestone hills were recorded by colonial authorities in 1878. It was promoted as a place of worship and religious attraction. This study aims to find out the visitor satisfaction towards marketing mix (4P’s) and the destination image of Batu Caves. The data were derived from self–administered questionnaire consisted of structured questions related to the listed attributes. The survey was distributed during November 2016. The statistical package for social science (SPSS20) was used to analyze the data. Results showed that most of the respondents were satisfied with the Batu Caves marketing 4Ps, and had a favorable overall destination image and their visit was valuable. However, some of the tourists mentioned their negative feeling about the destination due to the maintenance activities and covering the lord Murugan Statue. Recommendations were made to increase the awareness and marketing campaign to attract more tourists, especially during the holy Thaipusam celebration.
_________________________________________________________
Keywords: Batu Caves; Destination Image; Marketing; Marketing Mix; Tourism
* E-‐mail address: [email protected] † E-‐mail address: [email protected]
166
Introduction
Nunkoo et al., 2013). The objective of this research is to study the relationship between marketing mix and Batu Caves as a religious destination image.
1. Literature Review
1.1 Religious Tourism and Attractions
It needs to be said at the outset that the understanding of the motivation for religious tourism is essential. This study focuses on Batu Caves as one of the main religious attractions in Malaysia. The majority of motivational theories have been proposed the prime motivations to practice religious tourism. Theories of motivation divided into two theories namely, a) content theory and b) process theory. Content theory focuses on what motivates people while process theory explains the relevant factors. Both theories provide a better understanding for the researchers and classify the motivations of religious tourism. Tourists can inform tourism stockholders in developed ways to meet the needs, wants, and expectations of tourist while visiting the religious attractions.
People have always been interested in making sense of their lives and keen to the religious part of them. Nowadays, majority of people are interested in traveling and taking part in religious festivals and events organized in the religious attractions. For instance, Hindu religious festivals and pilgrimage events have been institutionalized over 1000 years ago; these festivals include an integrated functions and people from diverse cultures and ethnic groups (Singh, 2004).
It must be stated that religious tourism has a fundamental role in human spirit and it satisfies their needs. Maslow (1954) mentioned in his theory that human will start to seek their social needs if they fulfil their basic needs. Herzberg (1974) also stressed in his theory of motivation that human driven by their hygiene and motivating factors will be lead to travel and visit religious destinations. Therefore, this will motivate the attractions management to enhance the destination and focus on the marketing mix to attract tourists and get their satisfaction and enhance destination image.
1.2 Marketing
168
new school year, or selling an item at a price that's too high or too low to attract the people you're targeting (Chon, 1991).
More to point, marketing is the management process responsible for identifying, anticipating and satisfying customer requirements profitability. In fact, Marketing is the activity of a company associated with buying and selling a product or service. It includes advertising, selling and delivering products to people. People who work in marketing departments of companies try to get the attention of target audiences by using slogans, packaging design, celebrity endorsements and general media exposure. Moreover, marketing is everything a company does to acquire customers and maintain a relationship with them. Even the small tasks like writing thank-‐you letters, playing golf with a prospective client, returning calls promptly and meeting with a past client for coffee can be considered as marketing. It must be noted that the major goal of marketing is to match a company's products and services to the people who need and want them, thereby ensuring profitability. The marketing mix is a business tools which start when stockholders are thinking through their plans for a product or service, and it helps them to avoid these kinds of mistakes. As long as the inherent sense of curiosity and adventure dwells in the hearts of human beings, the desire to travel, in order to see new sights and experience new things and to live under different environments will always enhance. Hence, marketing in the tourism industry is greatly simplified as part of the process which has already been completed by people who are interested in travelling (Chon, 1991).
The process of management through which goods and services move from concept to the customer includes the coordination of marketing mix, identification, selection and development of a product, determination of its price, selection of a distribution channel to reach the customer's place, and development and implementation of a promotional strategy. Marketing is based on thinking about the business in terms of customer needs and their satisfaction.
1.3 Marketing Mix
The marketing mix is a business tool used in marketing and by marketers. The marketing mix, originally invented by Neil Borden and can be used when determining a product or brand's offer, and is often associated with the four Ps (Marketing Mix). The “Product” is the first P represents the actual product. The “Price” represents the process of determining the value of a product. The “Place” represents the variables of getting the product to the consumer, such as distribution channels, market coverage, and movement organization. The last P stands for “Promotion” which is the process of reaching the target market and convincing them to buy the product. The four Ps determine how marketing satisfies consumer needs. They are considered controllable marketing mix factors. It means that they can change or be altered as needed. Habits, lifestyle, and diet are all considered to be controllable risk factors.
(1960). The four P's of marketing are product, place, price and promotion. Product refers to the item to be sold. What product is going to be sold? What features differentiate the product from competitor products? Are there associated products that can be marketed with the initial product? Product can be anything for the visitor’s attention, acquisition, use or consumption that can be used to satisfy a need or want. Product is something tangible goods, it includes physical objects, services of persons, places, organization, manufacturer idea or a combination of these (Kolter & Armstrong 2000).
The first P which deals with the “product” of the business is selling, the competition and substitute products. Products consideration affects every other marketing decision. What does the customer want? What needs does it satisfy? What features does it have to meet these needs? Are there any features you've missed out? Are you including costly features that the customer won't actually use? How and where will the customer use it? What does it look like? How will customers experience it? What size(s), color(s), and so on, should it be? What is it to be called? How is it branded? How is it differentiated versus your competitors? What is the most it can cost to provide, and still be sold profitably? Price refers to the sale price of the product. Consider factors such as the cost price of the product, marketing expenses and distribution costs. Determine if these costs are likely to be fixed or variable when calculating an appropriate price. Price can also be used to position the product in respect to perceived quality. Price sets a value standard for the service. Price is the amount of money charged for a product or service, or the sum of the values that consumers’ exchanges for the benefit of having or using the product or service (Kotler & Armstrong, 2001). Price includes strategies for managing inventory and staffing. What is the value of the product or service to the buyer? Are there established price points for products or services in this area? Is the customer’s price sensitive? Will a small decrease in price gives you extra market share? Or will a small increase be indiscernible, and so gain you extra profit margin? What discounts should be offered to trade customers, or to other specific segments of your market? How will your price compare with your competitors?
170
meets the salesperson is the “place”. Direct sales methods can put the place in the customer’s home or office, with a salesperson with the mail orders and also the catalogue marketers.
In addition to the controllable marketing mix factors, there are uncontrollable factors called environmental forces. The external influences are the forces that affect the characteristics of the marketing strategies to which marketers adapt. Others include: regulatory, economic, social, political, environmental, competitive, and technological. This refers to laws and legality (governmental policies) that may affect the way marketing can be characterized. For example, government restriction on the importance of a particular product might hinder the marketers playing in that particular field.
Economics, various trends in the economic business cycle, includes inflation, recessions, deficit, or income level. Each of these factors can have a direct impact on marketing which may have to be re-‐evaluated and overhauled as a result. The social forces refer to the structure and dynamics of individuals and groups and their behaviors, beliefs, thought patterns, and lifestyles, friendships, etc. When consumers change their needs and wants, this directly affects marketing strategies. The socioeconomic conditions are closely related to the state of the governmental institutions. Depending on the governmental impact on bureaucracy, corruption, freedom of speech, and other limitations (or opportunities), the marketing strategies will adapt to the political conditions. The competition refers to the numbers of similar competitive product brands. A new competitor entering the market will directly affect the marketing strategies of the incumbent companies. Moreover, firms which offer similar services or products often achieve differentiation through marketing, positioning, and branding. It must be noted that the marketing strategies often adapt to the pace of development of the consumer demand and exponential technological progression.
1.4 Destination Image
In order to address the research questions, literatures about the definition of destination image, the composition and formation agents of destination image, and the key theory of customer buying process and destination loyalty were reviewed. Consumer behaviour is subcategorized into pre-‐visit, during visit and post-‐visit phases, which have numerous attitudinal and behavioural factors that influence destination image. Literature review in this study will be structured based on this model (Tasci & Gartner, 2007).
Great efforts have been invested in attempts of conceptualizing the composition of destination image. By synthesizing all the components of an image, Bouding (1956) considered three main components namely, cognitive, affective and conative. The characteristics of image component were examined by Echtner and Ritchie (1991), who created the “three axes”, which represent the existence of the three dimensions of destination image: functional and psychological; attributes and holistic; common and unique. Understanding the formation of destination image is also essential to numerous image studies. Using Gartner’s (1993) theory of seven major agents of destination image formation process, Tasci and Gartner (2007) categorized three sources such as :1) supply-‐side sources: overt induced type I & type II; 2) independent sources: covert induced type I & type II and autonomous; 3) demand-‐side sources: unsolicited organic and solicited organic.
The majority of researchers have emphasized key phases in the tourist’s buying process. (Strong, 1925; Howard & Sheth, 1969; Crissy, Boewadt & Laudadio, 1975; McDaniel, 1979; Cunningham & Cunningham, 1981; Russ & Kirkpatrick, 1982, as cited in Mill and Morrision, 2006). In Crissy’s (1975) theory, these phases are awareness, interest, evaluation, trial and adoption, where the former three stages can be grouped into pre-‐visit phase, trial in during-‐visit phase and adoption in post-‐visit phase. The way destination image affects consumer buying behaviour also has been studied. Fakeye and Crompton (1991) linearly connected tourist’s buying process and image forms. They stated that motivation to travel comes from organic image of destination which leads to active information search. During this process, induced image is formed. Combining organic and induced image, evaluation of destinations among alternatives was conducted and then results in selection of destination. After destination visit, a more complex image is formed, only to impact the evaluation of destination for the next visit.
The interaction between destination image and consumer buying process in the phase of post-‐visit behaviours relates heavily to the destination loyalty. Day (1969) argued that there are two dimensions in addressing loyalty: attitudinal loyalty, which requires a psychological commitment; and behavioural loyalty, which is reflected by the consistency of buying behaviours. According to this theory, on the impact of visitation experience on destination image at post-‐visit phase, an appreciation of travel experience will result in sharing and recommending the destination to friends and relatives (attitudinal loyalty) and make repeat visits to the destination (behaviour loyalty).
1.5 Batu Caves
172
temple to Lord Muruga within the caves. The history of Batu Caves started in 1891 when Mr. Thamboosamy Pillai, who also founded the Sri Maha Mariamman Temple Dhevasthanam, Kuala Lumpur, send his very close associates namely, Sri Thiruvengadam Pillai and Sri Kanthapa Thevar to survey for an ideal advertising suitable place of worship for Lord Sri Murugan. It was the year that the influential descendant of Indian immigrants from Tamil Nadu, India, Mr. K. Thamboosamy Pillai installed the ‘murti’ or consecrated idol of Sri Subramaniar Swamy (Lord Murugan) in the 400 feet hight Temple Cave, Tourism Malaysia (2001).
The following year, the Thaipusam festival in the Tamil month of Thai (which falls in late January/early February) has been celebrated there as the annual festival of Batu Caves. Woods which set to the Temple Cave were built in 1920 and have since been replaced by 272 concrete steps. In 1890, Pillai, who also founded the Sri Mahamariamman Temple, Kuala Lumpur, installed the murti (consecrated statue) of Sri Subramania Swamy in what is today known as the Temple Cave. Since 1892, the Thaipusam festival in the Tamil month of Thai (which falls in late January / early February) has been celebrated there. Religious Site Standing at 42.7 m (140 foot) high, the world’s tallest statue of Murugan, a Hindu deity, is located outside Batu Caves, near the city of Kuala Lumpur, Malaysia. The statue, which cost approximately 24 million rupees, is made of 1550 cubic metres of concrete, 250 tonnes of steel bars and 300 litres of gold paint brought in from neighboring Thailand. Rising almost 100 meters above the ground, the Batu Caves temple complex consists of three main caves and a few smaller ones. The biggest, referred to as Cathedral Cave or Temple Cave, has a 100 meter-‐high ceiling and features ornate Hindu shrines. To reach it, visitors must climb a steep flight of 272 steps. At the base of the hill are two more cave temples, Art Gallery Cave and the Museum Cave, both of which are full of Hindu statues and paintings. This complex was renovated and opened as the Cave Villa in 2008. Many of the shrines relate to the story of Lord Murugan’s victory over the demon Soorapadam. An audio tour is available to visitors. The Ramayana Cave is situated to the extreme left as one faces the sheer wall of the hill. On the way to the Ramayana Cave, there is a 50-‐feet (15 meters) tall statue of Hanuman and a temple dedicated to Hanuman, the noble monkey devotee and aide to Lord Rama. The consecration ceremony of the temple was held in November 2001, (Tourism Malaysia, 2001).
The Ramayana Cave depicts the story of Rama in a chronicle manner along the irregular walls of the cave. A 42.7-‐metre (140 feet) hight statue of Lord Muruga was unveiled in January 2006, having taken 3 years to construct. It is the tallest Lord Muruga statue in the world. The Sri Maha Mariamman Temple Dhevasthanam has an interesting history. It was founded by the late Kayarohanam Pillai Thamboosamy Pillai in 1873, one of the pioneer leaders of the Indian community in colonial Malaya. Born in 1850 in Singapore and educated at the Raffles Institution, Mr. K. Thamboosamy Pillai gained popularity and prominence through the course of his work as an interpreter and Assistant with the then senior lawyer, JG Davidson. His work took him to Kuala Lumpur, Malaya and during this course he discovered that a large number of Indians from South India had settled in a neighbouring state called Selangor.
railway authorities offered an alternative site for Mr. K. Thamboosamy’s worship house as they wanted an extension to their goods yard. With the permission of then Sultan Selangor, a small ‘attap’ temple was built in Jalan Bandar, Kuala Lumpur (presently known as Jalan Tun HS Lee). The Sultan of Selangor demarcated the temple land as ‘Land of the Indian Community’. Mr. Thamboosamy Pillai was a visionary man. In 1888, he transformed the ‘attap’ temple into a brick building with the support from the local community. People from all walks of life donated generously towards the temple building project. Mr. Thamboosamy Pillai became the first “Stanigar” (founder) of the Sri Maha Mariamman Temple Dhevasthanam in Malaysia, Tourism Malaysia (2001). The Sri Maha Mariamman Temple Dhevasthanam is administered by a group of learning and prominent Hindu devotees after the demise of the founder Sri K. Thamboosamy Pillai in 1902. On the 5th September 1928, a religious body was established to bring all the charitable organizations and the Mariamman Temple under this fold for a proper management and control. This case was submitted to the Supreme Court through civil action in 1928. After a long deliberation, the Selangor Supreme Court established the Religious Charity known as the Sri Maha Mariamman Temple Kuala Lumpur. Based on the Court order dated 28th November 1930, the Sri Maha Mariamman Temple, Kuala Lumpur, the Sri Ganesar Temple, Old Pudu Road and Sri Subramaniaswamy Temple Batu Caves came under the administration of the Board of Management of the Sri Maha Mariamman Temple Dhevasthanam. It was in this temple premises that the Malaysian Indian Congress Party (MIC) was first founded by the late Sir John Theviry, a prominent lawyer from Ipoh, Perak along with his close associates (Tourism Malaysia, 2001).
2. Research Metodology
The present study deployed a set of questionnaire consisted the structured questions of listed attributes. The questions were conducted in English language. The questionnaire had four sections, which includes: Section A (demographic), Section B (Marketing Mix), and Section C (Destination Image), and Section D (Overall satisfaction). The statistical package for social science (SPSS20) was used to analyse the data in this research. In order to conduct the research, the information collected from the visitors who visited Batu Caves (Creswell John, 2003), using the convenience sampling during the Thaipusam festival, Malaysian and International tourists visited Batu Caves to climb up its 272 steps and pray at its majestic temple. The survey has been distributed during November 2016. The survey covered the weekdays and weekends. Sampling design used for conducting this research was simple random sampling. Moreover, the questionnaire designed in two parts. Part A obtained information on the demographic profile of visitors, whilst Part B collected the information pertaining to the visitor satisfaction towards the tourism (McGraw-‐Hill, 1993). The questionnaire was judged by 3 scholars’ feedback to enhance it, and then distributed to local and international tourist visited Batu Caves (Krejcie, 2016; Morgan, 1970).
174
3. Result and Discussion
3.1 Respondent Profile
Item Frequency Percent
Gender Male 72 48.3
Female 77 51.7
Age Below 25 60 40.3
26-‐35 56 37.6
36-‐45 17 11.4
46-‐55 11 7.4
Over 55 5 3.4
Marital Status Single 34 56.4
Married 49 32.9
Others 15 10.1
Occupation Students 36 24.2
Government 18 12.1
Own Business 36 24.2
Private 29 19.5
Others 27 18.1
How often Visit 1st time 91 16.1
2nd 14 9.4
3rd 8 5.4
4th 4 2.7
5th 4 2.7
Others 28 18.8
Purpose of Visit Visiting 93 62.4
Leisure 22 14.8
Religious 33 22.1
Nationality Malaysian 52 34.9
Non-‐ Malaysian 97 65.1
Income Below $500 33 22.1
500 – 1000 13 8.7
1001 – 2000 28 13.8
2001 – 3000 23 15.4
3001 – 4000 19 12.8
Above 4000 21 14.1
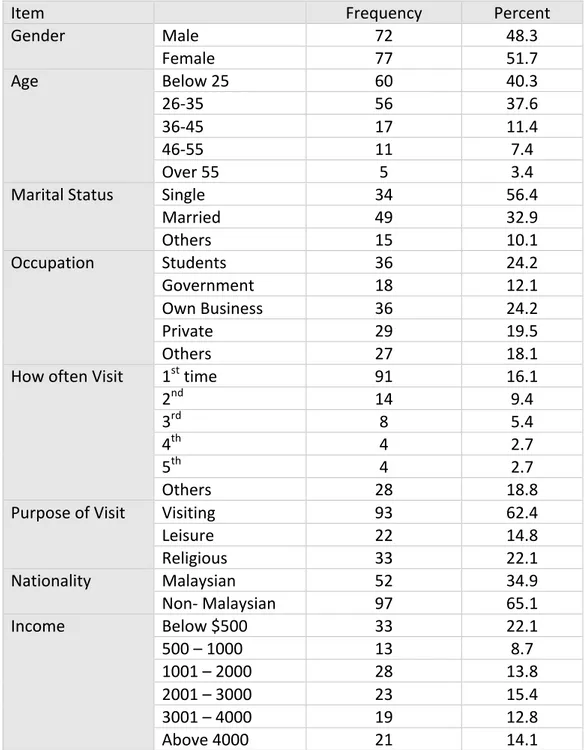
Table 1. Respondet profile Source: personal data
years old with 37.6%, 17 respondents in 36-‐45 years old with 11.4%, 11 respondents in 46-‐55 years old with 7.4% and 5 respondents in over 55 years old with 3.4%. 84 respondents are single with 56.4%, 49 respondents are married with 32.9%, and others 15 respondents with 10.1%. 36 respondents is students with 24.2%, 18 respondents work with government with 12.1%, 36 respondents is doing own business by 24.2%, 29 respondents is working in private with 19.5%, and others 27 respondents with 18.1%. 91 respondents are first time come to Batu Caves with 61.1%, 14 respondents come for second time to Batu Caves with 9.4%, 8 respondents come for third time with 5.4%, 4 respondents come for four times with 2.7% and 28 respondents come more than five times to Batu Caves with 18.8%. 93 respondents come to Batu Cave for visiting purpose with 62.4%, 22 respondent’s come for leisure purpose with 14.8%, and there is 33 respondents come for religious purpose with 22.1%. 97 respondents were international and 53 respondent’s is from Malaysia. 33 respondents getting below $500 with 22.1%, 13 respondents getting $500 -‐ $1000 with 8.7%, 28 respondents getting $1001-‐$2000 with 18.8%, 23 respondents getting $2001-‐$3000 with 15.4%, 19 respondents getting $3001 -‐ $4000 with 12.8% and 21 getting above $4001 with 14.1%.
3.2 Marketing Mix
The table below shows the visitor satisfaction for the product/ services in Batu Caves. The respondent satisfaction for Lord Muruga Statue 10 respondents are strongly disagree with 6.7%, 8 disagree with 5.4%, 24 neutral with 16.1%, 35 agree with 23.5% and 70 strongly agree with 47.0%. The respondent satisfaction for rock climbing is 1 respondent for strongly disagree with 0.7%, 10 respondents are disagree with 6.7%, 34 respondents are neutral with 22.8%, 49 respondents agree with 32.9% and 54 respondents strongly agree with 36.2%. The satisfaction for the art gallery cave are 3 of the respondents for strongly disagree with 2.0%, 8 of the respondents are disagree with 5.4%, 57 of the respondents are neutral with 38.3%, 53 of the respondents are agree with 35.6% and 26 of the respondents are strongly agree with 17.4%.The respondent satisfaction for the souvenir 10 respondents are strongly disagree with 6.7%, 13 respondents are disagree with 8.7%, 56 respondents are 59 neutral with 37.6 %, 47 respondents are agree with 31.5 % and 17 respondents are strongly disagree with 11.4 %.The restaurant’s service satisfaction for the respondents are 14 respondents are strongly disagree with 9.4%, 20 respondents are disagree with 13.4%, 63 respondents are neutral with 42.3%, 35 respondents are agree with 23.5% and 9 respondents are strongly agree with 6.0%.the price and promotion for the visitor satisfaction. The satisfaction for affordable price are 11 respondents for strongly disagree with 7.4%, 2 respondents are disagree with 1.3%, 45 respondents are neutral with 30.2%, 52 respondents are agree with 34.9% and 38 respondents strongly agree with 25.5%.
176
agree with 15.4%. The satisfaction of the respondent for the discount are for the museum are 10 respondents for strongly disagree with 6.7%, 9 respondents are disagree with 6.05%, 74 respondents are neutral with 49.7%, 37 respondents are agree with 24.8% and 14 respondents strongly agree with 9.4%.
For promotion, the satisfactions for museum / caves are 4 respondents are strongly disagree with 2.7%, 14 respondents are disagree with 9.4%, 56 respondents are neutral with 37.6%, 52 respondents are agree with 34.9% and strongly agree with 12.1%. The satisfaction of the sweets and Indian food are 4 respondents strongly disagree with 2.7%, 18 respondents are disagree with 12.1%, 59 respondents are neutral with 39.6%, 39 respondents are agree with 26.2% and 24 respondents strongly agree with 26.2%. The satisfaction about the strategic location are 2 respondents for strongly disagree with1.3%, 4 respondents are disagree with 2.7%, 29 respondents are neutral with 19.5%, 57 respondents are agree with 38.3% and 55 respondents strongly agree with 36.9%. The satisfaction of the landscape are 2 respondents are strongly disagree with 1.3% and also 2 respondents are disagree with 1.3%, 24 respondents are neutral with 16.1%, 66 respondents are agree with 44.3% and 53 respondents are strongly agree with 35.6%. The satisfaction for the enough parking area in Batu Caves are 3 respondents responds for strongly disagree with 2.0%, 7 respondents respond for disagree with 4.7%, 42 respondents are have respond for neutral with 28.2%, 54 respondents respond for agree with 36.2% and 36 respondents are having respond for strongly disagree with 24.2%. Nearby food and beverage centre in Batu Caves 3 respondents are strongly disagree with 2.0%, 5 respondents are responded for disagree with 3.4%, 51 respondents are respond for neutral with 34.2%, 54 respondents are agree with 36.2% and 33 respondents are respond for strongly agree with 22.1%. Convenient public transportation in Batu Caves 3 respondents are strongly disagree with 2.0%, 5 respondents are disagree with 3.4%, 24 respondents are responding for neutral with 16.1%, 55 respondents are agree with 36.9% and 61 respondents are responding for strongly agree with 40.9%. Convenient of financial use (ATM) in Batu Caves 17 respondents are strongly disagree with 11.4%, 19 respondents are respond for disagree with 12.8%, 55 respondents are neutral with 36.9%, 35 respondents are respond for agree with 23.5% and 17 respondents strongly agree with 11.4%. Batu Caves is nearby to highway, 4 respondents are respond for strongly disagree with 2.7%, 2 respondents are disagree with 1.3%, 39 respondents are neutral with 26.2%, 52 respondents are respond for agree with 34.9% and 47 respondents are respond for strongly agree with 31.5%.
1 2 3 4 5
Product
Lord Muruga statue 6.7 5.4 16.1 23.5 47.0 Rock Climbing (272 Stairs) 0.7 6.7 22.8 32.9 36.2
Art Gallery Caves 2.0 5.4 38.3 35.6 17.4
Souvenirs 6.7 8.7 37.6 31.5 11.4
Restaurants Services 9.4 13.4 42.3 23.5 6.0
Rest Place 6.0 19.5 36.2 22.1 14.1
Price
Value for Money 3.4 4.7 37.6 34.9 18.8
Acceptable Price 4.0 4.0 35.6 34.9 18.8
Discount rate 6.7 6.0 49.7 24.8 9.4
Promotion
Museum/Cave 2.7 12.1 39.6 26.2 16.1
Sweet and Indian Food 2.7 12.1 39.6 26.2 16.1
Place
Strategic Location 1.3 2.7 19.5 33.3 36.9
Landscape 1.3 1.3 16.1 44.3 35.6
Parking lots 2.0 4.7 28.2 36.2 24.2
Nearby F&B Centres 2.0 3.4 34.2 36.2 22.1
Transportation 2.0 3.4 16.1 36.9 40.9
ATM 11.4 12.8 36.9 23.5 11.4
Nearby Highway 2.7 1.3 26.2 34.9 31.5
Table 2. Marketing Mix Source: personal data.
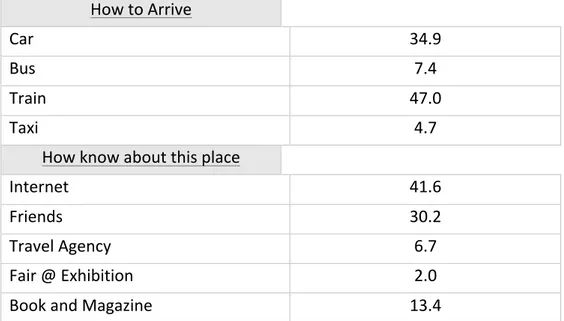
Table 3 explains the destination image of Batu Caves. 52 respondents with 34.9% arrived by car, 11 respondents with 7.4% by bus, 70 respondents with 47.0% by train, 7 respondents with 4.7% by taxi and 8 respondents with 5.4% are others. Where did tourists hear about this tourist destination. First is 62 respondents with 41.6% from internet or media, 45 respondents with 30.2% from friends and relatives, 10 respondents with 6.7% from travel agencies, from fair and exhibition are 3 respondents with 2.0%, books and guides are 20 respondents with 13.4%, there are also got from travel package which is 4 respondents with 2.7%, from flight information have 2 respondents with 1.3%, also from brochure have 1 respondents with 0.7% and last one is from magazine which is 2 respondents with 1.3%.
How to Arrive
Car 34.9
Bus 7.4
Train 47.0
Taxi 4.7
How know about this place
Internet 41.6
Friends 30.2
Travel Agency 6.7
Fair @ Exhibition 2.0
Book and Magazine 13.4
Table 3. Destination Image Source: personal data.
178
Table 4 shows about respondents’ feedback on Batu Caves as a favourable destination image. It shows that got 7 or 0.7% respondents strongly disagree and there are 3 respondents which is 0.3% are disagree and also got 35 respondents with 35% that giving neutral respond. 61 respondents with 40.9% are agree and 49 else with 32.9% are strongly agree. Respondents that disagree that Batu Caves have a positive destination image are 4 respondents with 2.7% and there are 23 respondents with 15.4% that give neutral respond. 80 respondents with 53.7% are agree with it and there are 42 respondents with 28.2% that strongly agree. The respondents respond for the local people are friendly to tourist are 2 respondents with 1.3% strongly disagree, 8 respondents with 5.4% are disagree, 30 respondents with 20.1% are neutral respond, 64 respondents are agree with 43.0% and more 43 respondents with 28.9% are strongly agree.
Batu Caves has a unique religious destination image. 1 respondent strongly disagree with 0.7%, 7 respondents with 4.7% disagree, 31 respondents are neutral with 20.8%, 52 respondents with 34.9% are agree and 56 respondents are strongly disagree with 37.6%. Religious tourism is the image come to mind when you think of Batu Caves and 2 respondents are strongly disagree with 1.3% followed by 4 respondents with 2.7%that disagree, 31 respondents are neutral with 20.8%, respondents that agree are 52 respondents with 34.9% and 59 respondents are strongly agree with 39.6%. Overall, visiting Batu Caves has been very valuable for you and 6 respondents with 4.0% are disagree, 29 respondents with 19.5% are neutral respond, 54 respondents are agree with 36.2% and 59 respondents with 39.6% are strongly agree with this.
Item 1 2 3 4 5
Favorable overall destination image 0.7 2.0 23.5 40.9 2.9 Positive Destination Image 0 2.7 15.4 53.7 28.2 Friendly Local People 1.3 5.4 20.1 43.0 28.9
Unique Place 0.7 4.7 20.8 34.9 37.6
Religious Destination Image 1.3 2.7 20.8 34.9 39.6
Valuable Visit 0 4.0 19.5 36.2 39.6
Table 4. Tourist Satisfaction Source: personal data.
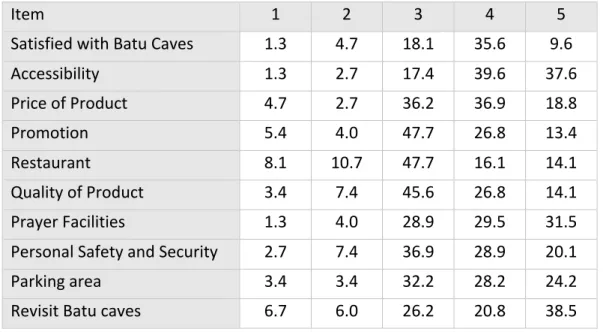
I am satisfied with the promotion, 8 respondents respond for strongly disagree with 5.4%, 6 respondents with 4.0% disagree, 71 respondents with 47.7% respond neutral, 40 respondents with 26.8% agree and 20 respondents with 13.4% are strongly agree. I am satisfied with the restaurants, 12 respondents with 8.1% are strongly disagree, 16 respondents disagree with 10.7%, neutral respond are 71 respondents with 47.7%, 24 respondents with 16.1% are agree and 21 respondents with 14.1% are strongly agree. I am satisfied with the quality of product, 5 respondents respond for strongly disagree with 3.4%, 11 respondents that disagree with 7.4%, 68 respondents respond neutral with 45.6%, 40 respondents with 26.8 are agree and 21 respondents with 14.1% are strongly agree.
I am satisfied with the prayer facilities, 2 respondents are strongly disagree with 1.3%, 6 respondents are disagree with percent of 4.0%, 43 respondents are respond for neutral with 28.9%, 44 respondents with 29.5% are agree and 47 respondents with 31.5% are agree. I am satisfied with personal safety and security, 4 respondents strongly disagree with 2.7%, 11 respondents with 7.4% are disagree, 55 respond neutral with 36.9%, 43 respondents respond agree with 28.9% and 30 respondents strongly agree with percent of 20.1%. I am satisfied with the parking area at Batu Caves, 5 respondents respond strongly disagree with 3.4%, 5 respondents with 3.4% disagree, 48 respondents respond neutral with 32.3%, 42 respondents with 28.2% agree and 36 respondents are strongly agree with 24.2%. Lastly, I am planning to come and re – visit Batu Caves, 10 respondents are strongly disagree with 6.7%, 9 respondents respond disagree with 6.0%, 39 respondents are respond neutral with 26.2%, 31 respondents with 20.8% are agree and 57 respondents respond for strongly agree with 38.3%. See table 5 below.
Item 1 2 3 4 5
Satisfied with Batu Caves 1.3 4.7 18.1 35.6 9.6
Accessibility 1.3 2.7 17.4 39.6 37.6
Price of Product 4.7 2.7 36.2 36.9 18.8
Promotion 5.4 4.0 47.7 26.8 13.4
Restaurant 8.1 10.7 47.7 16.1 14.1
Quality of Product 3.4 7.4 45.6 26.8 14.1
Prayer Facilities 1.3 4.0 28.9 29.5 31.5
Personal Safety and Security 2.7 7.4 36.9 28.9 20.1
Parking area 3.4 3.4 32.2 28.2 24.2
Revisit Batu caves 6.7 6.0 26.2 20.8 38.5
Table 5. Tourist Overall Satisfaction Source: personal data.
180
central tendency (Cavana and Delahaye, 2001; Pallant, 2010). Standard deviation is used commonly measure of dispersion for this study.
Descriptive Statistics
N Minimum Maximum Mea
n Deviation Std.
Landscape 147 1.00 5.00 4.12 .829
Convenient public
transportation 148 1.00 5.00 4.12 .939
Place (strategy location) 147 1.00 5.00 4.08 .895 Product/service (Lord
Muruga Statue) 147 1.00 5.00 4.00 1.216
Rock climbing (272 stairs) 148 1.00 5.00 3.97 .965
Nearby to highway 144 1.00 5.00 3.94 .951
Enough parking area 142 1.00 5.00 3.79 .949
Nearby food and beverage
center 146 1.00 5.00 3.74 .915
Price (affordable) 148 1.00 5.00 3.70 1.097
Art gallery caves 147 1.00 5.00 3.61 .909
Value for money 148 1.00 5.00 3.61 .958
Acceptable rate 144 1.00 5.00 3.58 .949
Promotion (museum/cave) 144 1.00 5.00 3.45 .930
Sweets and Indian food 144 1.00 5.00 3.42 1.000
Souvenir 143 1.00 5.00 3.33 1.034
Discount rate (museum) 144 1.00 5.00 3.25 .964
There are Some Places for
Tourists to Rest 146 1.00 5.00 3.19 1.103
Convenient for Financial
Use (ATM) 143 1.00 5.00 3.11 1.151
Restaurant's service 141 1.00 5.00 3.03 1.024
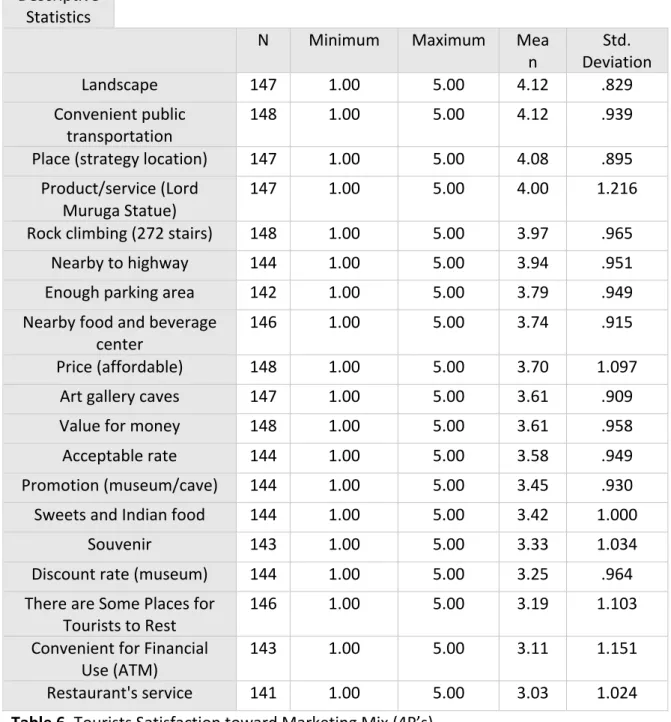
Table 6. Tourists Satisfaction toward Marketing Mix (4P’s) Source: personal data.
caves is nearby to highway, 3.79 shows that Batu Caves has enough parking area, 3.74 show that Batu Caves is nearby to food and beverages center, 3.70 shows that Batu Caves has affordable price, 3.61 shows tourist satisfied with the Art Gallery Caves, 3.61 shows that price is value for money, 3.58 shows that price is acceptable rate, 3.45 shows that promotion in Museum/Caves, 3.42 shows that tourist satisfied with the sweets and Indian food in Batu Caves, 3.33 shows for the souvenir, 3.25 shows that museum have discount rate, 3.19 shows that Batu Caves has place for rest and 3.11 shows that tourist convenient for financial use (ATM)
Descriptive Statistics
N Minimum Maximum Mea
n Deviation Std. Overall, visiting batu caves has
been very valuable to me 148 2.00 5.00 4.12 .864
Religious destination image come to my mind when thinking about batu caves
148 1.00 5.00 4.09 .913
I think most have a positive
destination image 149 2.00 5.00 4.07 .736
Unique destination image 147 1.00 5.00 4.05 .919
Batu caves have a favorable
overall destination image 149 1.00 5.00 4.03 .841
Local people are friendly to
tourist 147 1.00 5.00 3.93 .915
Where did you hear about this
tourist destination 149 1.00 9.00 2.40 1.815
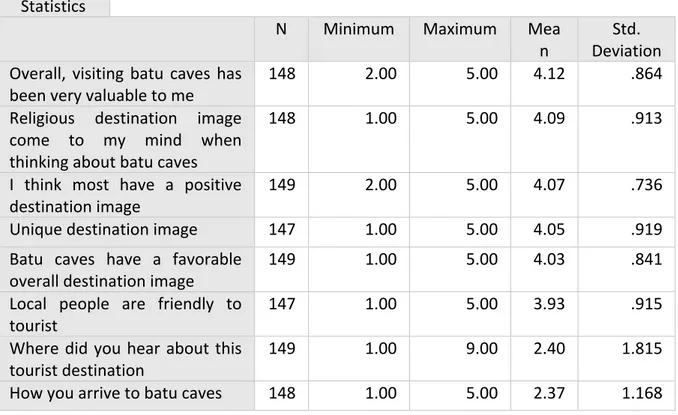
How you arrive to batu caves 148 1.00 5.00 2.37 1.168 Table 7. Destination Image of Batu Caves
Source: personal data.
The highest mean point for destination image of Batu Caves is 4.12 which is visiting Batu Caves has been very valuable to the tourist, 4.09 for religious destination image come to my mind when think about Batu Caves, 4.07 for I think most have a positive destination image, 4.05 for unique destination image, 4.03 for Batu Caves have a favorable overall destination image, 3.93 for local people are friendly to tourist, 2.40 for tourist hear about this tourist destination, and 2.37 is for how tourist arrived to Batu Caves.
182 Descriptive
Statistics
N Minimum Maximum Mea
n Deviation Std.
Accessibility to Batu Caves 147 1.00 5.00 4.10 .884
Parking area 137 1.00 5.00 4.10 4.495
I Am Satisfied with Batu Caves 148 1.00 5.00 4.08 .944
Prayer facilities 142 1.00 5.00 3.90 .962
Planning to Come and Revisit
Batu Caves 146 1.00 5.00 3.79 1.220
Price of Product 148 1.00 5.00 3.62 .977
Personal Safety and Security 143 1.00 5.00 3.58 .995
Quality of Product 145 1.00 5.00 3.42 .947
Promotion 145 1.00 5.00 3.40 .967
Restaurant 144 1.00 5.00 3.18 1.081
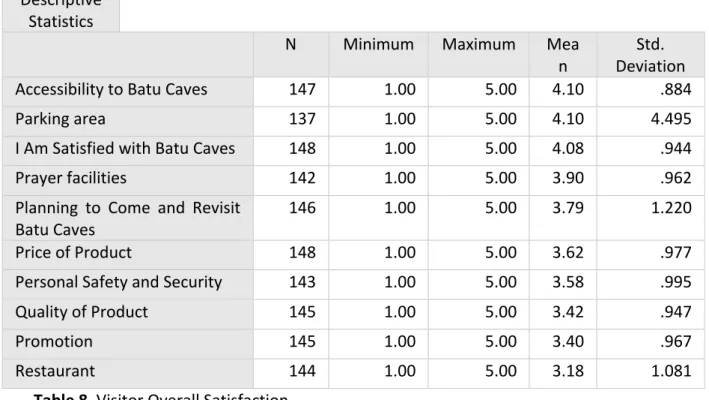
Table 8. Visitor Overall Satisfaction Source: personal data.
The highest mean point 4.10 of visitor overall satisfaction is for accessibility to Batu Caves, 4.10 for parking area, 4.08 for i am satisfied with Batu Caves, 3.90 for prayer facilities, 3.79 for planning to come and revisit Batu Caves, 3.62 for the price of the product, 3.58 personal safety and security, 3.42 the quality of product, 3.40 for promotion and 3.18 for restaurant.
3.3 Response Rate
The data gathered from the visitors at Batu Caves. Data collection was conducted during the month of November 2016. This survey was distributed to the visitors at Ramayana Caves, Dark Caves, Cathedral Cave or Temple Cave, all temples’, restaurants, Batu Caves train station, and also the stairs. This research employed the internet consistency technique to test the scale reliability for Batu Caves for dimensions with 38 items Cronbach (1951), Cortina (1993), Henson (2001), Hair et al. (2006) (Drost, 2011, Cronbach and Shavelson, 2004). As shown in Table Cronbach alpha value for the Marketing Mix of Batu Caves as a religious destination is below:
Reliability Statistics
Cronbach's Alpha Cronbach's Alpha Based
on Standardized Items N of Items
.865 .917 38
Conclusion
This research was motivated by Batu Caves as one of the unique religious attractions in Malaysia. This attraction holds one of the famous celebrations of Thaipusam. The aim of this research was to study the visitor satisfaction towards marketing mix (4P’s) and destination image of Batu Caves, and if the tourists meet the travel expectations during their visit and overall satisfaction. The results concluded that, most of the respondents were satisfied with the Batu Caves marketing 4Ps; Product (Lord Muruge Statue, Rock Climbing, Art Gallery, Souvenirs, Restaurant, and Rest Places), Price (Affordable Price, Value for Money, Acceptable Price, Discount Rate), Place (Strategic Location, Landscape, Parking Lots, Nearby Highway, Transportation, ATM), Promotion (Museum/Cave, Indian food and sweet). The majority came by car or train, and they know about the destination from their friends or the internet. Most of the tourists and visitors had a favorable overall destination image, visiting this unique religious place and mentioning that their visit was valuable. Tourists and visitors were overall satisfied with Batu Caves, but some of the tourists mentioned their negative feeling about the destination due to the maintenance activities and covering the lord Murugan Statue other than closing some attraction parts and services. Recommendations were made to increase the awareness and marketing campaign to attract more tourists, especially during the holy Thaipusam celebration.
184
References
Batu Caves., 2016, (September 24). In Wikipedia, The Free Encyclopedia. Retrieved September 24, 2016,
https://En.Wikipedia.Org/W/Index.Php?Title=Batu_Caves&Oldid=740889881
Banyai, M. (2009). The Image of Tourism Destinations: A Case of Dracula Tourism.
Borden, N. H. (1964). The concept of the marketing mix. Journal of advertising
research, 4(2), 2-‐7.
Business dictionary (2016). Marketing Concept. Retrieved November 06, 2016, From
Http://Www.Businessdictionary.Com/Definition/Marketing-‐Concept.Html
Chon, K. S. (1991). Tourism destination image modification process: Marketing implications. Tourism management, 12(1), 68-‐72.
Chon, K. S. (1992). Self-‐image/destination image congruity. Annals of Tourism Research, 19(2), 360-‐363.
Chon, K. S. (1990). The role of destination image in tourism: A review and discussion.
The tourist review, 45(2), 2-‐9.
Echtner, C. M., & Ritchie, J. B. (1991). The meaning and measurement of destination image. Journal of tourism studies, 2(2), 2-‐12.
Gallarza, M. G. , Saur a, I . G., & Garcı́ a, H. C. (2002). Destination image: Towards a conceptual framework. Annals of tourism research, 29(1), 56-‐78.
Gartner, W.C. (1993). Image formation process. Journal of Travel and Tourism
Marketing, 2(2/3), 191-‐216.
Govers, R., Go, F. M., & Kumar, K. (2007). Promoting tourism destination image. Journal
of Travel Research, 46(1), 15-‐23.
He, Y., & Day, J. (2011). Impact of Visitation on Destination Image: Examination of
Chinese tourists visiting New York City.
Kasim, A. (2011). Balancing tourism and religious experience: Understanding devotees' perspectives on Thaipusam in Batu Caves, Selangor, Malaysia. Journal of Hospitality
Marketing & Management, 20(3-‐4), 441-‐456.
Kotler, P. (2000). Marketing Management, 10th Ed., Upper Saddle River, N.J: Prentice-‐ Hall.
Li, X., Petrick, J. F., & Zhou, Y. (2008). Towards a conceptual framework of tourists' destination knowledge and loyalty. Journal of Quality Assurance in Hospitality &
Tourism, 8(3), 79-‐96.
Martyn Shuttleworth., 2008. Quantitative Research Design. Retrieved Nov 03, 2016 From Explorable.Com: Https://Explorable.Com/Quantitative-‐Research-‐Design.
Maslow, A. H. (2000). Motivation and Personality. Pearson Education Asia.
McCarthy, E. J. (1960). Basic Marketing: A Managerial Approach. R.D. Irwin.
Mill, R. C., & Morrison, A. M. (2002). The Tourism System. Kendall/Hunt Pub, Fifth Edition.
Pearce, P. L. (1982). Perceived changes in holiday destinations. Annals of tourism
research, 9(2), 145-‐164.
Raj, R. & Morpeth, N. D. (2007). Religious Tourism and Pilgrimage Festivals
Management: An International Perspective. CABI Pub.
Rittichainuwat, B., Qu, H., & Brown, T. (2001). Thailand's international travel image: mostly favorable. The Cornell Hotel and Restaurant Administration Quarterly, 42(2), 82-‐ 95.
Robin Nunkoo, Dogan Gursoy, Haywantee Ramkissoon., 2013. Developments in Hospitality Marketing and Management: Social Network Analysis and Research Themes. Journal of Hospitality Marketing & Management 22(3), 269-‐288.
Singh, I. (2004). Sikh Pilgrimage: a study of ambiguity, Sikh Spectrum, May 16, Available at www.sikhspectrum.com (accessed March 9, 2016).
Stoicheff, B. P. & Canada, N. R. C. (2002). Gerhard Herzberg: An Illustrious Life in
Science. NRC Press.
Swarbrooke, J., Horner, S. (2007). Consumer Behavior (Second Edition). London; Burlington, MA: Butterworth-‐Heinemann.
Tasci, A. D., & Gartner, W. C. (2007). Destination image and its functional relationships.
Journal of travel research, 45(4), 413-‐425.
Tasci, A. D., Gartner, W. C., & Tamer Cavusgil, S. (2007). Conceptualization and operationalization of destination image. Journal of hospitality & tourism
research, 31(2), 194-‐223.
186
Http://Www.Tinet.Ita.Doc.Gov/Outreachpages/Download_Data_Table/2009_China_M arket_Profile.Pdf
U.S. Department Of Commerce, Ita, Office Of Travel And Tourism Industries., 2008.
Www.Tourism.Gov.My/About-‐Us/About-‐Tourism-‐Malaysia
Wikipedia., 2016. Marketing. Retrieved October 17, 2016, From
Https://En.Wikipedia.Org/W/Index.Php?Title=Marketing&Oldid=744728115
Wikipedia., 2016. Tourism. Retrieved 14:30, October 17, 2016, From
Https://En.Wikipedia.Org/W/Index.Php?Title=Tourism&Oldid=744801932