CELLULAR & MOLECULAR BIOLOGY LETTERS http://www.cmbl.org.pl
Received: 07 January 2008 Volume 13 (2008) pp 599-613 Revised form accepted: 28 April 2008 DOI:10.2478/s11658-008-0025-6 Published online: 18 July 2008 © 2008 by the University of Wrocław, Poland
§These authors contributed equally to this study
* Author for correspondence. e-mail: kajsa.sjoholm@medic.gu.se, tel.: +46 31 3423029, fax +46 31 418527
Abbreviations used: 15d-PGJ2 – 15-deoxy-12,14-prostaglandin J2; AKR1C3 –
aldoketoreductase 1C3; BMI – body mass index; HDL –high density lipoprotein; hs-CRP – high sensitivity C-reactive protein; LDL – low density lipoprotein; om –omental; PPARγ
– peroxisome proliferator-activated receptor-gamma; sc – subcutaneous; VLCD – very low calorie diet; WHR – waist-to-hip ratio
Research article
REGULATION OF HUMAN ALDOKETOREDUCTASE 1C3 (AKR1C3) GENE EXPRESSION IN THE ADIPOSE TISSUE
PER-ARNE SVENSSON§, BRITT G. GABRIELSSON§, MARGARETA
JERNÅS, ANDERS GUMMESSON and KAJSA SJÖHOLM*
Sahlgrenska Center for Cardiovascular and Metabolic Research, Department of Molecular and Clinical Medicine, Institute of Medicine, Sahlgrenska Academy
at the University of Gothenburg, SE-413 45 Gothenburg, Sweden
(p < 0.001 at all time-points). The gene expression of AKR1C3 correlated with both adipose tissue mRNA levels and serum levels of leptin before the start of the diet (p < 0.05 and p < 0.01, respectively). Furthermore, large adipocytes displayed a higher expression of AKR1C3 than small adipocytes (1.5-fold, p < 0.01). In conclusion, adipose tissue AKR1C3 expression may be affected by metabolic disease, and its levels are significantly reduced in response to diet-induced weight loss and correlate with leptin levels.
Key words: Metabolic syndrome, Adipose tissue, Adipocytes, Diet-induced weight loss, Aldoketoreductase 1C3, 15-deoxy-12,14-prostaglandinJ
2
INTRODUCTION
The metabolic syndrome is a cluster of risk factors that together increase the risk of the development of cardiovascular diseases. Obesity is recognized as a major driver of the metabolic syndrome, and voluntary weight-loss improves metabolic function and reduces overall mortality [1, 2]. However, some obese subjects remain healthy for relatively long periods of time. The reason for this apparent resistance is unknown.
Adipose tissue was once considered to be a passive storage depot, releasing energy as fatty acids and glycerol in times of fasting or starvation. During the last decade, it became apparent that adipocytes are active endocrine cells that secrete important hormones, cytokines, vasoactive substances and other peptides with potential roles in the development of metabolic disease [3]. It is well known that the accumulation of visceral fat is strongly associated with metabolic disease, independent of the total adipose tissue mass [4-7]. This suggests functional differences between the adipose tissue depots. It has been shown that visceral adipocytes are less responsive to the antilipolytic effects of insulin and more sensitive to adrenergic lipolysis [8]. Researchers including ourselves have previously shown that a number of genes display different expression levels between the subcutaneous (sc) and the visceral depots [9-11]. One gene which has been shown in several studies to be expressed at higher levels in sc adipose tissue is aldoketoreductase 1C3 (AKR1C3; also known as type 5 17β-hydroxysteroid dehydrogenase; 17β-HSD-5) [12-15].
AKR1C3 is a multifunctional enzyme that is able to metabolize a diverse array of substrates, including various types of hydroxysteroids [16, 17]. However, AKR1C3 also participates in prostaglandin metabolism, and plays a suppressive role in the formation of endogenous ligands (15-deoxy-12,14-prostaglandin J2;
15d-PGJ2) for the nuclear receptor peroxisome proliferator-activated
receptor-gamma (PPARγ) [18]. PPARγ plays a pivotal role in adipocyte differentiation and is also a target for insulin-sensitizing drugs [19]. It has been shown that all the enzymes required for the synthesis of 15d-PGJ2 are expressed in human
The aim of this study was to characterize the expression of AKR1C3 in human adipose tissue and adipocytes, and to investigate its potential role in the metabolic syndrome.
MATERIALS AND METHODS
Subjects and samples
During a diet-induced weight loss study, abdominal sc adipose tissue biopsies and fasting blood samples were obtained from 6 obese women and 18 men before (week 0), during (weeks 8 and 16) and after (week 18) treatment with a very low calorie diet (VLCD; 450 kcal as 8 g fat, 51 g protein, and 50 g carbohydrate per day).The subjects were on the VLCD for 16 weeks, then a normal diet was gradually re-introduced [20-22]. For the baseline analysis, the subjects were also divided into two groups: those who were healthy obese and those who were obese with the metabolic syndrome (Tab. 1). The metabolic
Tab. 1. The patient characteristics of the subjects included in the microarray analysis (means ± SD).
Wk 0 Wk 8 Wk 16 Wk 18
Gender (male/female) MetS 9/3 Non-MetS 9/3 Age (years; min-max) MetS 51 (28-61)
Non-MetS 45 (29-59)
BMI (kg/m2) MetS 37.7 ± 5.2 31.6 ± 4.5 28.4 ± 4.6 28.7 ± 4.2
Non-MetS 37.6 ± 4.8 32.0 ± 3.9 28.9 ± 3.7 29.0 ± 3.7 Waist (cm) MetS 122 ± 12 108 ± 12 98 ± 12 99 ± 11
Non-MetS 124 ± 13 112 ± 13 103 ± 14 103 ± 14 WHR MetS 1.0 ± 0.08 0.98 ± 0.08 0.95 ± 0.07 0.95 ± 0.06
Non-MetS 1.0 ± 0.08 0.99 ± 0.08 0.95 ± 0.09 0.96 ± 0.10 Systolic BP (mmHg) MetS 147 ± 17 123 ± 12 120 ± 12 131 ± 14
Non-MetS 129 ± 12 118 ± 12 114 ± 16 117 ± 15 Diastolic BP (mmHg) MetS 91 ± 16 74 ± 9.4 71 ± 9.9 77 ± 13
Non-MetS 86 ± 10 77 ± 12 73 ± 12 75 ± 11 Fasting Glucose (mmol/l) MetS 6.9 ± 1.8 4.6 ± 0.74 4.6 ± 0.92 5.4 ± 1.2
Non-MetS 5.1 ± 0.58 4.5 ± 0.61 4.4 ± 0.35 4.5 ± 0.32 OGTT 2h Glucose (mmol/l) MetS 11 ± 3.2 8.1 ± 2.0 7.7 ± 2.9 7.0 ± 2.7
Non-MetS 5.4 ± 1.5 6.0 ± 1.2 6.2 ± 2.0 4.9 ± 0.88 LDL Cholesterol (mmol/l) MetS 3.6 ± 1.0 2.1 ± 0.83 2.5 ± 0.79 3.0 ± 0.71 Non-MetS 3.7 ± 1.0 2.4 ± 0.76 2.6 ± 0.49 2.8 ± 0.65 HDL Cholesterol (mmol/l) MetS 1.4 ± 0.41 1.2 ± 0.32 1.4 ± 0.39 1.4 ± 0.29 Non-MetS 1.3 ± 0.36 1.2 ± 0.26 1.3 ± 0.35 1.4 ± 0.29 Triglycerides (mmol/l) MetS 2.2 ± 1.3 0.97 ± 0.21 0.83 ± 0.20 1.3 ± 0.46 Non-MetS 1.4 ± 0.29 1.1 ± 0.26 0.99 ± 0.23 1.1 ± 0.53 Insulin (mU/l) MetS 15 ± 6.5 5.3 ± 1.9 3.7 ± 1.4 6.2 ± 3.7
syndrome was diagnosed according to the World Health Organization (WHO) definition [23], in which there is a requirement for type 2 diabetes, insulin resistance or impaired glucose tolerance, and two of the following conditions: hypertension, dyslipidaemia, central obesity or microalbuminuria.
For the real-time PCR study, abdominal sc adipose tissue biopsies were obtained from 4 obese men and 8 obese women without the metabolic syndrome and 5 obese men and 7 obese women with the metabolic syndrome. For the details of the study, see the previous report by Torgerson et al. [24]. The patient characteristics for the subjects included in this study are shown in Tab. 2. The ethical review board at the University of Gothenburg approved all of the studies, and all participants gave their written informed consent.
Tab. 2. Subjects included in the real-time PCR analysis of AKR1C3 (mean ± SD), n = 12 except for HDL in the Metabolic syndrome group where n = 11.
Healthy Metabolic syndrome
Gender (male/female) 4/8 5/7
Age 47.4 ± 9.7 49.5 ± 7.6
BMI (kg/m2) 41.0 ± 5.4 42.5 ± 7.3
Waist 119 ± 15 127 ± 17.
WHR 0.96 ± 0.12 1.04 ± 0.06
Fasting glucose (mmol/l) 3.9 ± 0.6 8.4 ± 2.7 Fasting insulin (mU/l) 23.7 ± 14.9 30.0 ± 13.5 Systolic BP (mmHg) 130 ± 16 134 ± 18 Diastolic BP (mmHg) 82 ± 11 83 ± 14 Cholesterol (mmol/l) 5.7 ± 1.5 5.6 ± 0.6 HDL Cholesterol (mmol/l) 1.3 ± 0.4 1.1 ± 0.2 Triglycerides (mmol/l) 1.9 ± 0.7 2.4 ± 1.4
Tissue distribution analysis
AKR1C3 gene expression in different human tissues was assessed using DNA microarray expression profiles. Affymetrix U133 Plus 2.0 DNA microarray expression profiles were downloaded from the Gene Expression Omnibus database (GEO accession No. GSE3526; http://www.ncbi.nlm.nih.gov/geo/). This dataset contains 353 expression profiles from 65 human tissues (3-9 replicates from different individuals per tissue). AKR1C3 expression was investigated using the 209160_at probe-set.
RNA isolation
DNA microarray analysis
For the diet and adipocyte size studies, cRNA was prepared and hybridized as recommended in the Affymetrix Gene Chip Expression Analysis manual. Briefly, biotin-labeled target cRNA was prepared by in vitro transcription (Enzo Diagnostics, Farmingdale, NY, USA) and hybridized to Human Genome U133A DNA microarrays (Affymetrix, Santa Clara, CA, USA) according to the Minimum Information About a Microarray Experiment (MIAME) guideline [26]. DNA microarrays were scanned with a confocal laser scanner (GeneArray scanner36 G2500A Hewlett Packard, Palo Alto, CA, USA). In the diet study, the scanned output files were analyzed with Affymetrix Microarray Suite Version 5.0 (MAS 5.0) software as previously described [27]. The raw data was globally scaled to an arbitrary target intensity value of 100.
For the adipocyte size study, DNA microarray data was analyzed using Weighted Analysis of Microarray Experiments (WAME) as previously described [28]. AKR1C3 expression was analyzed using the 209160_at probe-set.
RT-PCR analysis
Reagents for the real-time PCR analysis of AKR1C3 (Hs00366267_m1) and LRP10 (Assays-on-Demand, TaqMan Reverse Transcriptase reagents, and TaqMan UniversalPCR Master mix) were purchased from Applied Biosystems (FosterCity, CA, USA). The conditions used were as per the manufacturer’s protocol. cDNA synthesis was performed ina total reaction volume of 50 µl using 1000 ng total RNA.cDNA corresponding to 10 ng RNA per reaction was used for real-timePCR amplification. The amplification and detection of specific products was performed with the ABI PRISM 7900HT Sequence Detection System(Applied Biosystems) using the default cycle parameters. A standard curve was plotted for each primer-probe set with a serial dilution of pooled adipose tissue cDNA. Human LRP10 [29] was usedas a reference to normalize the expression levels between the samples.All the standards and samples were analyzed in triplicate.
Statistical analysis
RESULTS
AKR1C3 expression is reduced during diet-induced weight loss
Weight-loss is associated with an improvement in the metabolic parameters [1]. Obese subjects were on a 16-week VLCD (450 kcal/day) followed by two weeks of gradual reintroduction of normal food. The average weight loss was 27 kg. This diet-induced weight loss resulted in a reduced expression of AKR1C3 in the sc adipose tissue after 8 weeks and 16 weeks of VLCD compared to the baseline levels (p < 0.001 and p < 0.001, respectively; Fig. 1). The AKR1C3 expression levels also remained significantly reduced after the two weeks (week 18) of gradual normal food reintroduction (p < 0.001; Fig. 1), as determined by DNA microarray analysis.
Fig. 1. The expression of AKR1C3 in sc adipose tissue during diet-induced weight-loss analyzed using DNA microarrays. Obese subjects (n = 24) were put on a VLCD for 16 weeks followed by a two-week gradual re-introduction of a normal diet. The data is presented as means ± SEM.
Subjects with the metabolic syndrome have lower expression levels of AKR1C3
Fig. 2. AKR1C3 expression in sc adipose tissue in obese subjects with or without the metabolic syndrome. AKR1C3 expression was analyzed in two groups of subjects using DNA microarray (A) and RT-PCR (B). The data is presented as means ± SEM.
Correlations between AKR1C3 expression and metabolic parameters
To further investigate the potential link between adipose AKR1C3 and metabolic disease, baseline AKR1C3 expression levels in the subjects participating in the dietary study were correlated to anthropometric and biochemical parameters relevant to the metabolic syndrome (Tab. 1). There was no correlation of baseline AKR1C3 gene expression with fasting levels of insulin or glucose, the homeostasis model assessment of insulin resistance (HOMA), triglyceride levels, high density lipoprotein (HDL) cholesterol levels and total cholesterol levels, body mass index (BMI) or waist-to-hip ratio (WHR).
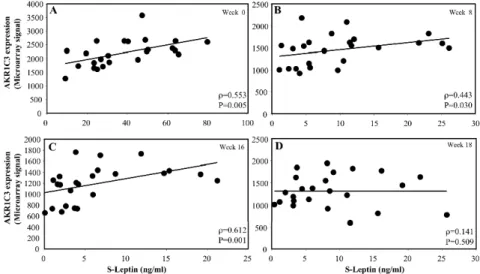
Fig. 4. Correlations between leptin expression and AKR1C3 expression levels in sc adipose tissue in 24 obese subjects who were on a VLCD. Scatter plots of leptin expression and AKR1C3 expression levels before (A – week 0), during (B – week 8, C – week 16) and after (D – week 18) the VLCD.
However, there was a positive correlation between AKR1C3 expression and the serum levels of leptin at baseline and at all time points during diet-induced weight loss (p = 0.005, p = 0.030 and p = 0.001, respectively, Fig. 3A-C). However, no correlation was observed after the reintroduction of a normal diet (week 18, Fig. 3D). There was also a correlation between adipose tissue AKR1C3 expression and leptin expression levels at baseline and at week 16 (p = 0.035 and p = 0.04, respectively, Fig. 4A and C), but only a borderline significant correlation at weeks 8 and 18 (Fig. 4B and D).
AKR1C3 is highly expressed in the sc adipose tissue depot
Using publicly available DNA microarray profiles from 65 human tissues (GEO accession No. GSE3526; http://www.ncbi.nlm.nih.gov/geo/), we analyzed the tissue distribution of AKR1C3 expression. Sc adipose tissue displayed the highest expression level of AKR1C3 for all the tissues included in the analysis. The tissues with the top 15 expression levels are shown in Fig. 5. As in previous studies [12-15], omental adipose tissue displayed a lower expression level than sc adipose tissue.
AKR1C3 expression in isolated human adipocytes
Increased adipose tissue mass and fat cell size are associated with the development of metabolic disease [4, 30]. We used microarray expression profiles to investigate AKR1C3 expression in size-separated human adipocytes derived from the same adipose tissue biopsies [28]. The analysis showed that large adipocytes have significantly higher expression levels of AKR1C3 than small adipocytes from the same subject (1.5-fold, p = 0.009, data not shown). Type 2 diabetes, impaired glucose tolerance or insulin resistance is a requirement of the WHO definition for the metabolic syndrome [23]. To further investigate a possible link between glucose intolerance and AKR1C3, we analyzed AKR1C3 expression in isolated adipocytes treated with 1 mU/ml of insulin for 6 h. However, no significant alteration of AKR1C3 expression was observed (data not shown).
DISCUSSION
This study showed that the AKR1C3 mRNA expression levels in sc adipose tissue are lower in obese subjects suffering from metabolic complications, and that AKR1C3 gene expression was reduced during diet-induced weight loss. Furthermore, AKR1C3 expression correlated with leptin levels and expression was higher in enlarged adipocytes.
in the reduction of PPARγ agonist (15d-PGJ2) availability was elegantly
demonstrated in a macrophage-like cell line (HL60), where the overexpression of AKR1C3 promoted phenotypic changes similar to those observed in HL60 cells exposed to PPARγ antagonists [18]. In addition, AKR1C3 can affect PPARγ activation, not only by reducing agonist formation, but also by directly increasing the level of PGF2α, which isa PPARγ antagonist [32]. Quinkler et al.
recently showed that all the enzymes required for the synthesis of the endogenous ligands (15d-PGJ2) for PPARγ are expressed in human adipose
tissue. They suggested that the higher expression in omental adipose tissue may be involved in some of the observed depot-specific differences in adipocyte differentiation [14].
The interpretation of the reduced AKR1C3 expression in adipose tissue from subjects with the metabolic syndrome is unclear, but it may be viewed as a secondary compensatory mechanism to increase PPARγ ligand availability thereby reducing insulin resistance. However, reduced AKR1C3 expression may also lead to reduced androgen generation in sc adipose tissue in subjects with the metabolic syndrome [15]. This is in line with studies showing that low androgen levels are associated with components of the metabolic syndrome, such as type 2 diabetes [33] and visceral obesity [34]. However, the alternate definitions for the metabolic syndrome contain different criteria for the assessment of glucose intolerance, adiposity, dyslipidaemia and hypertension [35]. That we were unable to detect a correlation between AKR1C3 expression and any of the metabolic parameters analyzed argues against a major role for it in metabolic disease. Larger study cohorts are needed to precisely define the potential impact of glucose levels, dyslipidaemia and hypertension on the regulation of AKR1C3 expression and to assess whether AKR1C3 has a role in metabolic disease or whether marginal changes in expression are due to compensatory or secondary effects of metabolic disease.
compared to our subjects (mean BMI ≥ 41 kg/m2 in both groups). The narrower
BMI range in our study cohort could also explain the lack of an observed correlation. Other potential explanations for this lack of correlation between AKR1C3 expression and the measurements of adiposity could be an insufficient number of subjects in our study or experimental variability in the expression analysis.
In a previous study, Quinkler et al., showed that AKR1C3 expression in gluteal adipose tissue from women was reduced after a ten-week VLCD regime [15]. Our study supports and expands on this finding, using sc abdominal adipose tissue from both men and women. The unaltered AKR1C3 expression observed during the reintroduction of normal food (weeks 16-18) indicates that AKR1C3 expression is related to adiposity per se rather than to the reduced caloric intake during the diet-regime. This data in combination with the data showing the association of AKR1C3 expression with measurements of adiposity [15, 31] indicates that altered AKR1C3 expression is a consequence of obesity rather than a cause of obesity. Decreased AKR1C3 expression during weight-loss could result in increased levels of PPARγ ligands and thus may partially mediate the increased adipose tissue insulin sensitivity observed with weight loss. Increased mean adipocyte size has been shown to be associated with adiposity and insulin resistance [37] and has been identified as an independent predictor of type 2 diabetes in Pima Indians [30]. One finding of our study is that large adipocytes have a 1.5-fold higher AKR1C3 expression than small adipocytes isolated from sc adipose tissue biopsies from the same subject. This may be interpreted as reduced levels of PPARγ ligands and possibly reduced insulin sensitivity in enlarged adipocytes. There is an apparent paradox in the finding that enlarged adipocytes are associated with insulin resistance and our findings that subjects with the metabolic syndrome, as well as impaired glucose tolerance, show lower sc adipose tissue AKR1C3 gene expression. However, it was recently shown that insulin-resistant subjects had a higher ratio of small to large sc abdominal adipocytes, and this was associated with a lower expression of adipocyte differentiation markers in the adipose tissue [38]. The authors proposed that insulin resistance is associated with an inability of adipose tissue to store excess energy because small adipocytes cannot fully differentiate into mature fat cells [38]. Hence, if AKR1C3 is primarily expressed in fully matured adipocytes, the lower expression in adipose tissue from obese subjects with the metabolic syndrome could reflect a larger proportion of immature adipocytes in the sc adipose tissue.
Several studies have reported a depot difference in AKR1C3 expression, with sc adipose tissue displaying the highest expression [12-15]. Our study expands on these findings by showing that AKR1C3 has the highest expression levels in sc adipose tissue when compared with 64 other human tissues. Quinkler et al.
different expression analysis techniques and the target sequence for the analysis (microarray compared to real time PCR).
The multiple enzymatic functions of AKR1C3 are challenging when trying to understand its role in the adipose tissue and adipocytes. Most of the information on AKR1C3 in the adipose tissue is currently limited to data from expression analyses. Further analyses on AKR1C3 protein expression and function in PPARγ ligand formation are needed to increase our understanding of the role of AKR1C3 in the development of obesity and metabolic disease.
In conclusion, this study shows that AKR1C3 expression in adipose tissue is decreased in subjects with the metabolic syndrome and that the expression in sc abdominal adipose tissue is downregulated during diet-induced weight-loss. Furthermore, AKR1C3 expression levels correlated with leptin levels, and the expression was higher in enlarged adipocytes.
Acknowledgements. We would like to thank Professor Lena Carlsson for her helpful discussions on the study. This study was supported by grants from the IngaBritt and Arne Lundberg Research Foundations, the Swedish Federal Government under the LUA/ALF agreement, the Swedish Diabetes Foundation, Swegene, the Swedish Research Council (11285, 529-2002-6671, 521-2005-6736 and K2008-65X-20753-10-4), the National Board of Health and Welfare, the Fredrik and Ingrid Thuring Foundation, the Royal Physiographic Society in Lund, the Åke Wiberg Foundation, the Jeansson Foundation, the Swedish Foundation for Strategic Research to Sahlgrenska Center for Cardiovascular and Metabolic Research, and the Sahlgrenska University Hospital Foundation.
REFERENCES
1. Goldstein, D.J. Beneficial health effects of modest weight loss. Int. J. Obes. Relat. Metab. Disord. 16 (1992) 397-415.
2. Sjöström, L., Narbro, K., Sjöström, C.D., Karason, K., Larsson, B., Wedel, H., Lystig, T., Sullivan, M., Bouchard, C., Carlsson, B., Bengtsson, C., Dahlgren, S., Gummesson, A., Jacobson, P., Karlsson, J., Lindroos, A.K., Lönroth, H., Näslund, I., Olbers, T., Stenlöf, K., Torgerson, J., Ågren, G. and Carlsson, L.M. Effects of bariatric surgery on mortality in Swedish obese subjects. N. Engl. J. Med. 357 (2007) 741-752.
3. Rajala, M.W. and Scherer, P.E. Minireview: The adipocyte--at the crossroads of energy homeostasis, inflammation, and atherosclerosis.
Endocrinology 144 (2003) 3765-3773.
4. Björntorp, P. Metabolic implications of body fat distribution. Diabetes Care
14 (1991) 1132-1143.
6. Kissebah, A.H. Intra-abdominal fat: is it a major factor in developing diabetes and coronary artery disease? Diabetes Res. Clin. Pract. 30 Suppl (1996) 25-30.
7. Pouliot, M.C., Despres, J.P., Nadeau, A., Moorjani, S., Prud'Homme, D., Lupien, P.J., Tremblay, A. and Bouchard, C. Visceral obesity in men. Associations with glucose tolerance, plasma insulin, and lipoprotein levels.
Diabetes 41 (1992) 826-834.
8. Montague, C.T. and O'Rahilly, S. The perils of portliness: causes and consequences of visceral adiposity. Diabetes 49 (2000) 883-888.
9. Gabrielsson, B.G., Johansson, J.M., Jennische, E., Jernås, M., Itoh, Y., Peltonen, M., Olbers, T., Lönn, L., Lönroth, H., Sjöström, L., Carlsson, B., Carlsson, L.M. and Lönn, M. Depot-specific expression of fibroblast growth factors in human adipose tissue. Obes. Res. 10 (2002) 608-616.
10. Gabrielsson, B.G., Johansson, J.M., Lönn, M., Jernås, M., Olbers, T., Peltonen, M., Larsson, I., Lönn, L., Sjöström, L., Carlsson, B. and Carlsson, L.M. High expression of complement components in omental adipose tissue in obese men. Obes. Res. 11 (2003) 699-708.
11. Vidal, H. Gene expression in visceral and subcutaneous adipose tissues.
Ann. Med. 33 (2001) 547-555.
12. Blouin, K., Richard, C., Belanger, C., Dupont, P., Daris, M., Laberge, P., Luu-The, V. and Tchernof, A. Local androgen inactivation in abdominal visceral adipose tissue. J. Clin. Endocrinol. Metab. 88 (2003) 5944-5950. 13. Blouin, K., Richard, C., Brochu, G., Hould, F.S., Lebel, S., Marceau, S.,
Biron, S., Luu-The, V. and Tchernof, A. Androgen inactivation and steroid-converting enzyme expression in abdominal adipose tissue in men.
J. Endocrinol. 191 (2006) 637-649.
14. Quinkler, M., Bujalska, I.J., Tomlinson, J.W., Smith, D.M. and Stewart, P.M. Depot-specific prostaglandin synthesis in human adipose tissue: a novel possible mechanism of adipogenesis. Gene 380 (2006) 137-143. 15. Quinkler, M., Sinha, B., Tomlinson, J.W., Bujalska, I.J., Stewart, P.M. and
Arlt, W. Androgen generation in adipose tissue in women with simple obesity--a site-specific role for 17beta-hydroxysteroid dehydrogenase type 5.
J. Endocrinol. 183 (2004) 331-342.
16. Lin, H.K., Jez, J.M., Schlegel, B.P., Peehl, D.M., Pachter, J.A. and Penning, T.M. Expression and characterization of recombinant type 2 3 alpha-hydroxysteroid dehydrogenase (HSD) from human prostate: demonstration of bifunctional 3 alpha/17 beta-HSD activity and cellular distribution. Mol. Endocrinol. 11 (1997) 1971-1984.
17. Penning, T.M., Burczynski, M.E., Jez, J.M., Lin, H.K., Ma, H., Moore, M., Ratnam, K. and Palackal, N. Structure-function aspects and inhibitor design of type 5 17beta-hydroxysteroid dehydrogenase (AKR1C3). Mol. Cell Endocrinol. 171 (2001) 137-149.
aldo-keto reductase AKR1C3 is a novel suppressor of cell differentiation that provides a plausible target for the non-cyclooxygenase-dependent antineoplastic actions of nonsteroidal anti-inflammatory drugs. Cancer Res.
63 (2003) 505-512.
19. Spiegelman, B.M. PPAR-gamma: adipogenic regulator and thiazolidinedione receptor. Diabetes 47 (1998) 507-514.
20. Palming, J., Sjöholm, K., Jernås, M., Lystig, T.C., Gummesson, A., Romeo, S., Lönn, L., Lönn, M., Carlsson, B. and Carlsson, L.M. The expression of NAD(P)H:quinone oxidoreductase 1 is high in human adipose tissue, reduced by weight loss, and correlates with adiposity, insulin sensitivity, and markers of liver dysfunction. J. Clin. Endocrinol. Metab. 92 (2007) 2346-2352.
21. Gummesson, A., Jernås, M., Svensson, P.A., Larsson, I., Glad, C.A., Schele, E., Gripeteg, L., Sjöholm, K., Lystig, T.C., Sjöström, L., Carlsson, B., Fagerberg, B. and Carlsson, L.M. Relations of Adipose Tissue CIDEA Gene Expression to Basal Metabolic Rate, Energy Restriction, and Obesity: Population-Based and Dietary Intervention Studies. J. Clin. Endocrinol. Metab. 92 (2007) 4759-4765.
22. Behre, C.J., Gummesson, A., Jernås, M., Lystig, T.C., Fagerberg, B., Carlsson, B. and Carlsson, L.M. Dissociation between adipose tissue expression and serum levels of adiponectin during and after diet-induced weight loss in obese subjects with and without the metabolic syndrome.
Metabolism 56 (2007) 1022-1028.
23. WHO 1999 Definition, diagnosis and classification of diabetes mellitus and its complications. Part 1: Diagnosis and classification of diabetes mellitus. In. Geneva: World Health Organization, Department of noncommunicable disease surveillance
24. Torgerson, J.S., Lindroos, A.K., Sjöström, C.D., Olsson, R., Lissner, L. and Sjöström, L. Are elevated aminotransferases and decreased bilirubin additional characteristics of the metabolic syndrome? Obes. Res. 5 (1997) 105-114.
25. Chomczynski, P. and Sacchi, N. Single-step method of RNA isolation by acid guanidinium thiocyanate-phenol-chloroform extraction. Anal. Biochem. 162 (1987) 156-159.
26. Brazma, A., Hingamp, P., Quackenbush, J., Sherlock, G., Spellman, P., Stoeckert, C., Aach, J., Ansorge, W., Ball, C.A., Causton, H.C., Gaasterland, T., Glenisson, P., Holstege, F.C., Kim, I.F., Markowitz, V., Matese, J.C., Parkinson, H., Robinson, A., Sarkans, U., Schulze-Kremer, S., Stewart, J., Taylor, R., Vilo, J. and Vingron, M. Minimum information about a microarray experiment (MIAME)-toward standards for microarray data.
Nat. Genet. 29 (2001) 365-371.
28. Jernås, M., Palming, J., Sjöholm, K., Jennische, E., Svensson, P.A., Gabrielsson, B.G., Levin, M., Sjögren, A., Rudemo, M., Lystig, T.C., Carlsson, B., Carlsson, L.M. and Lönn, M. Separation of human adipocytes by size: hypertrophic fat cells display distinct gene expression. Faseb J. 20 (2006) 1540-1542.
29. Gabrielsson, B.G., Olofsson, L.E., Sjögren, A., Jernås, M., Elander, A., Lönn, M., Rudemo, M. and Carlsson, L.M. Evaluation of reference genes for studies of gene expression in human adipose tissue. Obes. Res. 13 (2005) 649-652.
30. Weyer, C., Foley, J.E., Bogardus, C., Tataranni, P.A. and Pratley, R.E. Enlarged subcutaneous abdominal adipocyte size, but not obesity itself, predicts type II diabetes independent of insulin resistance. Diabetologia 43 (2000) 1498-1506.
31. Wake, D.J., Strand, M., Rask, E., Westerbacka, J., Livingstone, D.E., Soderberg, S., Andrew, R., Yki-Jarvinen, H., Olsson, T. and Walker, B.R. Intra-adipose sex steroid metabolism and body fat distribution in idiopathic human obesity. Clin. Endocrinol. (Oxf) 66 (2007) 440-446.
32. Reginato, M.J., Krakow, S.L., Bailey, S.T. and Lazar, M.A. Prostaglandins promote and block adipogenesis through opposing effects on peroxisome proliferator-activated receptor gamma. J. Biol. Chem. 273 (1998) 1855-1858.
33. Barrett-Connor, E. Lower endogenous androgen levels and dyslipidemia in men with non-insulin-dependent diabetes mellitus. Ann. Intern. Med. 117 (1992) 807-811.
34. Haffner, S.M., Valdez, R.A., Stern, M.P. and Katz, M.S. Obesity, body fat distribution and sex hormones in men. Int. J. Obes. Relat. Metab. Disord.
17 (1993) 643-649.
35. Day, C. Metabolic syndrome, or What you will: definitions and epidemiology. Diab. Vasc. Dis. Res. 4 (2007) 32-38.
36. Peeraully, M.R., Sievert, H., Bullo, M., Wang, B. and Trayhurn, P. Prostaglandin D2 and J2-series (PGJ2, Delta12-PGJ2) prostaglandins stimulate IL-6 and MCP-1, but inhibit leptin, expression and secretion by 3T3-L1 adipocytes. Pflugers Arch. 453 (2006) 177-187.
37. Lundgren, M., Svensson, M., Lindmark, S., Renström, F., Ruge, T. and Eriksson, J.W. Fat cell enlargement is an independent marker of insulin resistance and 'hyperleptinaemia'. Diabetologia 50 (2007) 625-633.