R E S E A R C H
Open Access
Comparison of T1wFLAIR and T1wTSE
sequences in imaging the brain of small
animals using high-field MRI
Chiara Bergamino
1*, Séamus Hoey
1, Kenneth Waller
2and Cliona Skelly
1Abstract
Background:T1w turbo spin echo (TSE) represents a fundamental sequence in magnetic resonance imaging (MRI) protocols investigating the brain. Recent human literature has reported T1w Fluid Attenuated Inversion Recovery’s (FLAIR’s), superiority to T1wTSE in relation to tissue contrast for grey-to-white matter (GM-WM) and lesion-to-WM, although conflicting results are reported concerning lesion detection.
To the author’s knowledge, T1wFLAIR has not been investigated in veterinary medicine. The aim of this prospective study was to determine quantitatively and qualitatively which sequence provides better overall better image quality both pre- and post-gadolinium.
Results:Twenty-eight animals underwent MRI of the brain with T1wTSE and T1wFLAIR sequences performed with equivalent mean acquisition times. Quantitative assessment of the sequences was undertaken using contrast-to-noise (CNR) and signal-to-contrast-to-noise (SNR) ratios from predefined locations. T1wFLAIR provided a better CNR compared to T1wTSE, while T1wTSE provided better SNR due to the higher noise levels of T1wFLAIR images. Qualitative assessment of the sequences was performed using Visual Grading Analysis Scoring (VGAS) for a number of criteria by three observers on two separate occasions. T1wFLAIR performed better for cerebrospinal fluid (CSF) suppression, white-to-grey matter (WM-GM) and white matter-to-CSF (WM-to-CSF) definition in both pre- and post-contrast images whereas the T1wTSE sequence was less affected by noise levels. The individual parameter for overall image quality found no significant difference between the two sequences. However, the composite VGAS favored T1wFLAIR as the preferred sequence. Although case numbers were insufficient for statistical analysis, comparison of the sequences indicates that lesion definition and margination was better in T1wFLAIR pre-contrast images, however post-contrast lesion detection was almost equivalent between sequences with slightly better margination in the T1wTSE sequence.
Conclusions:T1wFLAIR provides better CNR with better WM-GM and WM-CSF definition both pre- and post-contrast compared to T1wTSE albeit with a higher degree of noise; this was confirmed both quantitatively and qualitatively. Our results also suggest that T1wFLAIR is better for lesion detection and margination pre-contrast administration and sequences are relatively equivocal post-gadolinium administration although further research is required to determine the benefit that inversion recovery sequences make when investigating brain lesions in small animal MRI.
Keywords:T1wFLAIR, MRI, Brain, Small animals, Inversion recovery
© The Author(s). 2019Open AccessThis article is distributed under the terms of the Creative Commons Attribution 4.0 International License (http://creativecommons.org/licenses/by/4.0/), which permits unrestricted use, distribution, and reproduction in any medium, provided you give appropriate credit to the original author(s) and the source, provide a link to the Creative Commons license, and indicate if changes were made. The Creative Commons Public Domain Dedication waiver (http://creativecommons.org/publicdomain/zero/1.0/) applies to the data made available in this article, unless otherwise stated. * Correspondence:[email protected]
1School of Veterinary Medicine Teaching Hospital, University College Dublin,
Belfield, Dublin, Ireland
Background
T1weighted turbo spin echo (T1wTSE) is considered a fundamental sequence in clinical small animal brain MRI imaging [1, 2]. It is characterized by short echo (TE) and repetition (TR) times and used mainly for anatomical reference.
T1weighted Fluid Attenuated Inversion Recovery (T1wFLAIR) is an inversion recovery (IR) turbo spin echo sequence that has been investigated in human medicine since 1985 [3]. Since inception, the sequence has demonstrated improved WM-GM and lesion-WM contrast, but the long acquisition time has limited its use in clinical settings. Multiple studies have highlighted improvements in the technical aspects of the sequence and investigated its clinical usefulness [4–10]. In 2000 Lee et al.,examined the inversion recovery sequence and determined that despite the longer acquisition time, T1wFLAIR improved the extent and conspicuity of lesions and was qualitatively superior for image contrast when compared to T1wTSE [6]. Human medical litera-ture report overall agreement among different studies on the ability of T1wFLAIR in providing better WM-GM definition and better lesion-to-WM contrast in both high- and low-field MRI [3–7, 9, 11] and in both pre-and post-contrast studies [9, 12]. Some contradictory results have, however, been published regarding the abil-ity of T1wFLAIR in detecting brain disease [8–10, 12]. The study conducted by Qian et al.,(2008), found a con-siderable number of lesions detected only on T1wTSE, in both pre and post-contrast sequences [8]. A more recent study by Jeong et al. (2014) evaluated the role of T1wFLAIR in oncologic patients and concluded that the inversion recovery sequence was better or comparable to T1wTSE both quantitatively and qualitatively in post-contrast imaging [10].
In the veterinary literature, one study compared the contrast-enhanced T2w FLAIR and T1wSE image sequences [13]. The study focused on the usefulness of T2wFLAIR compared to standard T1wSE in detecting brain lesions in post-contrast images in low-field mag-nets. It was reported that T2wFLAIR allowed the identi-fication of a higher number of lesions compared to T1wSE. Falzone et al. (2008) concluded that the contri-bution that inversion recovery sequences made to small animal brain imaging required further investigation to assess its full potential [13].
In light of the conflicting reports regarding lesion detection in the human medical literature and in order to quantify the contribution that T1wFLAIR gives to brain imaging in terms of tissue contrast from a veterin-ary perspective, a prospective study was undertaken.
The study was designed to acquire images using parameters that would minimize the differences in the length of time for acquisition to increase the feasibility
of using T1wFLAIR in a clinical setting. The post-acquisition image sequences were then analysed both quantitatively and qualitatively, pre and post contrast administration. The quantitative evaluation consisted of two objective assessments: contrast to noise ratio (CNR) and signal to noise ratio (SNR). Contrast refers to the signal difference between two tissues or a lesion and its background [14] and the CNR is defined as the ratio of signal difference (contrast) to the standard deviation of background noise (σ). SNR is defined as the ratio of the amplitude of the MR signal to the average amplitude of the background noise [14]. Both parameters are consid-ered important for image quality.
Visual grade analysis (VGA) is a qualitative image as-sessment method that permits an image or parts of an image to be evaluated visually [15]. Using predefined criteria VGA allows the quantification of subjective opin-ions into a scoring system making them amenable to statistical analysis [16]. VGA has been validated in human radiology, as an analytical system for image qual-ity [15, 17–19]. Currently, in veterinary medicine VGA has also been examined and it is now considered a valid option in radiology to quantitatively assess the image quality [20].
The primary aim of this prospective study is to quantita-tively and qualitaquantita-tively compare T1wTSE with T1wFLAIR images to determine which sequence provides better CSF suppression, GM-WM contrast, lower noise and overall better image quality both pre- and post-gadolinium. The hypothesis is that T1wFLAIR would provide better CSF suppression, GM-WM and WM-CSF contrast. The secondary aim of this study is to evaluate which image sequence would provide better image quality taking into account the influence of contrast to noise and signal to noise ratios. The study also compared the sequences for lesion detection and margination pre and post contrast enhancement.
Methods
Animals
acquired only in pre- or post-contrast or when the two sequences had different slice thickness.
Image acquisition
Images were acquired using two MRI scanners at each of the centres (1.5 T Philips, Achieva, Philips Medical System, The Netherlands, 1.5 T GE Genesis Signa, GE GE Healthcare Milwaukee, USA) using head or extrem-ity coils, depending on the size of the animal. The MRI
brain protocol included transverse T1wTSE and
T1wFLAIR, acquired at the same slice thickness, adapted to the size of the patient (2.5–5 mm), both pre-and post-gadolinium (PG) administration. T1wTSE parameters were as follow: TE 9–12 ms (milliseconds); TR: 450–700 ms; NEX: 2–4. For T1wFLAIR parameters were: TE:16 ms; TR: 2000 ms; TI:600 ms; NEX: 2. The acquisition time for each sequence was recorded.
Quantitative analysis
SNR for the white matter (WM), grey matter (GM) and cerebrospinal fluid (CSF) and CNR for the WM-GM and WM-CSF were measured in all 4 sequences (T1wTSE, T1wFLAIR, T1wTSE PG and T1wFLAIR PG). A stand-ard circular region of interest (ROI) was drawn in a number of different areas of the central nervous system in all sequences by one board certified radiologist. The predefined ROIs chosen for WM were: the cerebellar hemisphere, the internal capsule and the thalamus. The GM ROIs were placed at the cingulate gyrus, temporal cortex and piriform lobe, alternating between the right and left side in structurally normal brains and choosing the unaffected site in cases with pathological changes. The mean of the three ROIs for WM and GM were used for statistical analysis. For the CSF ROI, the lateral ven-tricles were the preferred site, however, occasionally when they were too small to allocate the ROI, the third ventricle or the aqueduct was chosen instead.
Qualitative analysis
Three board-certified radiologists independently evalu-ated the DICOM (Digital Imaging and Communication in Medicine) images in two separate sessions a mini-mum of 3 weeks apart. Cases were anonymized and identified with a progressive number, generated by a ran-dom number generator and each number was different between the two sessions. For each patient the pre-contrast sequences were identified as “A” or “B”, while the post-contrast as“C”or“D”. Observers were asked to compare the images in pairs (A with B, and C with D) evaluating each pair using post-processing alterations of the images (such as magnification or windowing) where appropriate. The qualitative criteria examined were: the degree of CSF suppression; GM definition; WM-CSF definition; the presence of noise; presence of other
artifacts affecting the region of interest (cerebrum, cere-bellum, meninges and neurocranium) overall better image quality. Observers expressed their preferences choosing the letter (A or B, C or D) for each criteria of the paired sample. If neither sequence was preferred, then a value of 0 was given for equivalence. The data was then collated using a three-grade scale. The obser-ver preferences were assigned a value, such that when T1wFLAIR was the preferred sequence, a score of + 1 was given, when T1wTSE was the preferred sequence a score of −1 was given, and a 0 score was given if the two sequences were considered equal. Composite Visual Grade Analysis Score (VGAS) for each comparative set of sequence was calculated based on 4 of the 5 parame-ters measured (CSF suppression, WM-GM definition, WM-CSF definition and presence of noise). Overall image quality, as judged by the observers, was not in-cluded in calculation of the composite VGAS as it was an amalgam of the other criteria.
Observers also judged if a lesion was detectable on one or both sequences pre and post contrast. If present, the sequence which provided better lesion margin-ation and detectability was indicated by the letter of the preferred sequence or a 0 in case of equivalence. The data was then collated using the same three-grade scale.
Statistical analysis
Statistical analysis was carried out by a veterinary statistician.
Quantitative analysis
Sample size calculation using G-Power was performed to find the minimum number of animals for the study. Given a two-tailed design with an alpha error = 0.0002 (due to the Bonferroni correction for multiple hypoth-eses) and effect size of 1, we can expect to identify sig-nificant differences with an 80% power with a sample size of 21. At sample size 28, the same power can be achieved for effect size ~ 0.82. Further, sample size of 28 is a reasonable size for the t-test to be valid should the data be non-normally distributed [21].
For the CNR, using STATA 15, a two-tailed t-test with 27 degrees of freedom was performed for each comparison for the null hypothesis that the mean of the ROIs for T1wFLAIR was equal to the mean of T1wTSE.
Qualitative analysis
A two-tailed t-test was performed on the mean VGAS for each of the 6 parameters in both pre- and post-contrast using the statistical package STATA 15.
To assess repeatability of measurements, agreement over sessions was calculated for each observer (intra-ob-server) using Gwets AC kappa, with linear weighting and probabilistic benchmarking. Gwets AC kappa was also used for the inter-observer agreement for each parameter using the mean value for each observer over the two sessions in order to calculate reproducibility. Landis and Koch (1977) suggest the following benchmark scale for interpreting the kappa-statistic: < 0.00 Poor; 0.00–0.20 Slight; 0.21–0.40 Fair; 0.41–0.60 Moderate; 0.61–0.80 Substantial; 0.81–1.00 Almost Perfect [22].
Due to the small number of lesions within the case cohort, descriptive statistics are presented. The cases were divided in pre- and post-contrast administration. Mean VGAS for lesion detection and lesion margination, respectively, were calculated for subjects where all three observers agreed that lesions were present. Mean VGAS was calculated using the grades for both sessions and all three observers. The results are presented as boxplots of the mean VGAS for lesion detection and margination pre and post contrast administration.
The Bonferroni correction for 25 hypotheses and a significance level ofp< 0.05 was calculated and resulted in a significance level of 0.002.
Results
Animals
The study population was composed of 26 dogs (10 male neutered; 9 females spayed; 5 males; 2 females) and 2 cats (1 female spayed and 1 male neutered). The range of dog breeds included were: 3 Boxers, 2 German Shepherds, 2 Boston Terriers, 2 Terrier Crosses, 2 Golden Retrievers, 2 Bulldogs, 2 Maltese Terriers, and one Border Collie, Pitbull Terrier, Labrador, Australian Shepherd, Dachshund, Rottweiler, Cocker Spaniel, Miniature Poodle, Poodle Cross, Brussels Griffon and Cavalier King Charles Spaniel. Both of the cats included in the study were Domestic Short Hair. The mean weight in the population was 18.1 Kg (range: 3.5–40.5 Kg) and mean age was 7.2 years (range: 1–15.2 years).
Brains were structurally normal in 17 cases, while abnor-malities were found in 11 cases: 4 intra-axial masses; 3 extra-axial masses; 1 leptomeningitis; 1 optic neuritis; 1 otits interna and 1 leukariosis.
Image acquisition
The mean acquisition time for T1wTSE was 4 mins (mi-nutes) and 44 s (seconds) (Range: 2 mins 56 s– 6 mins 17 s) and the mean acquisition time for T1wFLAIR was 5 mins and 6 s (Range: 3 mins 38 s - 6 mins 03 s).
Quantitative analysis
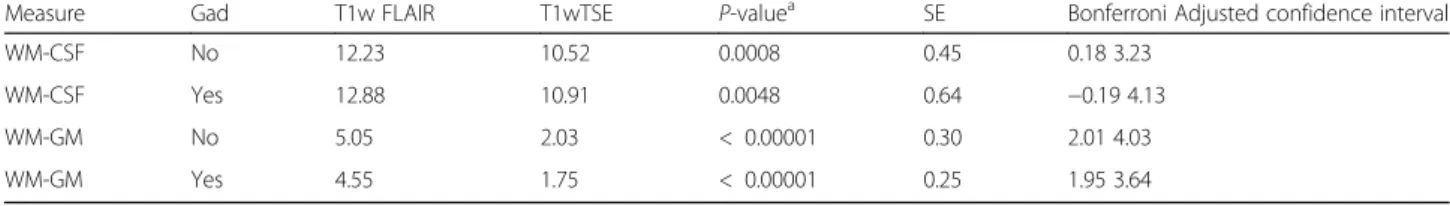
The results for the CNR for the sequences with and without Gadolinium are shown in Table 1. T1wFLAIR performed better than T1wTSE for CNR in all cases with the exception of WM-CSF contrast where no significant difference was found between the two sequences.
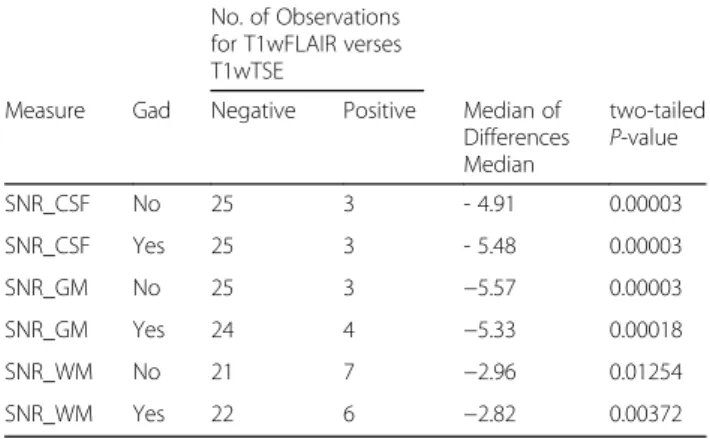
Results for SNR are summarized in Table 2. For all comparisons, except for the SNR of WM pre- and post-contrast, the null hypothesis was rejected proving that T1wTSE showed higher SNRs for GM and CSF in both pre- and post-contrast. However, there was not enough evidence to reject the null hypothesis for the WM in the pre- and post-contrast series based on the Bonferroni-adjusted significance level of 0.002, calculated from a significance level of 0.05 for 25 hypotheses.
Qualitative analysis
The two-tailed t-test results are shown in Table3for the pre-contrast and in Table 4 for the post-contrast series. Results indicate a significantly better performance of the T1wFLAIR in the suppression of CSF signal, improved WM-GM and WM-CSF definitions and composite VGAS in both pre- and post-contrast series. T1wTSE images showed a statistically significant reduction in the levels of noise compared to the T1wFLAIR images both pre and post-contrast. Regarding overall image quality, the difference between the two sequences was not statis-tically significant.
The mean of the observers (Table5) for intra-observer reliability was‘almost perfect’for pre-contrast CSF signal suppression, WM-GM and WM-CSF definitions and presence of noise; ‘substantial’for the post-contrast CSF suppression, WM-GM and WM-CSF definitions and
Table 1Comparison of the Contrast to Noise Ratio (CNR) for T1wFLAIR and T1wTSE Sequences Pre and Post Contrast Administration
Measure Gad T1w FLAIR T1wTSE P-valuea SE Bonferroni Adjusted confidence interval
WM-CSF No 12.23 10.52 0.0008 0.45 0.18 3.23
WM-CSF Yes 12.88 10.91 0.0048 0.64 −0.19 4.13
WM-GM No 5.05 2.03 < 0.00001 0.30 2.01 4.03
WM-GM Yes 4.55 1.75 < 0.00001 0.25 1.95 3.64
a
presence of noise; ‘moderate’for the post-contrast over-all image quality and ‘fair’ post-contrast overall better image quality.
The overall inter-observer reliability (Table6) for CSF signal suppression, WM-GM definition and presence of noise in the pre-contrast images was ‘almost perfect’ in pre contrast series, and ‘substantial’in the post-contrast series. The inter-rater agreement was‘moderate’for both pre- and post-contrast WM-CSF definition with the overall better image quality parameter having ‘slight’ pre-contrast and‘poor’post-contrast reliability.
The most frequently reported artifact for both sequences was magnetic susceptibility affecting over 80% of the pre (125/156) and post T1wFLAIR (127/156) sequence images and almost 20% of the post contrast T1wTSE (31/156). Chemical shift was noted in 13% of T1wFLAIR (20/156) and 10% of T1wTSE (16/156) images post contrast. Other artifacts recorded were: flow artifact, truncation artifact, wrap around artifact and volume averaging, and these affected less than 4% of the cases per image sequence with no predilection for either sequence.
Regarding the lesion analysis, all three observers agreed that lesions were present in both sessions in 6
pre-contrast and in 8 post-contrast sets of images out of 11 abnormal cases. Considering only these cases in which all three observers agreed lesions were present, the distribution of results is represented in Fig. 1. Pre-contrast mean VGAS for detectability was 0.44, median 0.67; mean VGAS for margination was 0.56 median 0.92. Post-contrast mean VGAS for detectability was 0.00 median, −0.08; mean VGAS for margination was−0.27, median−0.42 As shown in the box plots (Fig. 1), T1wFLAIR images provided improved lesion detectability and margination compared to T1wTSE in pre-contrast studies in a higher number of cases. However, on the post-contrast images the lesion detectability was almost equivalent, while margination was judged to be im-proved in the T1wTSE.
Discussion
MRI sequence selection is based on providing tissue contrast to enhance the image quality of the area under investigation and enable more accurate interpretation diagnostically. In terms of the brain, the contrast be-tween different brain tissues and the CSF is of primary importance. One of the strengths of the T1wFLAIR sequence reported in human literature is its superior image contrast [3–6, 9, 12]. In veterinary imaging there are a number of other key factors that need to be taken into account when assessing the image quality. Firstly, the human brain has a greater mass–so the lower SNR ratio in T1wFLAIR images would be expected to have a greater negative impact on the image quality of animal brains. Secondly, the shape of the canine brain is rela-tively longer in a rostro-caudal direction with relarela-tively narrow olfactory bulbs further reducing the signal gener-ated. In addition, the air-filled frontal sinuses and tym-panic bullae that lie adjacent to the brain tissue provide conditions favouring high levels of magnetic susceptibil-ity artifact that could adversely affect images in T1wFLAIR sequences. Finally, many of the human stud-ies used extended T1wFLAIR acquisition times that are not clinically appropriate, thus preselecting parameters
Table 2Comparison of the Median Signal to Noise Ratio (SNR) for T1wFLAIR verses T1wTSE Sequences Pre and Post Contrast Administration
No. of Observations for T1wFLAIR verses T1wTSE
Measure Gad Negative Positive Median of Differences Median
two-tailed P-value
SNR_CSF No 25 3 - 4.91 0.00003
SNR_CSF Yes 25 3 - 5.48 0.00003
SNR_GM No 25 3 −5.57 0.00003
SNR_GM Yes 24 4 −5.33 0.00018
SNR_WM No 21 7 −2.96 0.01254
SNR_WM Yes 22 6 −2.82 0.00372
Gadgadolinium
Table 3Comparison of the VGAS mean values for pre-contrast images of T1wFLAIR and T1wTSE sequences of the brain using predefined criteria
Imaging Criteria VGAS Mean Value
Standard Error
P-value * Bonferroni Adjusted
CSF Suppression 0.95 0.04 < 0.00001 0.83 1.07
WM-GM 0.92 0.04 < 0.00001 0.79 1.04
WM-CSF 0.88 0.03 < 0.00001 0.78 0.98
Presence of Noise −0.88 0.03 < 0.00001 −1.00 -0.77
Overall Better Image Quality
−0.089 0.10 0.39606 −0.43 0.26
Composite VGAS 0.47 0.02 < 0.00001 0.40 0.54
*P-value derived from two-tailed t-tests with 27 degrees of freedom
Table 4Comparison of the VGAS mean values for post-contrast images of T1wFLAIR and T1wTSE sequences of the brain using predefined criteria
Imaging Criteria Mean
Value
Standard
Error P
-value* Bonferroni Adjusted
CSF Suppression 0.82 0.07 < 0.00001 0.59 1.05
WM-GM 0.78 0.06 < 0.00001 0.56 1.00
WM-CSF 0.74 0.05 < 0.00001 0.55 0.93
Presence of Noise −0.76 0.07 < 0.00001 −1.00 -0.53
Overall Better Image Quality −0.09 0.10 0.36290 −0.41 0.23
Composite VGAS 0.39 0.03 < 0.00001 0.27 0.52
that minimized differences in acquisition times was im-portant when comparing the sequences.
This study confirmed previously described superior CNR for T1wFLAIR images compared to T1wTSE dem-onstrating significantly higher GM-WM and WM-CSF CNRs for the T1wFLAIR [3–7, 9, 11, 12], in both pre-and post-contrast imaging of the brain of dogs pre-and cats quantitatively (Table1).
The superior tissue contrast displayed in the
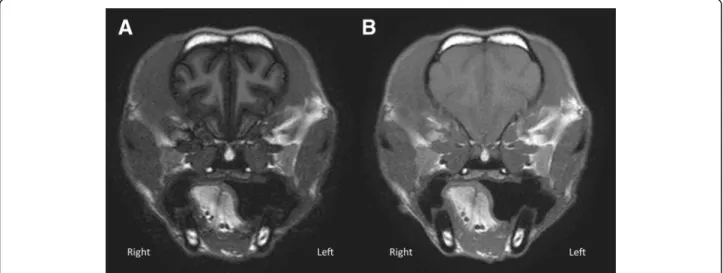
T1wFLAIR sequence is due to the use of the characteris-tic 180° pulse (inversion pulse) [3,9]. When applying the inversion pulse, the longitudinal magnetization becomes negative, increasing the contrast twofold during T1w relaxation [9]. Our results confirmed that despite any relative reduction in brain mass in animals compared to humans and the resultant reduction in SNR, that quali-tatively T1wFLAIR retained its superior tissue contrast when using VGAS (Tables 3 and4). The VGAS showed a statistically significant difference with better T1wFLAIR performance in both GM and WM-CSF definition (Tables 3, 4 and5) by all observers. The marked contrast definition is evident in Fig. 2, which shows the excellent differentiation of GM and WM of T1wFLAIR images, is considered an important param-eter in MRI image assessment [23]. The high levels of inter- and intra- observer agreement, scoring the T1wFLAIR sequence as better in comparison to T1wTSE validates the superior tissue contrast of T1wFLAIR. Although gadolinium improved the overall contrast for the T1wTSE sequence, T1wFLAIR still remained superior to a ‘substantial’and ‘moderate’ level in the inter-observer agreement analysis demonstrating
that T1wFLAIR to provides better WM-GM contrast both pre- and post-gadolinium administration.
Considering the quantitative analysis, the only parameter that didn’t reach a statistically significance level was the CNR for the WM-CSF definition. How-ever, as VGAS judged T1wFLAIR superior compared to T1wTSE for this parameter, it is likely that statis-tical significance was not reached due to insufficient case numbers.
While tissue contrast is considered a strength of the T1wFLAIR sequence, the reduced SNR is a recognized weakness. Comparing the two sequences, the SNR values were unsurprisingly significantly lower in T1wFLAIR than T1wTSE, with the exception of the white matter in post-contrast. For this variable the number of cases was likely insufficient to reach a significance. Overall the SNR results are in accordance with previous human studies [5,11] despite the decrease in mass and different shape of the animal brain and demonstrate a similar strong reduction in signal relative to noise negatively impacting image quality. Although the majority (25 animals) in our case population demonstrated the lower SNR in the T1wFLAIR image sequence compared to that of T1wTSE, there were three animals (a cat, a Maltese terrier and a Boxer dog) with quite marked and unex-pectedly high SNR values in the pre- and post-contrast T1wFLAIR sequence although their T1wTSE SNR values were as expected. There was no obvious reason to ex-plain this finding as although the Phillips MRI machine performed all three studies, they used different coils and had different slice thickness (2.5 mm, 3 mm and 4 mm). In addition, a second Boxer dog and Maltese terrier
Table 5Results for mean intra-observers agreement considering all observers assessing T1wFLAIR and T1wTSE sequences of the brain of dogs and cats
Pre-contrast Post-contrast
Imaging Criteria AC Gwet kappa Probabilistic Benchmark AC Gwet kappa Probabilistic Benchmark
CSF Suppression 0.97 0.8–1 0.86 0.6–0.8
WM-GM 0.97 0.8–1 0.84 0.6–0.8
WM-CSF 0.89 0.8–1 0.79 0.6–0.8
Presence of Noise 0.90 0.8–1 0.76 0.6–0.8
Overall Better Image Quality 0.52 0.2–0.4 0.59 0.4–0.6
Table 6Results for mean inter-observers agreement considering all observers assessing T1wFLAIR and T1wTSE sequences of the brain of dogs and cats
Pre-contrast Post-contrast
Variable AC Gwet kappa Probabilistic Benchmark AC Gwet kappa Probabilistic Benchmark
CSF Suppression 0.96 0.8–1 0.86 0.6–0.8
WM-GM 0.94 0.8–1 0.81 0.6–0.8
WM-CSF 0.86 0.6–0.8 0.69 0.4–0.6
Presence of Noise 0.89 0.8–1 0.76 0.6–0.8
replicated the MRI scan using the same machine and pa-rameters and recorded the expected lower T1wFLAIR SNR levels. Therefore, as these three outliers would alter the mean SNR value for the T1wFLAIR sequence pos-sibly leading to an erroneous interpretation of the result, it was considered more prudent to analyze the SNR data using Wilcoxon signed rank test, that does not assume that the data follows a normal distribution [24]. The results (Table 2) showed better SNR for the T1wTSE compared to T1wFLAIR is in keeping with the literature
that IR sequences, such as T1wFLAIR, have lower signal-to-noise efficiency compared to TSE [25].
NEX (number of excitations) represents the number of times the signal originating from a certain slice is recorded [26]. The decision to use of a NEX of 2 for the T1wFLAIR as opposed to 2–4 for the T1wTSE was in order to maintain a similar acquisition time for the se-quences. As a result, by lowering the NEX, the amount of signal recorded is decreased, however the scan time is also decreased [26]. In this study, a lower NEX in the
Fig. 1Boxplots of Composite VGAS for the lesion criteria including both sessions, for all three observers’agreement. In pre-contrast images the three observers agreed on the presence of lesions in 6 cases out of 11; while in post-contrast images a full agreement was reached in 8 cases. Blue is detectability (det) and red is margination (mar); preGD is pre-contrast status; postGD is post-contrast. The three-grade scale is represented
as + 1 (T1wFLAIR better); 0 (equivalent);−1 (T1wTSE better)
Fig. 2aTransverse T1wFLAIR (TE/TR/TI: 16 ms/2000 ms/600 ms; NEX: 2. ms; slice thickness 3 mm; Window Level: 797; Window Width: 1887);b) Transverse T1wTSE (TE/TR: 11 ms/470 ms; NEX: 3. ms; slice thickness 3 mm; Window Level: 797; Window Width: 1887) at the level of the frontal
lobe of a small dog. T1wFLAIR (a) shows a better WM-GM contrast and a greater noise compared to T1wTSE (b). Dorsal aspect of the animal to
T1wFLAIR sequence negatively impacted the signal re-corded for the image sequence, meaning a higher level of noise in the displayed image, but did result in similar acquisition times when compared to T1wTSE, with a mean difference of only 22 s, representing a more clinic-ally applicable comparison.
In light of the poorer SNR and lower NEX, the noise was as expected more conspicuous in the T1wFLAIR when compared to the TSE (Tables 3, 4) with inter-observers agreement reporting between ‘substantial’ to ‘almost perfect’higher noise levels in the IR sequence in both sessions (Tables 5and 6). High levels of noise give undesired signal that does not contribute to the image formation generated by fluctuations of the signal inten-sity [14,23,27]. There are two types of noise present in MR images.‘Gaussian noise’, which was the predominant type found in this study, is responsible for quantum mottle and is displayed as a grainy pattern in the back-ground. The second type is the‘structured noise’, which is responsible for lines and streaks formation [14]. Both types of noise can adversely affect image interpretation by masking low-contrast lesions. So even though the noise level was greater in the T1wFLAIR images the inherent better contrast of the sequence minimized the negative impact on the images and this theory was sup-ported by the VGAS preference for the T1wFLAIR image sequence.
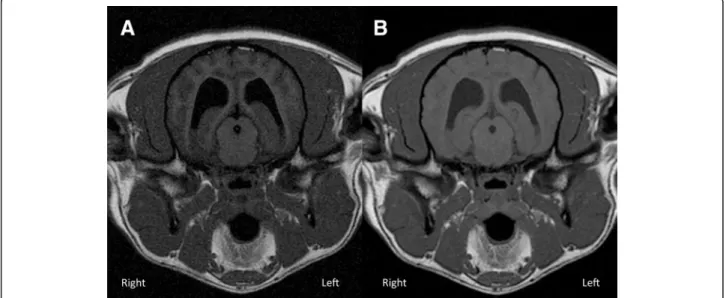
Analyzing CSF signal suppression, both quantitative and qualitative analysis showed that the suppression in the T1wFLAIR sequence was significantly better than in the T1wTSE one (Fig.3). This result represented a major advantage of the sequence, as the FLAIR allows the
signal originating from the CSF to be nullified, contrib-uting to a greater image contrast. The repeated inter-observer score varying between ‘almost perfect’ and ‘substantial’ in pre-contrast and post-contrast images indicate the repeatability and reliability of this result. CSF suppression can be advantageous in case of lesions in the subarachnoid space or intra-ventricular tumors or more in general in case of lesions located close to the CSF [28]. The nullification of the signal originating from the fluid adjacent/surrounding the lesion can improve its visualization [28].
Excluding noise there were a number of artifacts that affected image quality with T1wTSE images less affected in comparison to those of T1w FLAIR. Magnetic suscep-tibility was the most frequently observed artifact affect-ing over 80% of the T1wFLAIR pre and post contrast sequences compared to less that 20% of the T1wTSE ones. This artifact was reported by all observers affecting the rostral or caudal aspects of the skull, respectively at the level of the frontal sinuses, the olfactory bulbs and at the caudal fossa. In the human literature [5,6] magnetic susceptibility has been reported, mainly but not exclu-sively in patients with metallic implants. The impact of this artifact can be reduced by the use of a longer echo train length; however, this would result in an increase in ghosting and blurring artifacts that also compromise image quality [5]. Other artifacts (chemical shift, flow artifact, Truncation artifact, wrap around artifact and volume averaging) were present but had no significant difference between sequences.
The qualitative results of the study were examined in two ways as a composite VGAS and a VGA of ‘overall
Fig. 3aTransverse T1wFLAIR (TE/TR/TI: 16 ms/2000 ms/600 ms; NEX: 2. ms; slice thickness 3 mm; Window Level: 1359; Window Width: 2613);b) Transverse T1wTSE (TE/TR: 11 ms/470 ms; NEX: 3. ms; slice thickness 3 mm; Window Level: 1359; Window Width: 2613) at the level of the thalamus
in a medium size dog. T1wFLAIR (a) shows a better CSF signal suppression compared to T1wTSE (b). In (a) there is also better WM-CSF and
image quality’. The composite VGAS was an amalgam of all the variables excluding‘overall image quality’, consid-ering each parameter equal in importance e.g. GM-WM contrast, CSF suppression etc., and their contribution to image quality. ‘Overall image quality’ was based on personal judgement of the image and each observer was likely to attribute a different significance to each param-eter, leading to a less objective evaluation compared to the composite VGAS. While the composite VGAS dem-onstrated T1wFLAIR to provide significantly better image quality (Tables3 and 4), the t-test results for the VGA score for the single parameter“overall image qual-ity”, by the observers showed no statistically significant difference between the sequences in either pre-contrast or post-contrast studies. This discrepancy in the results may be that despite the superior contrast of the brain tissue in the T1wFLAIR sequence as evidenced by the composite VGAS, the increased levels of noise and the greater incidence of the magnetic susceptibility artifact rendered the images less visually appealing. Thus, ob-servers judged the image quality to be equivocal between T1wFLAIR and T1wTSE and the marginal difference in the “overall image quality” between the sequences is highlighted by the ‘poor’ inter-observer agreement for both pre and post-contrast images. This was reinforced by the ‘moderate’ intraobserver agreement, indicating that the observers themselves regularly changed their preferred sequence highlighting the negligible difference in‘overall image quality’.
The secondary aim of the study was to investigate the effectiveness of the IR sequence in detecting intracranial lesions. Although insufficient case numbers with lesions were present in the study to permit statistical analysis, there were sufficient numbers to highlight trends in the data. The results suggest that administration of a con-trast media improves lesion detection in both sequences with 6 cases being visualized in both pre-contrast studies compared to 8 in the post contrast ones. According to our results, pre-contrast T1wFLAIR imaging provided both better lesion definition and margination when com-pared to standard T1wTSE; however, after contrast administration the detection was almost equivalent be-tween sequences and slightly improved margination in the T1wTSE was reported (Fig. 1). This is partially in conflict with Qian et al (2008) which indicated the inver-sion recovery as the sequence providing higher leinver-sions’ contrast enhancement [8]. This discrepancy may be due to the different pathologies included in the two studies, as Qian et al only investigated neoplastic lesions [8]. The current study results partially agree with Lee et al’sstudy (2000); that showed T1wFLAIR equivalent or superior for lesion detectability compared to T1wTSE in pre con-trast images but differs from this study as they found post-contrast T1wFLAIR’s superiority was maintained
[6]. Further research in which a greater number of intra-cranial lesions are present should the considered to allow statistical analysis, although the results may be inconclusive as it remains controversial even in the human medical literature [8–10,12].
Conclusion
T1wFLAIR demonstrated superior contrast of brain tissue when compared to T1wTSE both by quantitative and qualitative assessment in MRI veterinary imaging of the brain of dogs and cats. The IR sequence definitively showed better CSF suppression, WM-GM and WM-CSF definition pre- and post-contrast administration when compared to T1wTSE. The results also suggest that T1wFLAIR may be helpful in detecting intra-cranial lesions especially in pre-contrast images as they showed better lesion detectability and margination although further studies are required with increased case numbers to statistically confirm this hypothesis.
Hence, T1wFLAIR is a useful adjunctive sequence when investigating the brain of dogs and cats and may be more effective in pre contrast lesion detection.
Acknowledgements
The authors would like to thank Susan Connolly for the statistical analysis and Cheryl Baumel for the technical support and image acquisition.
Authors’contributions
CB: study design, case selection; image preparation; article writing. SH: study design, image analysis; article writing and correction. KW: image analysis; article correction. CS: study design, image analysis; article writing and correction. All authors read and approved the final manuscript.
Funding
No funding.
Availability of data and materials
All data generated for this study are included in the presented article.
Ethics approval and consent to participate
As the T1wFLAIR and T1wTSE sequences were routinely being conducted for examination of the brain, the study was exempt from ethical review.
Consent for publication
Not applicable.
Competing interests
The authors declare that they have no competing interests.
Author details
1School of Veterinary Medicine Teaching Hospital, University College Dublin,
Belfield, Dublin, Ireland.2Department of Surgical Sciences, University of Wisconsin, Madison, WI 53706, USA.
Received: 4 February 2019 Accepted: 1 July 2019
References
1. Robertson I. Optimal magnetic resonance imaging of the brain. Vet Radiol
Ultrasound. 2011;52(Suppl 1):15–22 Wiley/Blackwell (10.1111).http://doi.
wiley.com/10.1111/j.1740-8261.2010.01781.x.
2. Joslyn S, Hague D. Magnetic resonance imaging of the small animal brain. In
3. Bydder GM, Young IR. MR imaging: clinical use of the inversion recovery
sequence. J Comput Assist Tomogr. 1985;9:659–75http://eutils.ncbi.nlm.nih.
gov/entrez/eutils/elink.fcgi?dbfrom=pubmed&id=2991345&retmode= ref&cmd=prlinks.
4. Rydberg JN, Hammond CA, Huston J, Jack CR, Grimm RC, Riederer SJ.
T1-weighted MR imaging of the brain using a fast inversion recovery pulse
sequence. J Magn Reson Imaging. 1996;6:356–62.https://doi.org/10.1002/
jmri.1880060216.
5. Melhem ER, Israel DA, Eustace S, Jara H. MR of the spine with a fast
T1-weighted fluid-attenuated inversion recovery sequence. AJNR Am J
Neuroradiol. 1997;18:447–54.http://www.ajnr.org/content/18/3/447.long.
6. Lee JK, Choi HY, Lee SW, Baek SY. Usefulness of T1-weighted image with
fast inversion recovery technique in intracranial lesions: comparison with
T1-weighted spin echo image. Clin Imaging. 2000;24:263–9https://doi.org/1
0.1016/S0899-7071(00)00229-1.
7. Hori M, Okubo T, Uozumi K, Ishigame K, Kumagai H, Araki T. T1-weighted
fluid-attenuated inversion recovery at low field strength: a viable alternative
for t1-weighted intracranial imaging. AJNR Am J Neuroradiol. 2003;24:648–
51http://www.ajnr.org/content/ajnr/24/4/648.full.pdf.
8. Qian YF, Yu CL, Zhang C, Yu YQ. MR T1-weighted inversion recovery imaging in
detecting brain metastases: could it replace T1-weighted spin-echo imaging?
AJNR Am J Neuroradiol. 2008;29:701–4https://doi.org/10.3174/ajnr.A0907.
9. Al-Saeed O, Ismail M, Athyal RP, Rudwan M, Khafajee S. T1-weighted
fluid-attenuated inversion recovery and T1-weighted fast spin-echo contrast-enhanced imaging: a comparison in 20 patients with brain lesions. J Med
Imaging Radiat Oncol. 2009;53:366–72https://doi.org/10.1111/j.1754-9485.2
009.02093.x.
10. Jeong B, Choi DS, Shin HS, Choi HY, Park MJ, Jeon KN, Na JB, Chung SH.
T1-weighted FLAIR MR imaging for the evaluation of enhancing brain tumors: comparison with spin echo imaging. J Korean Soc Magn Reson Med. 2014;
18:1516https://doi.org/10.13104/jksmrm.2014.18.2.151.
11. Lavdas E, Vlychou M, Arikidis N, Kapsalaki E, Roka V, Fezoulidis IV.
Comparison of T1-weighted fast spin-echo and T1-weighted fluid-attenuated inversion recovery images of the lumbar spine at 3.0 tesla. Acta
Radiol. 2010;51:290–5.https://doi.org/10.3109/02841850903501650.
12. Melhem ER, Bert RJ, Walker RE. Usefulness of optimized
gadolinium-enhanced fast fluid attenuated inversion recovery MR imaging in revealing
lesions of the brain. 1998;171:803–807.http://www.ajronline.org/doi/1
0.2214/ajr.171.3.9725320.
13. Falzone C, Rossi F, Calistri M, Tranquillo M, Baroni M. Contrast-enhanced
fluid-attenuated inversion recovery vs. contrast-enhanced spin echo
T1-weighted brain imaging. Vet Radiol Ultrasound. 2008;49:333–8.
14. Hendrick RE. Signal, noise, signal-to-noise and contrast-to-noise ratios. Breast
MRI. 1st edition. New York: Springer; 2008. p. 93–111.
15. Tingberg A. Quantifying the quality of medical x-ray images. An evaluation
based on normal anatomy for lumbar spine and chest radiography. 2000. http://lup.lub.lu.se/record/40610.
16. Månsson LG. Methods for the evaluation of image quality: a review. Radiat Prot
Dosim. 2000;90:89–99https://doi.org/10.1093/oxfordjournals.rpd.a033149.
17. Båth M, Månsson LG. Visual grading characteristics (VGC) analysis: a
non-parametric rank-invariant statistical method for image quality evaluation. Br
J Radiol. 2007;80:169–76.https://doi.org/10.1259/bjr/35012658.
18. Tesselaar E, Dahlström N, Sandborg M. Clinical audit of image quality in
radiology using visual grading characteristics analysis. Radiat Prot Dosim.
2016;169:340–6https://doi.org/10.1093/rpd/ncv411.
19. Båth M. Evaluating imaging systems: practical applications. Radiat Prot
Dosim. 2010;139:26–36https://doi.org/10.1093/rpd/ncq007.
20. Ludewig E, Richter A, Frame M. Diagnostic imaging–evaluating image
quality using visual grading characteristic (VGC) analysis. Vet Res Commun.
2010;34:473–9.https://doi.org/10.1007/s11259-010-9413-2.
21. Kwak SG, Kim JH. Central limit theorem: the cornerstone of modern
statistics. Korean J anesthesiol. 2017;70:144–56.
22. Landis JR, Koch GG. The measurement of observer agreement for
categorical data. Biometrics. 1977;33:159–74https://www.jstor.org/
stable/2529310?origin=crossref.
23. Westbrook C, Roth CK. Talbot J. MRI in practice. 4th ed. Oxford:
Wiley-Blackwell; 2011.
24. Conover WJ. Pratical nonparametric statistics. 3rd ed. Hoboken, NJ: John
Wiley and Sons; 1998.
25. Bley TA, Wieben O, François CJ, Brittain JH, Reeder SB. Fat and water
magnetic resonance imaging. J Magn Reson Imaging. 2010;31:4–18.https://
doi.org/10.1002/jmri.21895.
26. Minov M, Popovska M, Doreski A, Markoski G, Jovanoska S. How
radiographers can improve MR image - optimizing factors affecting signal-to-noise ratio (SNR). Poster presented at: European conference of radiology. Annual meeting of the European Society of Radiology, 2013, Vienna.
27. Edelstein WA, Glover GH, Hardy CJ, Redington RW. The intrinsic
signal-to-noise ratio in NMR imaging. Magn Reson Med. 1986;3:604–18https://doi.
org/10.1002/mrm.1910030413.
28. Mai W. Image characteristics in MRI and principal pulse sequences.
Diagnostic MRI in dogs and cats. 1st ed. Boca Raton, FL: CRC Press; 2018. p.
36–69.
Publisher’s Note