AENSI Journals
Australian Journal of Basic and Applied Sciences
ISSN:1991-8178
Journal home page: www.ajbasweb.com
Corresponding Author: Mohamad Afif Saman, Faculty of Engineering, International Islamic University Malaysia, Jalan Gombak, 533100, Kuala Lumpur, Malaysia.
Tel: 6019-6562952; E-mail: [email protected]
Development of Spectrum Management Tool Using Open-Source Geographical
Information System (GIS) Software
1
Mohamad Afif Saman, 1Ahmad Fadzil Ismail, 1Nuurul Hudaa Mohd Sobli, 2Ahmad Nasruddin 'Atiqullah Fakrullah, 3 Wahidah Hashim
1 Faculty of Engineering , International Islamic University Malaysia, Jalan Gombak, 533100, Kuala Lumpur, Malaysia
2 Malaysian Communications and Multimedia Commission, Off Persiaran Multimedia, 63000, Cyberjaya, Selangor Darul Ehsan, Malaysia 3 College of Information Technology, Universiti Tenaga Nasional, Jalan IKRAM-UNITEN, 43000 Kajang, Selangor, Malaysia
A R T I C L E I N F O A B S T R A C T Article history:
Received 30 September 2014 Received in revised form 17 November 2014 Accepted 25 November 2014 Available online 13 December 2014
Keywords:
Spectrum Management, Spectrum Planning, Open-source, GIS
Background: Mobile communication is one of the fastest evolving technologies in the world. With the availability of new services and applications, the demand for spectrum access is increasing. However since the spectrum is a limited source, a proper planning to accommodate this demand is required. Proprietary spectrum management software is expensive and not a cost effective solution in a long run. It is also too rigid to adapt with the mobile communication rapid evolution. There is a need for low cost home-grown spectrum management tool that can assist regulatory body in spectrum management process. The tool must be able to help in managing existing spectrum and also for new spectrum planning. This paper outlines the use of open-source resources to develop the proposed tool. The tool incorporates and embeds the rules and regulations specified by Malaysian authority. The home-grown tool is able to carry out spectrum planning and management for 2G, Global System for Mobile Communications (GSM), and 3G, Universal Mobile Telecommunications System (UMTS) networks.
© 2014 AENSI Publisher All rights reserved. To Cite This Article: Mohamad Afif Saman, Ahmad Fadzil Ismail, Nuurul Hudaa Mohd Sobli, Ahmad Nasruddin 'Atiqullah Fakrullah, Wahidah Hashim., Development of Spectrum Management Tool Using Open-Source Geographical Information System (GIS) Software.
Aust. J. Basic & Appl. Sci., 8(24): 275-282, 2014
INTRODUCTION
In today’s society, mobile communication has become one of the basic needs of living. With the development of mobile devices such as smartphone and tablet computer, people are accessing the internet anytime, anywhere. They stream media online, uploading and downloading files and accessing social media sites from their devices. This attracts more people to go mobile and increases the number of subscribers in telecommunication network. Subsequently, more spectrum bandwidth is needed to cater the increasing number of users in mobile communication. However, since radio frequency (RF) spectrum is a limited resource, a proper planning is needed to increase the spectrum access (Chandra, 2009). Fundamentally, spectrum access can be increased by increasing the number of base station. Installing new base station requires detail planning since interference can happen between base stations. Interference can lower the quality of service (QoS) in the network and can lead to signal corruption.
Adjacent channel interference and co-channel interference are two types of interference that commonly occur in mobile network (Schiller, 2003). Adjacent channel interference happened when the adjacent channels overlapped with each other. This occurs when the adjacent channels are occupied by two different providers. A simple solution to mitigate this is by building the adjacent channels BS far away from each other. Another common interference is the co-channel interference. Since RF spectrum is a scarce resource, the same frequency channel has to be reuse in order to increase the spectrum availability. However, interference can happen if the channel BSs are built within the reuse distance. In order to mitigate this problem, the distance between the co-channel BS must be set farther than the reuse distance. The reuse distance is much dependent on the cell radius and network cluster size.
technology is constantly changing without any sign of stopping. Using proprietary software can be very costly in a long run. Regulatory bodies need to spend hundred thousands of dollars to pay the developer just to keep up with the changes. It is now evident that there is a need to develop a home-grown spectrum management tool that not only cost effective but also can adapt to new technology in mobile communication. This can be achieved by using open-source resources. Open-source technology evolves very quickly as there is less restriction in its development. It is also a lot easier and quicker for applications to be built using open-source resources as it is
very adaptable with new technology as compared to proprietary resources (Acuna et al., 2012). This paper
proposed the use of open-source geographical information system (GIS) software to develop a home-grown spectrum management tool. With rapid evolvement of open-source resource, an advance and flexible tool can be developed.
This paper is structured as follows. Section 2 outlines the research scope and methodology. Section 3 discusses the path loss models and its implementation. Section 4 summarizes the proposed tool overall design and development. Section 5 highlights the results and findings of the research. Section 6 concludes the research of this paper. Section 7 offers recommends and suggestions for future development.
Research Scope and Methodology:
The proposed spectrum management tool is aims to help regulatory bodies to manage radio spectrum. Spectrum planning, interference identification, and spectrum management and monitoring are among the common tasks in spectrum management system (SKMM, 2007). The current development of the research is focusing on cellular network particularly Global System for Mobile Communications (GSM) and Universal Mobile Telecommunications System (UMTS) networks in Malaysia. The current prototype of the proposed tool is able to assist in spectrum planning and interference identification. The tool is also developed only using open-source reopen-sources without having to depend on commercial reopen-sources.
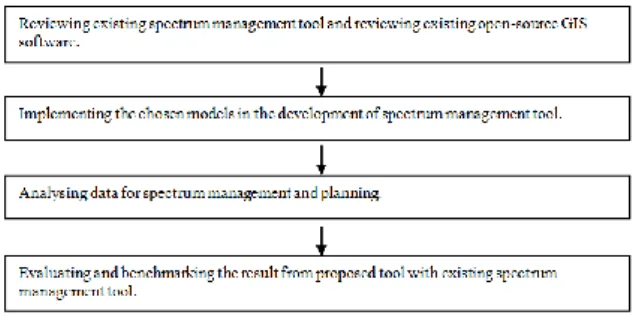
A. Methodology :
The activities in Fig.1. serve as the guideline for the development of proposed spectrum management tool.
Fig. 1: Research methodology flow chart.
Path Loss Modeling and Implementation:
Propagation distance determines the cell coverage area of base station. Propagation distance can be calculated using RF propagation path loss model. There is no restriction on how extensive RF propagation path loss modelling should be. In this research, the proposed tool implements the available standard path loss models which are Hata model for GSM900 and Cost-231 Hata model for GSM1800 and UMTS2100 (Blaunstein and Christodoulou, 2007). The path loss for GSM900 is calculated using Hata model equation as given:
69.55 26.16 10
c 13.82 10( tr) ( re) (44.9 6.55 10( tr)) 10( ) .LP dB Log f Log h a h Log h Log d K
(1)
Where:
d= distance between base station and mobile station in km.
fc= carrier frequency in MHz.
htr = Base antenna height in meter.
hre= Mobile antenna height in meter.
10 10
2 10
(1.1 ( ) 0.7) (1.56 ( ) 0.8), , ( )
3.2( 11.75( )) 4.97, arg ( 400)
c re c
re
e c
r
Log f h Log f open suburban and small city area a h
Log h l e city f
(2)
2
10 10
2 10
4.78( ( )) 18.33.78 ( ) 40.94,
2[ ] 5.4,
28
0,
c c
c
Log f Log f open area
f
K Log suburban area
me
arg ( c 400)
dium small City and l e city f
The path loss for GSM1800 and UMTS2100 can be calculated using Cost-231 equation as given:
10 10 10 10
( ) 46.3 33.9 ( ) 13.82c ( tr) ( re) (44.9 6.55 ( tr)) ( )
LP dB Log f Log h a h Log h Log d C (4)
Where:
d= distance between base station and mobile station in km.
fc= carrier frequency in MHz.
htr = Base antenna height in meter.
hre= Mobile antenna height in meter.
a(hre) = equation (2)
C = 0, medium city and suburban areas or C = 3, metropolitan areas
By rearranging terms (1) into (5) and (4) into (6), the propagation distance can be represented by:
10 10
10
10
69.55 26.16 13.82 ( ) ( )
44.9 6.55 ( )
c tr re
tr
LP dB Log f Log h a h K
d antilog Log h
(5)
10
1010
10
46.3 33.9 13.82 ( ) ( )
44.9 6.55 ( )
tr re
tr c
LP dB Log f Log h a h C
d antilog Log h
(6)
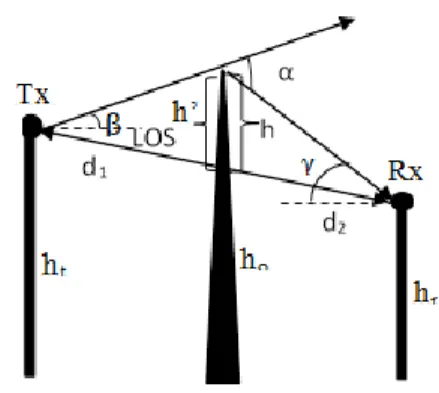
Ideally RF propagates in free space. However in really, there are external factors from the environment that will influence the RF propagation. Foliage, weather conditions, man-made structures and hills are among the RF propagation obstructers. These obstruction will induce additional effects mainly reflection, scattering and diffraction. While the chosen path loss models empirically include the loss due to area types, this is still not enough to model the actual propagation. The proposed tool includes diffraction loss effect due to terrain in the overall path loss calculation. This research considers the single knife-diffraction effect modelling to illustrate this effect and the loss is calculated using equations (2) or (4). The Fresnel-Kirchhoff diffraction parameter, v has to be determined first. The value of v can be calculated using equation (7) for situation in Fig.2 or equation (8) for situation in Fig.3. which then simplified into Fig.4 (Seybold, 2005).
Fig. 2: Transmitter, Tx and receiver, Rx are n same height.
2 2
1 2
2(d d)
v h
d d
(7)
Fig. 4: Simplified version of Fig.3.
1 2
2 2
2
,
( )
d d
v where
d d
(8) The threshold value for the path loss is determined by the receiver sensitivity. It can be calculated using the equation:
max T TO s
LP P G R (9)
Where
LPmax = Losses in dB
PT = Transmitted Power in dBm
GTO= Total gains in dB
Rs = Receiver sensitivity in dBm
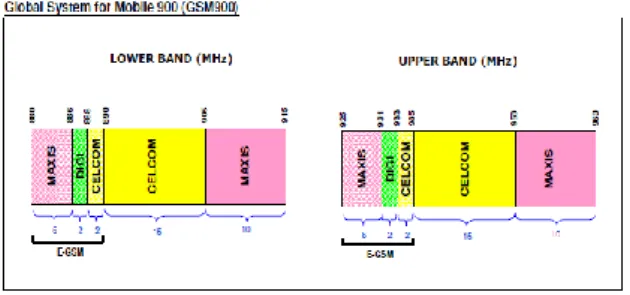
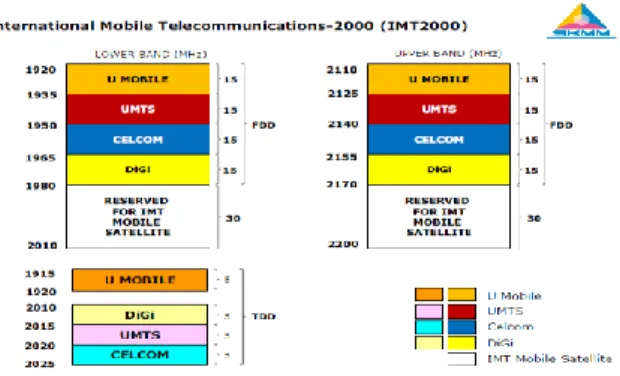
Since the research is focusing on cellular network in Malaysia, the rules and regulations outlined by MCMC has been adopted in the proposed tool. MCMC has assigned specific blocks of channels to cellular service providers in Malaysia. They are expected to abide the assignment shown in Fig.5. and Fig.6. for GSM networks and Fig.9. for UMTS2100 network (SKMM, 2012).
Fig. 5: GSM900 Frequency Band Assignment (SKMM, 2012).
Fig. 7: IMT2000 (UMTS2100) Frequency Band Assignment (SKMM, 2012).
Software Design and Development:
This paper intends to outline the usage of open-source resources in the development of the proposed spectrum management tool. The emergence of open-source GIS has led to it usage in several communication research field such as works by (Shu et al., 2011), (Alexandris and Giannikos, 2010) and (Umar et al., 2011). GIS is a tool that mainly used for managing spatial data and display the data on the map (Quantum GIS, 2013). An open-source GIS, Quantum GIS (QGIS) 2.2.0, Valmiera has been chosen as the GIS platform. The tool is developed in form of QGIS plugin using PyQT programming language. The tool has user friendly graphical user interface (GUI) and easy to navigate. Data are stored inside the database and hard disk. The tool uses open-source database management system (DBMS), PostgreSQL with PostGIS extention to manage the spatial data. The overall architecture of the propose tool is described in Fig.8.
Fig. 8: Tool’s overall structure.
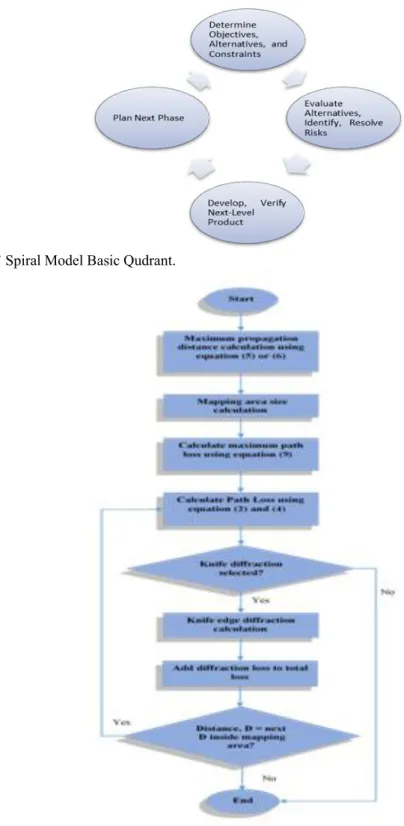
The development process of the developed tool is adapted from Boehm spiral software process model. Four basic quadrants of spiral model in Fig.9. have been iterated cyclically throughout the development process (Pressman, 2010). At the current stage, a prototype for the proposed tool has been completely developed. The tool takes the path loss value which is a continuous data as the output for displaying the coverage area on the map. The first procedure entails task where the tool will determine the propagation distance of the base station. Next, path loss values for a square area which based on the propagation distance are calculated. Diffraction loss is then implemented, depending whether users choose to include knife-diffraction loss for the calculation. Finally, a raster image will be drawn as the output. The coverage area shape is determined according to the chosen base station antenna type. The flow chart of the process is depicted in Fig.10. A simple adjacent and co-channel interference algorithm have also been implemented using the adjacent cell distance and reuse distance separation techniques.
Preliminary Results and Discussion:
Fig. 9: Boehm’ Spiral Model Basic Qudrant.
Fig. 10: Flow chart for calculation coverage area display of proposed tool.
in specific area. The tool provides a simple adjacent cell and co-channel interferences identification. It can be useful in planning new base station to avoid interference. The tool also offers antenna pattern library which the pattern can be displayed on the map accordingly.
Fig. 21: Spectrum Display GUI.
Fig. 32: Plugins pop-up menu on menu bar.
Fig. 43: Cell coverage without diffraction loss.
Conclusion:
Fig. 54: Cell coverage with diffraction loss.
Future Work:
The current prototype only has path loss as the unit measurement for output. The next prototype can include received power and field strength as measurement units. Other propagation models such as Walfisch-Ikegami model, Consultative Committee on International Radio (CCIR) model, or Longley-Rice model can be included in the proposed tool in addition to the existing propagation models. Detail multi-path effects can also be designed and included for better accuracy. The tool can be enhanced further to include more functionality such as LTE network, energy harvesting or display RF radiation level.
ACKNOWLEDGEMENT
The authors wish to thank Malaysia Meteorological Department (MMD), Ministry of Science, Technology and Science, and IIUM Endowment Research Grant Funding for their endless support and help for this research.
REFERENCE
Acuna, S.T., J.W. Castro, O. Dieste and N. Juristo, 2012. A Systematic Mapping Study on the Open Source Software Development Process, 16th International Conference on Evaluation & Assessment in Software Engineering (EASE 2012), Ciudad Real, pp: 42-46.
Alexandris, G. and I. Giannikos, 2010. A new model for maximal coverage exploiting GIS capabilities, European Journal of Operational Research, pp: 328-338.
Blaunstein, N. and C. Christodoulou, 2007 Radio Propagation and Adaptive Antennas for Wireless Communication Links, New Jersey, Wiley.
Chandra, A., 2009. Spectrum Management for Future Generation Wireless Based Technology. European Wireless Technology Conference, (EuWIT), Rome, pp: 201-205.
Latef, A.S.A. and R. Hassan, 2011. Spectrum Management System: A Study. International Conference on Electrical Engineering and Informatics (ICEEI), Bandung, pp: 1-6.
Pressman, R.S., 2010. Software Engineering, A Practitioner’s Approach, 7th edn, McGraw-Hill, pp: 41-43. Quantum, G.I.S., 2013. “Index”, [ONLINE], Available: http://www.qgis.org/
Schiller, J., 2003. Mobile Communication, 2nd edn, Pearson Education, Great Britain, pp: 43-44. Seybold, J.S., 2005. Introduction To RF Propagation, Wiley, United States of America, pp: 175-180 SKMM: MyCovergence, 2007. Malaysia, 1(1): 36-41.
SKMM, 2012. Spectrum Management, [ONLINE], Available:
http://www.skmm.gov.my/Spectrum/Spectrum-Management.aspx
Shu, Z., H. Li, G. Liu and Q. Xie, 2011. Application of GIS in Telecommunication Information Resources Management System, International Conference on Information Management, Innovation Management and Industrial Engineering (ICIII), Shenzen, pp: 401-404.