Zinc Ferrite Nanoparticle Synthesis and Characterization; Effects of Annealing
Temperature on the Size of nanoparticles
1
Israf Ud Din,
1S. Tasleem,
2A. Naeem,
3Maizatul S. Shaharun,
4Ghassan M.J. Al Kaisy
1
Chemistry Department, Kohat University of Science and Technology, Pakistan
2
National Center of Excellence in Physical Chemistry, University of Peshawar, Pakistan
3
Department of Fundamental and Applied Sciences, Universiti Teknologi PETRONAS, Malaysia
4
Department of Chemical Engineering,Universiti Teknologi PETRONAS, Malaysia
Abstract: Zinc ferrite nanoparticles have been synthesized by co-precipitation method from Fe(NO3)3.9H2O and Zn(NO3)2.6H2O. Oleic acid was used as surfactant and the reaction was carried out in basic medium by using sodium hydroxide solution. The nanoparticles synthesized were annealed at different annealing temperatures of 500 ºC, 600 ºC, 800 ºC, and 900ºC. The size of nanoparticles was also analyzed at a constant annealing temperature for different duration of time. X-ray diffraction pattern confirmed the formation of single-phase nanoparticles of zinc ferrite. Fourier transform infrared study was performed to ascertain the structure of the nanoparticles. FT-IR studies also supported the trend of increasing size as shown by XRD results. The study revealed that size of the nanoparticles increased linearly with increasing annealing temperature due to coercity, while there was no remarkable change in size by the duration of the annealing temperature.
Key words: nanoparticles, chemical synthesis, XRD, FT-IR
INTRODUCTION
Ferrite nanoparticles are under intense research because of their unique chemical, mechanical and structural properties (Dariel, M., et al., 1987). Ferrite nanoparticles have versatile application in catalysis, electronics, photonics, sensors and ferro fluids (Guo, R., et al., 2010; Hakuta, Y., et al., 2005; Sivakumar, P., et al., 2011). Ferrite nanoparticles are also used in biomedical sciences. Due to their unique size and shape, they can easily reach to the body parts where other conventional drugs find hard to reach. Size of the particles depends mostly on the preparation method and conditions. In The literature, there are a number of methods like as hydrothermal synthesis, mechanical Milling and hydrolysis of metal carboxylate in organic solvent can be used for the synthesis of nanoparticles (Hadjipanayis, G.C., R.W. Siegel (Eds.), 1994; Mojumdar, S.C., et al., 2005). Every method has the merits and demerits regarding the control of particles size and durability.
Ammar et al., (2006), prepared zinc ferrite nanoparticles by forced hydrolysis in a polyol medium. They reported that the magnetization was increased with decreasing the size of the zinc ferrite nanoparticles. Yang et al (2008), synthesized zinc ferrite nanoparticles by the tartrate precursor method. They reported that stoichiometry and phase purity of zinc ferrite nanoparticles are affected by intermediate phases during preparation of nanoparticles. Drofenik et al., (2008) synthesized zinc ferrite nanoparticles by using ultrasonic radiation. They reported that zinc ferrite nanoparticles prepared by ultrasonic radiations have highest saturation magnetization because of the substitution of Fe+3 by Zn+2 upto molecular composotion of Zn Fe2O4. Bardhan et al., (2010), synthesized zinc ferrite nanoparticles by solid-state combustion method. They found that conductivity decreased with decreasing the particle size. Swamy et al., (2011) prepared zinc ferrite nanoparticles by self-propagating low-temperature combustion method. They reported that the average size of the particles was 40 nm. They also repoted that this is a low cost method which can be used to synthesize other metal ferrite and mixed metals ferrite nanoparticles.
In the present work zinc ferrite nanoparticles have been synthesized by wet chemical method. The product was annealed at different temperature, to study the variation in particle size. In addition the size variation was also studied as a function of duration of annealing conditions.
Experimental: 2.1 Materials:
Iron nitrate nonahydrate Fe(NO3)3.9H2O, Zinc nitrate hexahydrate Zn(NO3)2.6H2O, sodium hydroxide NaOH and oleic acid purchased from Merck, were of purity 98-99%. The chemicals were used without further purification.
Zinc ferrite nanoparticles were synthesized by co-precipitation method, using starting material of iron nitrate nonahydrate, Fe(NO3)3.9H2O and Zinc nitratehexahydrate Zn(NO3)2.6H2O (Figure 1). Oleic acid was used as a surfactant to prevent the agglomeration of nanoparticles. 30 ml of 0.2 M zinc nitrate solution were mixed with 30 ml of 0.4 M iron nitrate solution in 500 ml beaker. The initial pH of the solution was noted as 1.14 because of the presence of nitric and nitrouse acids. The solution was constantly stirred with the help of magnetic stirrer. 10-15 ml of 3 M solution of NaOH was added drop wise to adjust the pH of solution 11-12, with constant stirring. The reaction is carried out in higher values of pH, because in this pH range the size of the particles as well as their nucleation rate is controlled (Jolivet, J.P., et al., 1997). A little amount of oleic acid 4-5 drops were added to the solution. Oleic acid prevents the agglomeration of the nanoparticles. The solution was then brought to reaction temperature of 80ºC. The solution was stirred for 60 minutes and subsequently cooled to room temperature. The solution was decanted and washed twice with distilled water and finally with ethanol to remove the impurities and excess surfactant. The as-synthesized nanoparticles were centrifuged for 15 minutes at 3500 rpm and dried overnight at 105ºC. The dried particles were milled in agate mortar. The powder nanoparticles were annealed at different temperatures of 500 ºC, 600 ºC, 800 ºC, and 900ºC for 4 hours and also for different time interval at the same annealing temperature of 800ºC.
2.3. Characterization:
Structure and crystallinity of synthesized nanoparticles was analyzed by X-ray diffraction technique (XRD). The formation of zinc ferrite nanoparticles was confirmed by Fourier transform infrared (FT-IR) studies. X-ray diffraction (XRD) data was collected at room temperature on a Bruker D8 Advance Diffractometer using monochromatic Cu Kα radiation. Crystallographic properties e.g. phase of the material and crystal structure was determined using the same equipment.
FT-IR analysis was carried out by using Perkin-Elmer spectrum one instrument in the range of 4500-100 cm-1. The samples were pelleted with KBr.
RESULTS AND DISCUSSION
3.1. X-ray diffraction (XRD) Analysis:
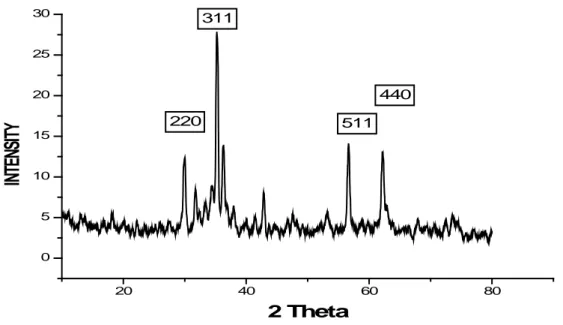
The X-ray diffraction patterns of zinc ferrite (ZnFe2O4) nanoparticles annealed at different temperatures are shown (Figures 2-6). The XRD spectra showed all the characteristics peaks corresponding to the characteristic planes (311), (511)and (440) appear at 35°, 57° and 64° (Girshick, L., P. Chiu, 1990), of Zinc ferrite nanopartciles with JCPDS card No. 82-1049. Fig. 2 shows a typical X-ray diffraction pattern of a ZnFe2O4, well-defined diffraction peaks, confirming the formation of zinc ferrite nanoparticles. The sample was calcined at 500 ºC, hence less crystallinity is observed in this spectrum. Figure 3 shows the XRD spectra of zinc ferrite nanoparticles calcined at 600 ºC. The spectra shows that zinc ferrite nanoparticles are more crystalline at this temperature. The peak is sharper and narrower as compared to figure 2 spectra. The sharpness of the XRD spectra shows that crystallinity is increased with increasing the annealing temperature. The peak study of the spectra XRD spectra of zinc ferrite nanoparticles calcined at 800 ºC (Figure 4), shows that peaks are sharper at this temperature as compared to the previous peaks. This trend can also be observed by analyzing the XRD spectra of zinc ferrite nanoparticles calcined at 900 ºC (Figure 5). The sharpness of the XRD peaks is maximum for this spectra out of all the spectra recorded in this study. The sharpness of the peaks is also a good indicator for the increased size of the nanoparticles, as the particle size is increased by increasing the sharpness of the peak (Sui, Y.P., et al., 2003). By increasing the annealing temperature, the diffraction peaks become sharper and narrower and increase in intensity. This is because of the amplification in crystallinity that leads to the increased particle size of the nuclei (Sui, Y.P., et al., 2003). Hence, a maximum particle size of 51 nm was observed for zinc ferrite nanoparticles at this temperature. Figure 6 shows the XRD spectra of zinc ferrite nanoparticles calcined at different temperatures. It is evident from the XRD Pattern that crystallinity of ferrite nanoparticles is increased by increasing the annealing temperature.
3.2. Particle Size Calculation of Zinc ferrite nanoparticles by Scherer formula:
The size of the zinc ferrite nanoparticles at different annealing temperatures was calculated using Scherrer equation for the [311] diffraction peak (Cornell, R.M., U. Schwertmann, 1996)]
θ
β
cos
λ
9
.
0
=
D
Size of nanoparticles calculated by Scherrer formula is given in table 1. It is evident from the tabulated data that particle size is increasing from 9 nm to 51 nm with increasing the annealing temperature from 500 ºC to 900 ºC.
Table 1: Size of Zinc ferrite nanoparticles annealed at different Temperatures.
Sample ID Annealing Temperature (ºC) Size (nm)
ZF1 500 9
ZF2 600 12
ZF3 800 26
ZF4 900 51
Table 2: Size of Nickel ferrite nanoparticles for different duration of time at same annealing temperature of 800 ºC
Sample ID Annealing Temperature (ºC) Duration of Annealing Conditions (Hours)
Size (nm)
ZFa 800 6 26
ZFb 800 8 27
ZFc 800 10 25
ZFd 800 12 29
Fig. 1: Block diagram to obtain Zinc ferrite nanoparticles
3.3. Effect of Duration Of Annealing Temperature On The Particle Size Of Zinc Ferrite Nanoparticles:
Size of nickel ferrite nanoparticles as a function of duration of annealing temperature was also studied by XRD diffraction peak at the same annealing temperature of 800ºC. The results in Table 2 showed that the particle size of 26nm, 27nm, 25nm and 29 nm for the annealing time duration of 6 hours, 8 hours, 10 hours and 12 hours, respectively. These results indicate that there is no remarkable change in size with the variation of duration of annealing condition.
3.4. Fourier transform infrared (FT-IR) Studies:
peak at 3450 corresponds to the vibration of O-H and the light band at 1640 could be attributed to the adsorbed water or humidity (Jalaly, M., et al., 2009). This was further supported by disappearance of these bands at higher temperature. The strong absorption band at 426 cm−1 is ascribed as the stretching modes of Zn–O (Lepot, N., et al., 2007’ Kwon, Y.J., et al., 2002).
20 40 60 80
0 5 10 15 20
220
440 311
511
INT
ENS
IT
Y
2 Theta
Fig. 2: XRD Spectra of Zinc ferrite nanoparticles calcined at 500 ºC for 4 Hours.
20 40 60 80
0 5 10 15 20 25
440 511 220
311
INT
ENS
ITY
2 Theta
Fig. 3: XRD Spectra of Zinc ferrite nanoparticles calcined at 600 ºC for 4 Hours.
3.5 Particle Size estimation of Zinc ferrite nanoparticles by FT-IR:
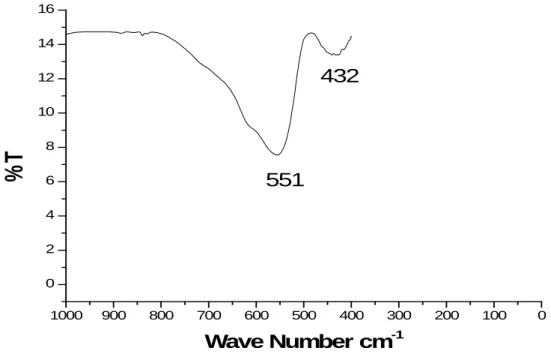
Although FT-IR cannot be used for the particles size calculation but the trend in the particles size can be analyzed by FT-IR spectra. Absorption band of a particular bond is shifted to the higher frequency when the size of the particles is increased (Mary kutty Thomas, S.K., K.C. Ghosh, 2002). In the current study, the absorption bands for [Fe ↔O] were observed at ∼550, ∼556, ∼561, and ∼570 cm-1 for the zinc ferrite nanoparticles calcined at 773, 873, 1073 and 1173 K respectively. Similarly, absorption bands for [Zn ↔O] were noted at ∼424, ∼432,
20 40 60 80 0
5 10 15 20 25 30
440 511 220
311
INT
ENS
IT
Y
2 Theta
Fig. 4: XRD Spectra of Zinc ferrite nanoparticles calcined at 800 ºC for 4 Hours
20 40 60 80
0 5 10 15 20 25 30 35 40 45
440
511 311
220
INT
ENS
IT
Y
2 Theta
20 40 60 80 0
20 40 60 80
100
d
c
b
a
INT
ENS
IT
Y
2 Theta
Fig. 6: XRD Spectra of Zinc ferrite nanoparticles calcined at (a) 500 ºC, (b) 600 ºC, (c) 800 ºC and (d) 900 ºC for 4 Hours.
4000 3000 2000 1000 0
0 2 4 6 8 10 12 14
430
550
1378 1630
3409
% T
Wave Number
cm
-11000 900 800 700 600 500 400 300 200 100 0 0
2 4 6 8 10 12 14 16
432
551
% T
Wave Number
cm
-1Fig. 8: FT-IR Spectra of Zinc ferrite nanoparticles calcined at 600 ºC for 4 Hours
800 700 600 500 400 300 200 100 0
2 4 6 8 10 12 14 16
434
554
% T
Wave Number
cm
-1800 700 600 500 400 300 200 100 0 2
4 6 8 10 12 14 16 18 20 22
436
557
% T
Wave Number
cm
-1Fig. 10: FT-IR Spectra of Zinc ferrite nanoparticles calcined at 900 ºC for 4 Hours
Conclusion:
Nanosized zinc ferrite particles were synthesized by co-precipitation methods at different annealing temperatures to analyze the effect of annealing temperature on the particle size of the compound. The structure of the compounds was confirmed by XRD. FT-IR analysis supported the formation of spinel structure of ferrite nanoparticles. The FT-IR spectra showed two characteristic metal oxygen vibrational bands, a Fe-O band, and Zn-O band.
Sherrer formula was utilized for the estimation of size of the zinc ferrite nanoparticles. Particles size of 9 nm, 12 nm, 26 nm and 51 nm were found at annealing temperature of 500 ºC 600 ºC, 800 ºC and 900 ºC respectively. The study shows that the particle size increases with increasing annealing temperature. The study of size of zinc ferrite nanoparticles calcined at the same temperature for different duration of time, revealed that there is no remarkable change in the size takes place.
ACKNOWLEDGEMENT
Financial assistance from Kohat University of Science and Technology is gratefully acknowledged.
REFERENCES
Dariel, M., L.H. Bennett, D.S. Lashmore, P. Lubitz, M. Rubinstein, W.L. Lechter, M.Z. Harford, 1987.
Guo, R., L. Fang, W. Dong, F. Zheng, M. Shen, 2010. Enhanced photocatalytic activity and ferromagnetism in Gd doped BiFeO3 nanoparticles. J. Phys. Chem. 114: 21390.
Hakuta, Y., H. Ura, H. Hayashi, K. Arai, 2005. Continuous production of BaTiO3 nanoparticles by hydrothermal synthesis. Ind. Eng. Chem. Res., 44: 840.
Sivakumar, P., R. Ramesh, A. Ramanand, S. Ponnusamy, C. Muthamizhchelvan, 2011. Preparation and properties of nickel ferrite (NiFe2O4) nanoparticles via sol–gel auto-combustion method. Materials Research Bulletin, 46: 2204-2207.
Hadjipanayis, G.C., R.W. Siegel (Eds.), 1994. Nanophase Materials—Synthesis-Properties-Applications, Kluwer Academic Publishers, Drodrecht,
Mojumdar, S.C., J. Miklovic, A. Krutoíková, D. Valigura and J.M. Stewart, 2005. Furopyridines and furopyridine-Ni(II) complexes Synthesis, thermal and spectral characterization J. Therm. Anal. Cal., 81: 211.
Yang, M., S. Yen, 2008. Evolution of intermediate phases in the synthesis of zinc ferrite nanopowders prepared by the tartrate precursor method.Journal of Alloys and Compounds.,450: 387-394.
Drofenik, M., M. Kristl, D. Makovec, Z. Jaglicic, D. Hanzel, 2008. Preparation and study of zinc ferrite nanoparticles with a high magnetization. Materials and Manufacturing Processes, 23(6): 603-606.
Bardhan, A., K. Ghosh, K. Mitra, C. Das, S. Mukherjee, K. Chattopadhyay, 2010. Low temperature synthesis of zinc ferrite nanoparticles. Solid State Sciences, 12: 839-844.
Swamy, M., S. Basavaraja, A. Lagashetty, N. Srinivasrao, R. N.ijagunappa, A. Venkataraman, 2011. Synthesis and characterization of zinc ferrite nanoparticles obtained by self-propagating low-temperature combustion method. Bull. Mater. Sci., 34(7): 1325-1330.
Jolivet, J.P., C. Chaneac, P. Prene, L. Vayssieres, E. Tronc, 1997. Wet Chemistry of Spinel Iron oxide Particles J. Phys. IV France, 7: C1-573.
Girshick, L., P. Chiu, 1990. Kinetic nucleation theory: a new expression for the rate of homogeneous nucleation from an ideal supersaturated vapour The Journal of Chemical Physics, 93(2): 1273-1277.
Sui, Y.P., X.F. Huang, Z.Y. Ma, W. Li, F. Qiao, K. Chen, K.J. Chen, 2003. The effect of thermal annealing on crystallization in a-Si:H/SiO2 multilayers by using layer by layer plasma oxidation, J. Phys. Condens. Matter., 15: 5793-5800.
Cornell, R.M., U. Schwertmann, 1996. The iron oxides: structure, properties, reactions, occurrence and uses(VCH: Weinheim).
Rao, G.S., C.N.R. Rao, J.R. Ferraro, 1970. Infrared and Electronic Spectra of Rare Earth Perovskites: Ortho-Chromites, -Manganites and -Ferrites. Appl. Spectrosc,24: 436.
Ibrahim1, M., M. Alaam1, H. El-Haes2, A.F. Jalbout3, 2006. A. de Leon, Analysis of the structure and vibrational spectra of glucose and fructose.Ecletica Quimica, 31(3).
Jalaly, M., M.H. Enayati, F. Karimzadeh, and P. Kameli, 2009. "Mechanosynthesis of nanostructured magnetic Ni-Zn ferrite," Powder Technology, 193: 150-153.
Lepot, N., M.K. Van Bael, H. Van den Rul, J. D'Haen, R. Peeters, D. Franco, J. Mullens, 2007
Kwon, Y.J., K.H. Kim, C.S. Lim, K.B. Shim, 2002. Characterization of ZnO nanopowders synthesized by the polymerized complex method via an organochemical route.J. Ceram. Process. Res., 3: 146.