R E S E A R C H A R T I C L E
Open Access
CO
2
reduction costs and benefits in
transport: socio-technical scenarios
Heikki Liimatainen, Markus Pöllänen
*and Riku Viri
Abstract
The transport sector produces 23% of greenhouse gas (GHG) emissions globally. While the mitigation of climate change requires GHG emissions to be drastically reduced, the emissions from the transport sector are expected to grow. The purpose of this study is to produce alternative scenarios which meet the target of 80% CO2emission reduction by 2050 for the Finnish transport sector and to analyse the carbon abatement potentials, costs and benefits of the required behavioural and technological measures. We found that the most cost-efficient measure for the society is to support a shift from private car use to shared car use through increasing car-sharing and ride-sharing. Aiming to reach the emission reduction targets solely through technological measures would require a rapid uptake of alternative energies and the society would not receive the possible benefits, including health benefits, energy savings and fixed car cost savings.
Keywords:Transport, GHG emissions, Emission reduction, Costs, Benefits, Scenarios
Introduction
Global CO2 emissions from transport are 9000 billion tons, which is 18% of man-made emissions and these are expected to grow by 60% until 2050 [20]. According to the Intergovernmental Panel on Climate Change [19], emissions from transport may grow faster than on any other sector without aggressive and sustained emission reduction measures. In Finland, transport emitted 12.6 Mt of CO2equivalent, which was 21% of total greenhouse gas (GHG) emissions in 2016 [39]. As an EU member state, Finland is committed to reduce GHG emissions by at least 40% by 2030, while the long-term target is at least 80% decrease by 2050, compared to emissions in 1990 [10,30]. The emission reduction targets for transport are even stricter, with a 50% reduction target from 2005 level by 2030 and“over the long term, transitioning into a trans-port system with extremely low emissions” [33]. Hence, there is an urgent need for identifying, evaluating and pro-moting measures with which emissions from transport can be reduced cost-efficiently.
Figure 1 shows seven components that are directly affecting the emissions from passenger transport. The population, amount of trips per day and average trip
distance set the demand for transport. The mobility habits then affect the modal split and the load factor in different modes of transport. The mobility needs and habits combined create the actual vehicle kilometres. In the end, the technology and its development has an effect on how much energy is used to travel and how much emissions are caused. Each component can be thought of as a lever in a mixing table, which can be adjusted through a variety of policies and measures to achieve emission reduction targets.
All of the components in Fig.1can be affected through different supportive, directive and restrictive policies and they affect the result as a whole. With mitigation policies, the necessary reduction in GHG emissions from the trans-port sector can be achieved. According to IPCC [19], avoiding journeys, modal shift, improvements in vehicle technology, low-carbon fuels, infrastructure investments and densifying urban landscapes effectively combined enable significant emission reductions. A range of strong and mutually supportive policies are needed to support these measures in both the short and long terms. The policies promoting both behavioural change and uptake of improved technology offer together high mitigation potential [37]. The mitigation policies within the transport sector are well known and can be broadly categorised as presented in Table1.
* Correspondence:markus.pollanen@tut.fi
Tampere University of Technology, Transport Research Centre Verne, P.O. BOX 600, FI-33101 Tampere, Finland
Although the behavioural measures to mitigate climate change in transport are acknowledged to have significant potential, the amount of studies quantifying the effects of these measures is low. Anable et al. [3] highlight this gap of knowledge and present future scenarios, which demonstrate the potential contribution of behavioural measures towards an 80% emissions reduction target by 2050 in the UK transport sector. Bueno [6] argues that in order to meet the CO2 reduction targets in the Basque Country, a reduction in mobility in absolute terms as well as very high occupancy rates of vehicles are required in addition to the technological measures. Banister and Hickman [5] urge researchers and policy-makers to‘think the unthinkable’by developing scenarios which look at changes to travel behaviour. Crozet and Lopez-Ruiz [7] take the analysis of behavioural measures further and model the effects of various factors affecting the modal choices of the population in France. Finally, Harvey [17] states that eliminating transport CO2 emis-sions worldwide by the end of the century requires simul-taneous application of all technical and behavioural measures.
There seems to be very few academic research presenting monetary values of the costs and benefits associated with
the behavioural measures aiming at emission reductions. Kok et al. [23] review both academic and non-academic literature and find that the cost-effectiveness of behavioural measures were analysed in only 30% of the studies, of which 4 were academic studies and 6 non-academic studies. Furthermore, if the behavioural measures are concerned, the analyses mostly focus on the effects of financial measures, such as carbon or fuel tax or feebate programs, on the demand of car transport [15,22,32,35]. For instance, the review by Sims et al. [37] presents car-bon abatement costs for various technological measures but provide only qualitative analysis of the behavioural measures. The research by Dedinec et al. [8] is a rare exception as it considers the CO2reduction potential and associated cost savings of driver behaviour and travel behaviour, i.e. using public transport on commuting trips and walking and cycling short distances. These measures were found to be highly cost effective, but Dedinec et al. [8] did not consider the infrastructure investments or increased operational costs of public transport, which are likely to be needed to promote the behavioural change. AlSabbagn et al. [2] studied the CO2abatement costs of public transport investment in the case of introducing light rail and bus rapid transport in Bahrain, considering modal split
trip length # of persons/trip
energy consumption CO2- content of
energy people
# of trips/day trips
pkm km
kWh t CO2
NEEDS
HABITS
TECHNOLOGY
population
Fig. 1The mixing table for CO2emission reductions in passenger transport. The mixing table in Figure 1 presents factors, which affect CO2
emissions of passenger transport. This study discusses changes in mobility needs, habits and technology, which can provide emission reductions
Table 1Mitigation policies and examples of measures in passenger and freight transport (based on [23,27,37])
Mitigation policy Behavioural measures Technological measures
Reducing transport activity Densifying urban structure Restructuring supply chains
Replacing physical transport with ICT Improving the efficiency of vehicle routing
Promoting modal shift Mobility management
Affecting the relative competitiveness of transport modes
Improving public transport, walking and cycling infrastructure
Improving infrastructure for intermodal transport
Improving energy efficiency Increasing passenger occupancy rates Improving vehicle utilisation on laden trips and level of backhaulage
Eco-driving
Reducing vehicle energy consumption
Reducing carbon intensity of energy Using vehicles exploiting alternative energy (electricity, hydrogen, biofuels)
the capital as well as the maintenance costs, and found the costs high compared to the estimated CO2reduction.
The purpose of this study is to produce alternative scenarios, which meet the 80% CO2emission reduction target in 2050 for the Finnish transport sector, and to analyse the carbon abatement potentials, costs and bene-fits of the required behavioural and technological mea-sures. The research question is how the CO2 reduction targets in transport can be met cost-effectively. The ana-lysis encompasses emissions from both passenger and goods transport. The analysis is done from governmental perspective on a national level using Finnish data and by constructing scenarios up to 2050 on the most effective and cost-efficient alternative to reach the 2050 GHG goals. The Finnish ministry of transport and communi-cations has a tradition of using scenarios in developing GHG emission reduction policies [40], and the results of this study have also been used in developing the trans-port sector policy packages of the medium-term climate change plan for 2030 [28]. The emission reduction target is reached in two scenarios: one by adapting exclusively technological measures, and the other by adaption a combination of different measures. As a reference case, a business as usual (BAU) scenario is outlined.
Methods and data
Scenarios can be classified in several ways, and there are several ways to construct scenarios. In our scenario approach, one key element is the vantage point, from which the scenarios are developed. The two types of
scenarios, forecasting and backcasting scenarios, differ from each other in terms of their starting point. Fore-casting scenarios are exploratory and take the current situation as their starting point, whereas backcasting scenarios are normative and anticipatory or prescriptive, and start from a specific future situation [41]. In this study, we start from the current state in the BAU scenario and this scenario is a forecasting scenario by nature. As the 80% emission reduction target sets the premise for the two scenarios, which reach the target, the backcasting scenarios are implemented as we study the possibilities to arrive at the desired target with alternative measures in two scenarios.
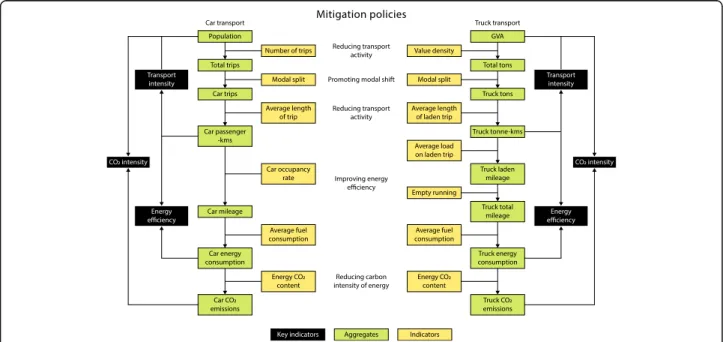
In this study, a widely recognised framework for ana-lysing the relationships between the economy, road freight transport demand, energy consumption and CO2 emissions (see, e.g. [24]) was complemented and applied to analyse also passenger car transport. With the frame-work presented in Fig.2, the effects of mitigation policies on both car and truck transport can be analysed. As the CO2emission from cars and trucks represent 80% of total transport emissions in Finland [43], the research focuses on these modes and other modes of passenger and freight transport are analysed in less detail.
The framework for analysis starts off with the amount of population for passenger transport and with gross value added (GVA) for freight transport. For these, data from Statistics Finland regarding current and forecasted population in years 2011, 2030 and 2050 and the regional accounts in 2012 as well as an economic forecast for 2030
Fig. 2Framework for analysing the effects of CO2mitigation policies on passenger car and freight truck transport. The framework in Figure 2
presents mitigation policies of CO2emissions and their connection to different key indicators, aggregates and indicators of CO2emissions of car
and 2050 from VATT [42] were adopted. The next level in the framework analyses the total number of trips made in passenger transport and by car and the total amount of tons transported by trucks. For these, data from national travel survey data from Finnish Transport Agency and road freight transport from Statistics Finland was applied. The passenger transport data consists of the Finnish National Travel Survey (FNTS) data from 2010 to 2011 in which there are about 46,600 trips covering all modes. The road freight transport data consists of the continuous Goods Transport by Road survey (GTRS) data from 2013 in which there are about 11,500 trips reported with only trucks covered. Other modes of transport are analysed using aggregate data based on the official statistics for each mode.
The next levels of the framework analyse the amount of passenger kilometres and tonne kilometres, car mileage and truck mileage (both laden and total; total including also the unladen kilometres). This analysis utilises the aforementioned FNTS and GTRS data. The last part of the framework focuses on issues related to the energy consumption and CO2 emissions. For these, energy (i.e. mostly fuel) consumption and vehicles’emission data was adopted from VTT [44]. For freight transport, also unit emission data from Network of Transport Measures NTM was used, following the methodology presented by Liimatainen & Pöllänen [25]. Based on the unit emission data from these sources, each trip in the FNTS and GTRS data is given an energy consumption and emission factor, which enable detailed analysis of all indicators in the framework.
Scenario tool
Based on the framework, a model for constructing scenarios on the future CO2 emissions of transport was created. The model was implemented in Microsoft Excel. Due to the available data, the base year of the model is 2011 for passenger transport and 2013 for freight trans-port. The effects of policy measures are analysed from year 2015 onwards. The scenario tool integrates different data inputs, development prospects and different mea-sures, which affect the issues depicted in Fig. 2, e.g. in passenger transport the developments related to popu-lation and urban structure, and the transport demand. For passenger car fleet, future prospects of great interest include the amount of new registered vehicles, medium lifetime for a car, distribution of motive powers, energy use and emissions. For car use, inputs for the scenarios include, e.g. changes in average load (persons per car trip) and for energy issues, e.g. the share of biofuels in petrol and diesel fuels. For other modes of transport, the development of energy efficiency and CO2content of the energy (kg/kWh) are included in the model. As outputs, the scenario tool produces annual data, e.g. on trips,
transport and traffic volumes in different modes, the car fleet, energy consumption and CO2emissions up to year 2050.
In order to make the model able to consider the current situation and future development prospects in adequate resolution, the modal shares and average trip lengths are considered within four different regional cat-egories in Finland as well as in inter-regional transport. The four different regions are (1) Helsinki metropolitan region, (2) large city regions with population of more than 100,000, (3) medium-sized city regions with popula-tion of 40,000–100,000 and (4) other regions. In addition, international transport and its future development can be considered in the model, but is not included in the cost-efficiency assessment.
For road freight transport with trucks, the scenario tool includes the variables related to GVA (€) and value density (€/t) for different industries, average trip length (km), load (t), energy use (kWh/km) and the CO2content of the energy (kg/kWh). Additionally, the share of unladen trips of the transport volume is one variable in the model. As the variables for road freight transport with vans, the scenario tool includes energy use and the CO2content of the energy whereas for waterborne freight transport only the CO2content of the energy is included.
To be able to analyse the effects and costs of different measures aiming at CO2emission reductions, a literature study was carried out. In the cases where there was no information available based on previous research, the researchers deployed own estimates. The costs and benefits are assessed holistically, without making detailed distinction between households’, companies’, and the public sector’s cost effects, but some discussion on the distribu-tion of costs and benefits are presented in the“Discussion and conclusions”section. The costs and benefits are con-sidered within the transport sector, thus the possible bene-fits related to, e.g. biofuels and their production, such as domestic employment and business opportunities for com-panies, are not considered. In the scenario tool, we assume invariable energy prices and thus the prices of alternative energies remain unchanged as we choose not to be hypo-thetical on these or other technological breakthroughs.
Main assumptions in the scenarios
All scenarios share the same assumption on regional population in 2030 and 2050.
The number of trips per person and average trip length for each mode are assumed to remain at the 2011 level in 2030 and 2050 in all scenarios.
The modal split is assumed to remain at the 2011 level in the reference and technology scenarios, but this is one of the key changes in the
recommendation scenario (Fig.3).
The average vehicle occupancy for passenger cars is assumed to remain at the 2011 level (1.84 persons) in the reference and technology scenarios. This is one of the key changes in the recommendation scenario with a 5% increase in 2030 and 30% increase in 2050 due to ride-sharing.
The average energy consumption of new passenger cars is assumed in all scenarios to be reduced from the 2013 level of 0.54 kWh/km (CO2emissions
about 132 g/km) to 0.36 kWh/km (CO2emissions
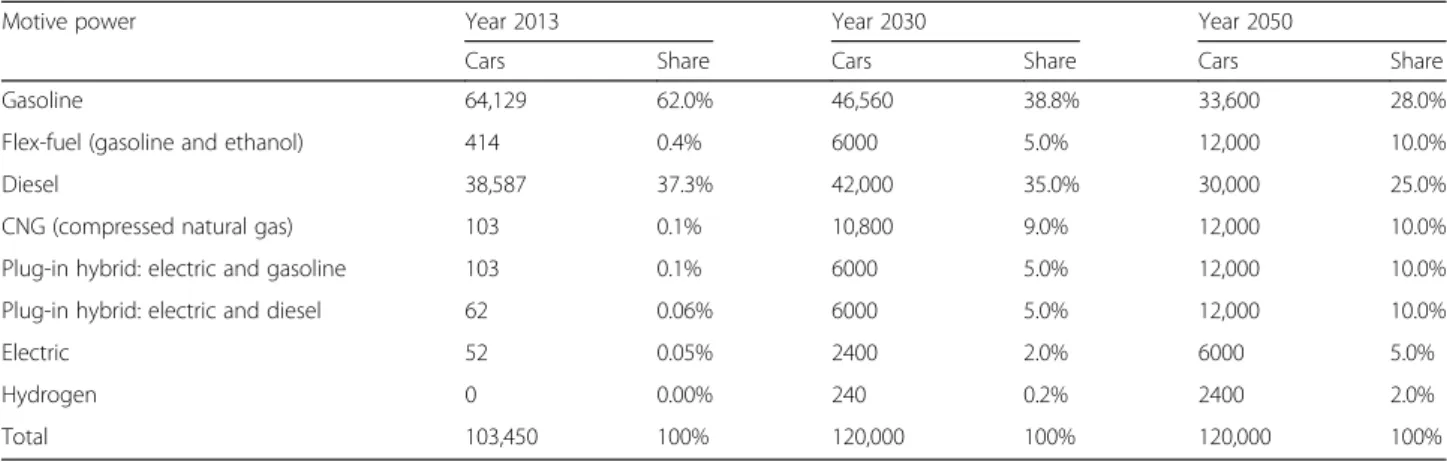
95 g/km) by 2021 in accordance to the EU norms. After 2021, the energy consumption is assumed to remain stable in the reference scenario, but decrease considerably due to technological improvements and changes in the amount of cars of different motive powers in the technology and recommendation scenarios. The number of new cars with different motive powers in the reference scenario were estimated based on references [1,21,29,31] and are presented in Table2.
The CO2content of the energy is assumed to
decrease to 193 g/kWh for gasoline and 231 g/kWh for diesel by 2020 in accordance with the Finnish regulation, which mandates a 20% share of transport energy to be coming from biofuels. This level
remains after 2020 in the reference scenario, but in technology scenario and recommendation scenario, the level decreases further. Biofuels, electricity and hydrogen are assumed to have zero CO2content
within the transport sector, but some calculations on the well-to-tank (WTT) emissions are presented based on the assumed WTT emissions of 80 g/kWh for biogas, 50 g/kWh for ethanol, 100 g/kWh for renewable diesel, 160 g/kWh for electricity and 400 g/kWh for hydrogen ([9,34,36]).
Regarding the other transport modes, it is assumed in the reference scenario that the energy efficiency (pkm/kWh) will increase 10% by 2030 and 20% by 2050. Rail transport is assumed to have zero CO2
content of energy. In aviation, the CO2content of
energy is assumed to be 0.25 kg/kWh in 2030 and 0.24 kg/kWh in 2050, and for waterway transport 0.26 kg/kWh in 2030 and 0.25 kg/kWh in 2050.
Two scenarios were made for freight transport, the reference (BAU) scenario and the recommendation sce-nario. In the two scenarios, the GVA, value density and average length of haul are assumed to be the same. Hence, the total haulage is the same in both scenarios and in line with the national traffic forecast [13]. In the reference scenario, the share of empty running, average load on laden trips and average fuel consumption are assumed to develop until 2030 as forecasted in a previous study [24] and then level off, with some slight changes due to relative importance of different types of commodities transported. In the recommendation scenario, these indi-cator values are assumed to further improve after 2030. The CO2content of energy is assumed to be the same as in passenger transport.
Assumptions on costs and benefits
Atkins and University of Aberdeen [4] and Schade et al. [36] have carried out emission reduction cost analysis in Scotland and in the EU, respectively. These findings were used to benchmark the calculations made in this study, but also several other references were used to justify the following main assumptions on costs and benefits of the measure packages deployed in the scenarios:
In the urban form, walking, cycling and public transport package, the costs are estimated to be 510 M€annually. This cost is in addition to the current infrastructure and public transport operation costs of the national and regional governments. The amount is about 50% of the current annual public transport funding by the national and regional governments in Finland [14] and would allow increasing the service level of public transport, infrastructure projects and mobility management activities. This package induces also significant health benefits due to direct health benefits of increased walking and cycling, estimated at 0.27€/pkm for walking and 0.11€/pkm for cycling. These values are based on Litman [26] and give a rather moderate value of health benefits compared to some estimations using the Health Economic Assessment Tool, see, e.g. Fishman et al. [12]. Health benefits of reduced car transport are estimated at 0.002€/pkm. The calculation is based on the emission costs of cars estimated by Gynther et al. [16] and passenger kilometres travelled by cars as reported by FTA [14].
In the car-sharing and ride-sharing measure package, the costs are estimated at 1000€per shared car. This estimate is higher than the investment currently needed to enable car-sharing, but it is set at a high level to allow some of the shared vehicles to be automated vehicles towards the end of the estimation
period as according to EY [11] the estimated price for AV technology is about $3000 after 2035. The benefits of car sharing are due to decreased car ownership and hence decrease in the fixed costs of cars, which are assumed at 1000€/car/year and estimated based on Statistics Finland [38].
In the measure packages related to the changes in the car fleet, the additional costs are estimated based on Nylund et al. [34] and AEA [1]. Additional costs are estimated at 16,500€for plug-in hybrid and battery electric and 35,000€for hydrogen cars in 2015, 10,000 €and 15,000€respectively in 2030 and 2500€and 4000€respectively in 2050. Also conventional cars are estimated to have an additional cost which reaches 4300€by 2030 due to light-weight materials and hybrid engines. For trucks, the additional cost of improved fuel efficiency is estimated to be 15,000€in 2030 and 30,000€in 2050 and for vans 5000€in 2030 and 10,000€in 2050.
The energy costs (price without tax) used in all scenarios are 0.5€/l for fossil gasoline and diesel, 0.8€/l for renewable diesel and ethanol, 1€/kg for biogas, 5€/kg for hydrogen and 0.1€/kWh for electricity. There are also infrastructure costs for electricity (private charging station for each electric or plug-in hybrid car at 2000€per station and one public charging station for every 10 cars at 5000€ per public charging station), hydrogen (1 M€per station and one station for every 100 cars) and biogas (0.5 M€per station and one station for every 250 cars). These assumptions are made based on Nylund et al. [34] and Schade et al. [36].
Additionally, it is estimated that liquefied biogas (LBG) for maritime transport needs one fuelling terminal every 6 years at 70 M€per terminal and one smaller bunkering facility every 3 years at 25 M€. These prices and capacities are estimate based on MINTC [29].
Table 2New car sales by motive power in the reference scenario
Motive power Year 2013 Year 2030 Year 2050
Cars Share Cars Share Cars Share
Gasoline 64,129 62.0% 46,560 38.8% 33,600 28.0%
Flex-fuel (gasoline and ethanol) 414 0.4% 6000 5.0% 12,000 10.0%
Diesel 38,587 37.3% 42,000 35.0% 30,000 25.0%
CNG (compressed natural gas) 103 0.1% 10,800 9.0% 12,000 10.0%
Plug-in hybrid: electric and gasoline 103 0.1% 6000 5.0% 12,000 10.0%
Plug-in hybrid: electric and diesel 62 0.06% 6000 5.0% 12,000 10.0%
Electric 52 0.05% 2400 2.0% 6000 5.0%
Hydrogen 0 0.00% 240 0.2% 2400 2.0%
Results of the scenarios for 2030 and 2050
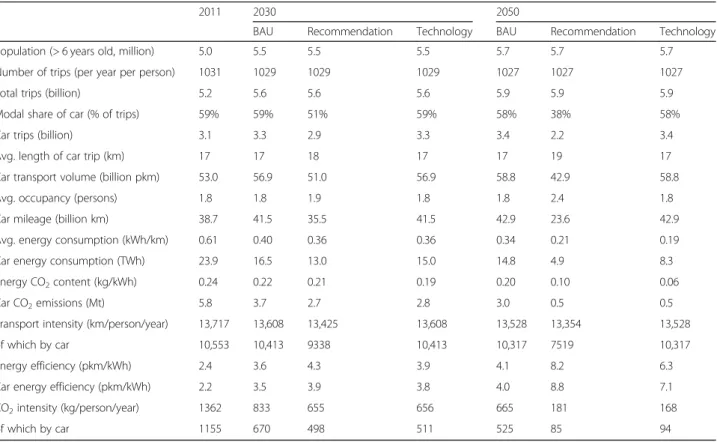
Table3presents the detailed results related to passenger car transport in the three scenarios in 2011, 2030 and 2050. As it can be seen, the recommendation scenario emphasises the large-scale modal shift from cars to other transport modes and a significant increase in car occu-pancy, resulting in a 45% decrease in car mileage in 2050 compared to the other two scenarios. Even with such decrease in mileage, significant reductions in the average energy consumption of cars and CO2content of energy are required to meet the CO2reduction target. In the technology scenario, on the other hand, reductions in the average energy consumption and CO2 content of energy have to be even larger to meet the target.
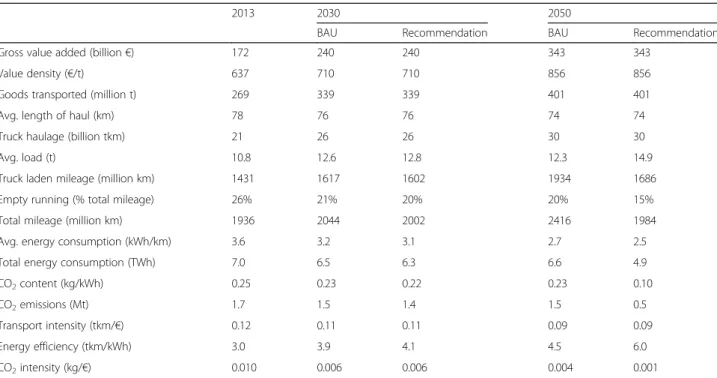
Table4presents the detailed results of truck transport in the two scenarios in 2013, 2030 and 2050. It can be seen that the emission reductions in the recommendation scenario rely heavily on the reduction of energy CO2 content through the use of biodiesel, as the difference between the two scenarios is just 26% in terms of energy consumption, but 67% in terms of CO2emissions.
Reference scenario
The reference scenario results in a 27% decrease in CO2 emissions in the period 2011–2030 and a 36% reduction in 2011–2050. The emission decrease is mainly reached
through reduction in passenger cars’ average energy consumption and increased utilisation of biofuels. It is notable that the emission reduction target of 80% is very far from the results in the BAU scenario, and in fact, the emissions from freight transport alone exceed the amount of targeted CO2 emissions of transport in 2050. The emissions decrease even though the passenger and freight transport volumes increase by 12% and 41%, respectively. However, the reference scenario assumes a very low increase in passenger transport volume, due to people moving to larger cities and adopting the modal split and average trip length of the current residents of those regions.
A sensitivity analysis was carried out to estimate emis-sions with a higher increase of 36% in passenger-kilometres in accordance with FTA [13]. This would result in a CO2 reduction of 22% by 2030 and 30% by 2050. Furthermore, the emission reduction in the reference scenario relies heavily on the decrease in average energy consumption of cars, which are uncertain, especially given the mismatch between actual CO2 emissions and test data [18]. If the average energy consumption would actually be 20% higher than the nominal test consumption (e.g. CO2emissions of 114 g/km instead of 95 g/km in 2021), the emission reduc-tions would be less than 20% in 2030. Even without the sensitivities, the emission reductions would not be enough
Table 3Values of framework indicators for passenger cars in three scenarios in 2011, 2030 and 2050
2011 2030 2050
BAU Recommendation Technology BAU Recommendation Technology
Population (> 6 years old, million) 5.0 5.5 5.5 5.5 5.7 5.7 5.7
Number of trips (per year per person) 1031 1029 1029 1029 1027 1027 1027
Total trips (billion) 5.2 5.6 5.6 5.6 5.9 5.9 5.9
Modal share of car (% of trips) 59% 59% 51% 59% 58% 38% 58%
Car trips (billion) 3.1 3.3 2.9 3.3 3.4 2.2 3.4
Avg. length of car trip (km) 17 17 18 17 17 19 17
Car transport volume (billion pkm) 53.0 56.9 51.0 56.9 58.8 42.9 58.8
Avg. occupancy (persons) 1.8 1.8 1.9 1.8 1.8 2.4 1.8
Car mileage (billion km) 38.7 41.5 35.5 41.5 42.9 23.6 42.9
Avg. energy consumption (kWh/km) 0.61 0.40 0.36 0.36 0.34 0.21 0.19
Car energy consumption (TWh) 23.9 16.5 13.0 15.0 14.8 4.9 8.3
Energy CO2content (kg/kWh) 0.24 0.22 0.21 0.19 0.20 0.10 0.06
Car CO2emissions (Mt) 5.8 3.7 2.7 2.8 3.0 0.5 0.5
Transport intensity (km/person/year) 13,717 13,608 13,425 13,608 13,528 13,354 13,528
of which by car 10,553 10,413 9338 10,413 10,317 7519 10,317
Energy efficiency (pkm/kWh) 2.4 3.6 4.3 3.9 4.1 8.2 6.3
Car energy efficiency (pkm/kWh) 2.2 3.5 3.9 3.8 4.0 8.8 7.1
CO2intensity (kg/person/year) 1362 833 655 656 665 181 168
to meet the emission target set for 2030, let alone the target for 2050. Hence, there is a clear need for policy measures to meet the targets.
Technology scenario
This scenario studied the possibilities to reach the 80% reduction in CO2 emissions by 2050 solely through technological development and the adaption of advanced technologies. To reach the reduction target, the vehicle fleet should be drastically altered of what it is today and the share of biofuels highly increased. In 2050, 60% of the cars sold should be plug-in hybrids, 30% electric cars and 10% hydrogen powered. Furthermore, 75% of the fuel used should be renewably produced diesel and ethanol or synthetic gasoline. These shares of vehicles and renewable fuels are one example of a multitude of alternative combina-tions that could result in the necessary emission reduction. This combination was chosen based on people’s current preference of plug-in hybrids over electric cars, which neces-sitates the high level of renewable fuels. The cost optimum combination of the types of cars and level of renewable fuels changes depending on the advancement of technology, especially battery technology and further research should be carried out to determine the optimum combination. The combined costs for the emission reduction in this scenario would be 19,000 million euros until 2050, while monetary benefits through lower energy consumption would total 3700 million euros until 2050, which would result in unit costs of 225 euros per ton of CO2emissions reduced.
Recommendation scenario
This scenario included also behavioural adaptation and changes in mobility practices to reach the emission reduc-tion target of 80% in 2050. In the scenario, well-balanced and cost-efficient mix of measures to reach the target was deployed. The measures include affecting the transport needs, practices, technologies, and economic rationale. In this scenario, the mobility of people is not restricted, but through urban planning the passenger transport need somewhat diminishes. Urban planning also supports people walking, cycling and using public transport to a greater extent. As a result of this development, which should be supported by a vast set of policy measures, car mileage is 27% lower compared to the reference scenario in 2050. Because of this, the required car fleet is 550,000 cars smaller than in the reference scenario in 2050. Further reduction in car mileage and required car fleet can also be acquired through increasing the car occu-pancy, which is supported by car-sharing and ride-sharing, which in turn may be enabled by automated vehicles. Shared car use also increases the use of individual cars, resulting to lower average age of cars and again to newer technologies implemented faster into the car fleet. This scenario includes also technological measures, but these are not as large scale as in the technology scenario. Purely economic measures have rather limited emission reduction potentials as such, but they can be seen as supportive measures, which should be combined with other measures.
Table 4Values of framework indicators for truck transport in BAU and recommendation scenarios in 2013, 2030 and 2050
2013 2030 2050
BAU Recommendation BAU Recommendation
Gross value added (billion€) 172 240 240 343 343
Value density (€/t) 637 710 710 856 856
Goods transported (million t) 269 339 339 401 401
Avg. length of haul (km) 78 76 76 74 74
Truck haulage (billion tkm) 21 26 26 30 30
Avg. load (t) 10.8 12.6 12.8 12.3 14.9
Truck laden mileage (million km) 1431 1617 1602 1934 1686
Empty running (% total mileage) 26% 21% 20% 20% 15%
Total mileage (million km) 1936 2044 2002 2416 1984
Avg. energy consumption (kWh/km) 3.6 3.2 3.1 2.7 2.5
Total energy consumption (TWh) 7.0 6.5 6.3 6.6 4.9
CO2content (kg/kWh) 0.25 0.23 0.22 0.23 0.10
CO2emissions (Mt) 1.7 1.5 1.4 1.5 0.5
Transport intensity (tkm/€) 0.12 0.11 0.11 0.09 0.09
Energy efficiency (tkm/kWh) 3.0 3.9 4.1 4.5 6.0
In this scenario, the shares of total CO2 emissions from different transport modes and in passenger and freight transport change significantly. Cars are currently responsible for 58% of the CO2 emissions, but only for 23% in 2050 in this scenario. The share of bus transport increases from 2 to 9% as the use public transport increases. As the share of aviation increases, aviation’s emissions decrease only slightly. The share of emissions from freight transport increases from 31 to 50%. As depicted in Table 5, the combined emission reduction costs in this scenario are 21,200 million euros until 2050, while monetary benefits total 24,700 million euros until 2050 and unit costs for emission reduction would thus be −52 euros per ton of CO2emissions reduced, indicating greater benefits (and cost savings) than costs. These results are elaborated in more detail in the next section.
Discussion and conclusions
For the society, the most cost-efficient measure for CO2 emission reductions from transport is to support a shift from private car use to shared car use through increasing car-sharing and ride-sharing. Ride-sharing increases the energy efficiency of car use with barely any additional costs and car-sharing decreases the size of the car fleet
thus reducing the purchase costs and fixed costs of cars. Both direct costs and benefits of this measure package apply to households, while companies offering shared mobility services will benefit and car shops may encounter adverse effects due to decreasing car sales and mainten-ance volumes. Enabling such transformation towards mobility services requires both technological innovations and changes to legislation and market regulation. How-ever, the behavioural change is vital to fulfil this scenario and may require very unpopular policy decisions, such as limiting parking spaces of private cars.
Measures affecting the development of urban form are also very cost efficient as costs are mostly only caused by disseminating best practices. Developing walking and cycling infrastructure affecting the modal split may also be very cost efficient because of the achievable health benefits. Rail infrastructure projects dominate the devel-opment of public transport and while they are expensive, they also improve transport safety. Urban planning is closely related to infrastructure projects and the changes take time, thus political guidance must be proactive and persevering. Political perseverance is needed as the infra-structure investment costs affect national and regional budgets in the short term, but health and safety benefits
Table 5Costs and benefits from the different measure packages in the recommendation scenario
Measure package Total costs; specifications Total monetary benefits; specifications CO2emission reductions
and unit costs
Urban form, walking, cycling and public transport
11,100 M€; 510 M€annually to infrastructure projects, mobility management, increasing service level of public transport and uptake of buses using alternative energy
14,300 M€; 3900 M€health benefits + 4000 M€reduction in new vehicle purchase costs + 3900 M€reduction in fixed costs of cars, approx. 1000€/car/year + 2500 M€energy savings
18.6 Mt,−172€/t
Car-sharing and ride-sharing
1000 M€; Systems required for car-sharing and ride-sharing, later automated cars, approx. 1000€/car/year
9300 M€; 4000 M€reduction in new vehicle purchase costs + 3900 M€ reduction in fixed costs of cars, approx. 1000€/car/year + 1400 M€energy savings
8.7 Mt,−954€/t
Cars with reduced energy consumption
3500 M€; Increased purchase costs of energy efficient cars, cost increase from 0€to 5000€during 2022–2050
1100 M€; Energy savings 7.1 Mt, 338€/t
Cars exploiting alternative energy
800 M€; 600 M€increased purchase costs of plug-in hybrid, battery electric and hydrogen cars + 200 M€investments in energy infrastructure
– 4.5 Mt, 178€/t
emissions increase in the energy sector because of biogas, electricity and hydrogen production 3.6 Mt (BAU: 4.6 Mt)
Alternative fuels 400 M€; Higher price of alternative fuels – 7.1 Mt, 56€/t
emissions increase in the energy sector because of ethanol and renewable diesel production 5.9 Mt (BAU: 5.7 Mt)
Energy efficiency in road freight vehicles
2500 M€; Energy efficient trucks and vans 1000 M€; Energy savings 9.3 Mt, 161€/t
Alternative energy in freight transport
1900 M€; 600 M€higher price of renewable diesel + 1300 M€LBG and infrastructure for marine freight transport
– 12.2 Mt, 156€/t
emissions increase in the energy sector because of renewable diesel production 9.0 Mt (BAU: 4.2 Mt)
accumulate slowly and are seen indirectly as avoided health care costs.
Technological measures induce costs to society because reducing the energy consumption of cars and the uptake of alternative fuels and vehicles both require high invest-ments by car and fuel industries in research and develop-ment of new technology. Households then carry the costs in increased fuel and car prices, although government may decide to subsidise new technologies in order to speed up the uptake. However, great emission reductions may be achieved through technology and the emission reduction target can be achieved through solely techno-logical measures. This would require a rapid uptake of alternative energy vehicles, but the society would not receive the great benefits, such as health benefits, energy savings and fixed car cost savings, associated with mea-sures affecting urban form, modal split and social car use. In addition, the technological measures shift emissions from the transport sector to the energy sector. Hence, the emissions caused by transport in the energy sector may almost double due to the vehicles using alternative energy sources.
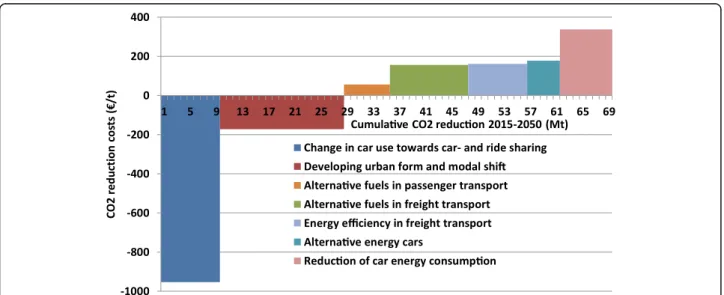
Figure 4 presents the cost efficiency of different CO2 reduction measures in the recommendation scenario. The height of the column indicates the costs of the measure as euros per tonne. Negative values denote that the measure will generate net benefits as there are larger monetary benefits than costs. The width of the column indicates the maximum cumulative CO2 reduction as megatons available from that measure during 2011– 2050. Both changing car use towards sharing services
and promoting modal shift through urban planning are measures that also have monetary benefits due to health benefits and savings from car purchases and fixed costs. The use of alternative energy sources and alternative fuels in transport can also reduce the CO2 emissions, but these measures are more costly because of purchase costs of new cars, higher prices of alternative fuels and investments in infrastructure of electricity and alterna-tive fuels.
The aim of this study was to explore the cost effective-ness of achieving the 80% emission decrease target by 2050. However, the target may be greater than this in the transport sector because emission reductions may be even more difficult to achieve in other sectors, e.g. in the agriculture sector. Hence, there is a need to explore the measures, costs and benefits of even greater emis-sion reduction in the transport sector. Furthermore, there is a need to constantly update the analysis, because transport emissions seem to remain at a high level in Finland and the policy packages analysed in this study may not be enough anymore to meet the emission reductions. The resources of this study did not enable assessing the effects of individual measures, but the methodology developed in this study enables such analyses in the future. More detailed analysis should also include sensitivity analyses related to the large number of assumptions that were made in this study, for example on the health benefits, required level of cycling and public transport infrastructure investments, costs of new vehicle technologies, energy costs and the timing of measures.
Fig. 4Cost efficiency and CO2emission reduction of different emission reduction measures in the recommendation scenario. The cost efficiency
of seven CO2emission reduction measures in terms of costs (€) per tonnes of reduced CO2is presented in they-axis. Negative values denote that
the measure will generate net benefits as there are larger monetary benefits than costs. The cumulative CO2reduction with each measure is
Acknowledgements
The authors would like to thank the team of researchers who were involved in the larger project this paper draws results from. Thanks Lasse Nykänen, Tuuli Rantala, Antti Rehunen, Mika Ristimäki, Anna Strandell, Jyri Seppälä, Matti Kytö, Samuli Puroila and Markku Ollikainen!
Funding
The larger research project from which this paper draws results from was financed by the Finnish Ministry of the Environment through the Finnish Climate Panel. Writing the article was supported by the Kone Foundation (grant number b4b919).
Availability of data and materials
The datasets used and/or analysed during the current study are available from the corresponding author on reasonable request.
Authors’contributions
All authors jointly shaped the manuscript and participated in the literature review and the analysis of the results. HL managed the data and the scenario model, while MP assessed the quality of the results and finalised the manuscript, and RV visualised the results and fine-tuned the figures. All authors contributed to manuscript revision based on the reviewing comments and have read and approved the final manuscript.
Competing interests
The authors declare that they have no competing interests.
Publisher’s Note
Springer Nature remains neutral with regard to jurisdictional claims in published maps and institutional affiliations.
Received: 10 August 2018 Accepted: 29 November 2018
References
1. AEA (2012) A review of the efficiency and cost assumptions for road transport vehicles to 2050. Report for the committee on climate change. AEA/R/ED57444
2. AlSabbagn M, Siu YL, Guehnemann A, Barrett J (2017) Mitigation of CO2
emissions from the road passenger transport sector in Bahrain. Mitig Adapt Strateg Glob Chang 22(1):99–119
3. Anable J, Brand C, Tran M, Eyre N (2012) Modelling transport energy demand: a socio-technical approach. Energy Policy 41:125–138 4. Atkins and University of Aberdeen (2009) Mitigating Transport’s Climate
Change Impact in Scotland: Assessment of Policy Options. Scottish Government Social Research.http://www.gov.scot/resource/doc/282791/ 0085548.pdf. Accessed 30 July 2018
5. Banister D, Hickman R (2013) Transport futures: thinking the unthinkable. Transp Policy 29:283–293
6. Bueno G (2012) Analysis of scenarios for the reduction of energy consumption and GHG emissions in transport in the Basque Country. Renew Sust Energ Rev 16:1988–1998
7. Crozet Y, Lopez-Ruiz H (2013) Macromotives and microbehaviors: climate change constraints and passenger mobility scenarios for France. Transp Policy 29:294–302
8. Dedinec A, Markovska N, Taseska V, Duic N, Kanevce G (2013) Assessment of climate change mitigation potential of the Macedonian transport sector. Energy 57:177–187
9. Directive 2009/30/EC of the European Parliament and of the Council of 23 April 2009 amending Directive 98/70/EC as regards the specification of petrol, diesel and gas-oil and introducing a mechanism to monitor and reduce greenhouse gas emissions and amending Council Directive 1999/ 32/EC as regards the specification of fuel used by inland waterway vessels and repealing Directive 93/12/EEC. Official Journal of the European Union 5. 6.2009.https://eur-lex.europa.eu/legal-content/EN/TXT/PDF/?uri=CELEX: 32009L0030&from=EN. Accessed 29 June 2018
10. European Commission (2015) 2030 Energy Strategy.http://ec.europa.eu/ energy/en/topics/energy-strategy/2030-energy-strategy. Accessed 7 Aug 2015 11. EY (2014) Deploying autonomous vehicles. Commercial consideration and
urban mobility scenarios.
https://www.ey.com/Publication/vwLUAssets/EY- Deploying-autonomous-vehicles-30May14/%24File/EY-Deploying-autonomous-vehicles-30May14.pdf. Accessed 5 Apr 2018
12. Fishman E, Schepers P, Kamphuis C (2015) Dutch cycling: quantifying the health and related economic benefits. Am J Public Health 105(8):e13 13. FTA (2014) Valtakunnallinen tieliikenne-ennuste 2030 (Nationwide road
traffic forecast 2030, in Finnish). Liikenneviraston tutkimuksia ja selvityksiä 13/2014 (Research reports of the Finnish Transport Agency 13/2014). Finnish Transport Agency
14. FTA (2017) Public Transport Performance Statistics 2015. Statistics of the Finnish Transport Agency 6/2017. Finnish Transport Agency.https://julkaisut. liikennevirasto.fi/pdf8/lti_2017-07_public_transport_web.pdf. Accessed 29 June 2018
15. Gambhir A, Tse L, Tong D, Martinez-Botas R (2015) Reducing China’s road transport sector CO2emissions to 2050: technologies, costs and
decomposition analysis. Appl Energy 157:905–917
16. Gynther L, Tervonen J, Hippinen I, Loven K, Salmi J, Soares J, Torkkeli S, Tikka T (2012) Liikenteen päästökustannukset (Environmental costs of transport, in Finnish). Liikenneviraston tutkimuksia ja selvityksiä 23/2012 (Research reports of the Finnish Transport Agency 23/2012). Finnish Transport Agency.http://www2.liikennevirasto. fi/julkaisut/pdf3/lts_2012-23_liikenteen_paastokustannukset_web.pdf. Accessed 29 June 2018
17. Harvey L (2013) Global climate-oriented transport scenarios. Energy Policy 54:87–103
18. ICCT (2013) From laboratory to road. A comparison of official and‘real-world’ fuel consumption and CO2values for cars in Europe and the United States.
International Council on Clean Transportation. White Paper. May 2013.http:// www.theicct.org/sites/default/files/publications/ICCT_LabToRoad_20130527. pdf. Accessed 23 July 2018
19. IPCC (2014) Climate Change 2014: Synthesis Report. Contribution of working groups I, II and III to the Fifth Assessment Report of the Intergovernmental Panel on Climate Change. IPCC, Geneva
20. ITF (2017) ITF transport outlook 2017. OECD Publishing, Paris.https://doi. org/10.1787/9789282108000-en. Accessed 23 July 2018
21. Kay D, Hill N, Newman D (2013) Powering ahead. The future of low-carbon cars and fuels. UK Petroleum Industry Association, RAC Foundation.http:// www.racfoundation.org/assets/rac_foundation/content/downloadables/ powering_ahead-kay_et_al-apr2013.pdf. Accessed 23 July 2018 22. Kesicki F (2012) Intertemporal issues and marginal abatement costs in the
UK transport sector. Transp Res D 17:418–426
23. Kok R, Annema J, van Wee B (2011) Cost-effectiveness of greenhouse gas mitigation in transport: a review of methodological approaches and their impact. Energy Policy 39:7776–7793
24. Liimatainen H, Kallionpää E, Pöllänen M, Stenholm P, Tapio P, McKinnon A (2014) Decarbonizing road freight in the future–detailed scenarios of the carbon emissions if Finnish road freight transport in 2030 using a Delphi method approach. Technol Forecast Soc Chang 81:177–191
25. Liimatainen H, Pöllänen M (2010) Trends of energy efficiency in Finnish road freight transport 1995–2009 and forecast to 2016. Energy Policy 38:7676–7686 26. Litman T (2018) Economic value of walkability. 24 July 2018. Victoria
Transport Policy Institute.http://www.vtpi.org/walkability.pdf. Accessed 30 July 2018
27. McKinnon A (2012) Reducing energy consumption and emissions in the logistics sector. In: Inderwildi O, King S (eds) Energy, transport, & the environment. Springer, London
28. MINENV (2017) Government report on medium-term climate change plan for 2030–towards climate-smart day-to-day living. Reports of the Ministry of the Environment 21en/2017. Ministry of the Environment, Finland 29. MINTC (2013) Tulevaisuuden käyttövoimat liikenteessä. Työryhmän
loppuraportti. Liikenne- ja viestintäministeriön julkaisuja 15/2013. Shortened English edition: Future transport power sources. Executive summary. Publications of the Ministry of Transport and communications 24/2013. Ministry of Transport and Communications, Finland
30. MINTC (2014) Liikenne- ja viestintäministeriön hallinnonalan ilmastopoliittinen ohjelma 2009–2020. Seuranta 2014 (Climate Policy Programme for the Ministry of Transport and Communications’
administrative branch 2009–2020–Follow-up 2014, in Finnish). Liikenne- ja viestintäministeriön julkaisuja 33/2014. Ministry of Transport and Communications, Finland
Finnish). Liikenne- ja viestintäministeriön julkaisuja 4/2015. Ministry of Transport and Communications, Finland
32. Moghadam A (2011) Abatement cost functions for incentive-based policies in the automobile market. Transp Res D 16:579–585
33. NECS (2017) Government report on the National Energy and climate strategy for 2030. Ministry of Economic Affairs and Employment, Finland 34. Nylund N-O, Sipilä K, Laurikko J, Tamminen S, Sipilä E, Mäkelä K, Hannula I,
Honkatukia J (2015) How to reach 40% reduction in carbon dioxide emissions from road transport by 2030: propulsion options and their impacts on the economy. VTT research report VTT-R-00752-15.http://www. transsmart.fi/files/248/Tutkimusraportti_VTT-R-00752-15_liitteineen.pdf. Accessed 30 July 2018
35. Parry I (2007) Are the costs of reducing greenhouse gases from passenger vehicles negative. J Urban Econ 62:273–293
36. Schade W, Akkermans L, Fiorello D, Jopson A, Köhler J, Krail M, Moizo A, Schade B, Shepherd S, Sievers L, Tercero L, van Herle K, Weiss C, Wiesenthal T (2011) Bottom-up quantifications of selected measures to reduce GHG emissions of transport for the time horizons 2020 and 2050: Cost assessment of GHG mitigation measures of transport. Deliverable D3.1 of GHG-TransPoRD project
37. Sims R, Schaeffer R, Creutzig F, Cruz-Núñez X, D’Agosto M, Dimitriu D, Figueroa Meza MJ, Fulton L, Kobayashi S, Lah O, McKinnon A, Newman P, Ouyang M, Schauer JJ, Sperling D, Tiwari G (2014) Transport. In: Edenhofer O, Pichs-Madruga R, Sokona Y, Farahani E, Kadner S, Seyboth K, Adler A, Baum I, Brunner S, Eickemeier P, Kriemann B, Savolainen J, Schlömer S, von Stechow C, Zwickel T, Minx JC (eds) Climate Change 2014: Mitigation of Climate Change. Contribution of Working Group III to the Fifth Assessment Report of the Intergovernmental Panel on Climate Change. Cambridge University Press, Cambridge and New York
38. Statistics Finland (2012) Household Budget Survey 2012.http://stat.fi/til/ ktutk/index_en.html. Accessed 24 July 2018
39. Statistics Finland (2018) Greenhouse gases.http://stat.fi/til/khki/index_en. html. Accessed 23 July 2018
40. Tuominen A, Järvi T, Wahlgren I, Mäkelä K, Tapio P, Varho V (2012) Transport sector policy packages for climate change mitigation in Finland up to year 2050. Baseline-scenario, Urban beat or Conucopia? Publications of the Ministry of Transport and Communications 15/2012. Ministry of Transport and Communications, Finland
41. van Notten P, Rotmans J, van Asselt M, Rothman D (2003) An updated scenario typology. Futures 35:423–443
42. VATT (2014) Kansantalouden kehitys vähähiiliskenaarioissa. Low Carbon Finland 2050–platform -hankkeen loppuraportti. Valtion taloudellinen tutkimuskeskus. VATT Tutkimukset 178/2014.http://vatt.fi/file/vatt_ publication_pdf/t178.pdf. Accessed 23 July 2018
43. VTT (2018a) LIPASTO–Transport emission inventory.http://lipasto.vtt.fi/en/ inventaarioe.htm. Accessed 23 July 2018
![Table 1 Mitigation policies and examples of measures in passenger and freight transport (based on [ 23 , 27 , 37 ])](https://thumb-us.123doks.com/thumbv2/123dok_us/7905210.2104649/2.892.84.806.896.1097/table-mitigation-policies-examples-measures-passenger-freight-transport.webp)