1
Report on Support to SMEs in Developing
Countries Through Financial Intermediaries
November 2011
C O P E N H A G E N
D A K A R
G E N E V A
J O H A N N E S B U R G
M U M B A I
N A I R O B I
N E W YO R K
S A N F R A N C I S C O
S A N T I A G O
2
TABLE OF CONTENTS
FOREWORD 3
EXECUTIVE SUMMARY 4
METHDOLOGY 5
INTRODUCTION TO SMES 6
THE SME SECTOR IN THE GLOBAL ECONOMY 7
THE IMPACT OF ACCESS TO FINANCE ON SMES 9
IMPLICATIONS OF SME GROWTH FOR DOMESTIC ECONOMIC DEVELOPMENT 13
BARRIERS TO FINANCE FOR SMES 17
THE ROLE FOR IFIS IN SME FINANCING 25
RECOMMENDATIONS AND ADDITIONAL RESEARCH 30
ANNEX I – COMPARISON OF INVESTMENT STANDARDS ACROSS IFIS 32
ANNEX II – STEERING GROUP 37
3
FOREWORD
The development community has long upheld that a thriving private sector is essential for economic development. SMEs play an instrumental, but often under-recognized, role in private sector growth. This report reviews a large body of research, and demonstrates how SMEs in developing countries are often hampered by an inability to obtain financial capital for growth and expansion. Local financial systems do not sufficiently cater to the needs of SMEs, with negative consequences for economic development. This report develops interventions to close the gap in financing, and outlines contributing roles for public and multilateral actors. It describes both the challenges and the potential for international financial institutions to work through local intermediaries and stimulate capital provision to SMEs in a financially and socially sustainable manner.
This report makes a valuable contribution to the wider debate, but much more remains to be done. Future research should address the impact of providing access to finance to SMEs, and the optimal roles and responsibilities for public sector actors. We hope that this report will serve as an inspiration and impetus to others to undertake further research.
The Steering Group,
Amit Bouri (Director of Strategy and Development, Global Impact Investing Network) Mark Breij (Fund Manager, Cordaid)
Magatte Diop (Founder and Managing Partner, Peacock Investments)
Randall Kempner (Executive Director, Aspen Network of Development Entrepreneurs) Bailey Klinger (Founder, Entrepreneurial Finance Lab)
4
EXECUTIVE SUMMARY
This report outlines the need to provide capital to Small and Medium Enterprises (SMEs) in developing countries. It shows the impact of this capital on economic development, and the role for International Finance Institutions (IFIs) in the provision of this capital. Finally, it outlines recommendations for additional interventions and further research.
SMEs in developing countries face a financing gap that undermines economic prosperity
SMEs are a fundamental part of the economic fabric in developing countries, and they play a crucial role in furthering growth, innovation and prosperity. Unfortunately, they are strongly restricted in accessing the capital that they require to grow and expand, with nearly half of SMEs in developing countries rating access to finance as a major constraint. They might not be able to access finance from local banks at all, or face strongly unfavourable lending conditions, even more so following the recent financial crisis. Banks in developing countries are in turn hampered by the lack of lender information and regulatory support to engage in SME lending. The overall result is absence of a well-functioning SME lending market, and SMEs are impeded in their growth, with negative consequences for innovation, economic growth and macro-economic resilience in developing countries.
With targeted interventions, IFIs play an important role in closing this gap
Targeted IFI support, such as guarantees or technical assistance, helps to build up the knowledge and expertise of intermediaries with respect to SME lending, thus helping to catalyse an independently sustainable SME lending market. In this way, International Finance Institutions (IFIs) play an important role in catalysing the SME lending market in developing countries. As with any public intervention in private markets, the benefits need to outweigh the costs, potential adverse incentives and unintended consequences. However, IFIs are often better placed to support SMEs than local governments, whose support schemes often are less cost-efficient and more susceptible to political capture. IFIs achieve their cost-efficiency by working through local intermediaries, with the additional benefit of stimulating the creation of a local lending industry. Financial and social sustainability is further enhanced by judiciously selecting and screening intermediaries, applying strict lending standards and carefully calibrating controls and incentives.
A clear research agenda has been identified to further enhance the effectiveness of interventions. Increased research and empirical evidence will help to further strengthen the case for SME support and the effectiveness of specific interventions. Additional research on the overall impact of capital provision to (different types of) SMEs on economic and social indicators would be helpful for the overall advocacy for SME interventions. Research on the optimal structure of interventions would help to further increase the financial and social sustainability of SME interventions.
5
METHODOLOGY
This report on SME development in developing countries through financial intermediaries was drafted by Dalberg Global Development Advisors. The analysis was conducted during a period of six weeks between February 21 and April 1, 2011. Feedback was sought and incorporated during the following months. The study was made possible through financial support from the European Investment Bank (EIB).1 The report is based on extensive desk research, guidance from the steering group and additional interviews with experts from International Finance Institutions.2
The report is written to address external interested parties, including policy makers, civil society and the general public.
Dalberg would like to thank everyone who contributed to this report, in particular all interviewees, for their time and cooperation. Special gratitude goes out to the advisory panel:
Amit Bouri
Director of Strategy and Development, Global Impact Investing Network Mark Breij
Fund Manager, Cordaid Magatte Diop
Founder and Managing Partner, Peacock Investments Randall Kempner
Executive Director, Aspen Network of Development Entrepreneurs Bailey Klinger
Founder, Entrepreneurial Finance Lab Keely Stevenson
CEO, Bamboo Finance USA
Dalberg also sought the views of Transparency International.
For questions or comments, please contact Wouter Deelder at [email protected].
1 The EIB made suggestions on the content of the report, but did not influence the conclusions or overall recommendations
2 Asian Development Bank (ADB), African Development Bank (AFDB), European Bank of Reconstruction and Development (EBRD), International Finance Cooperation (IFC) and Overseas Private Investment Cooperation (OPIC)
6
INTRODUCTION TO SMEs
SME definition
The term “SME” encompasses a broad spectrum of definitions. Different organizations and countries set their own guidelines for defining SMEs, often based on headcount, sales or assets.3 While Egypt defines SMEs as having more than 5 and fewer than 50 employees, Vietnam considers SMEs to have between 10 and 300 employees. The World Bank defines SMEs as those enterprises with a maximum of 300 employees, $15 million in annual revenue, and $15 million in assets. The Inter-American Development Bank, meanwhile, describes SMEs as having a maximum of 100 employees and less than $3 million in revenue.4
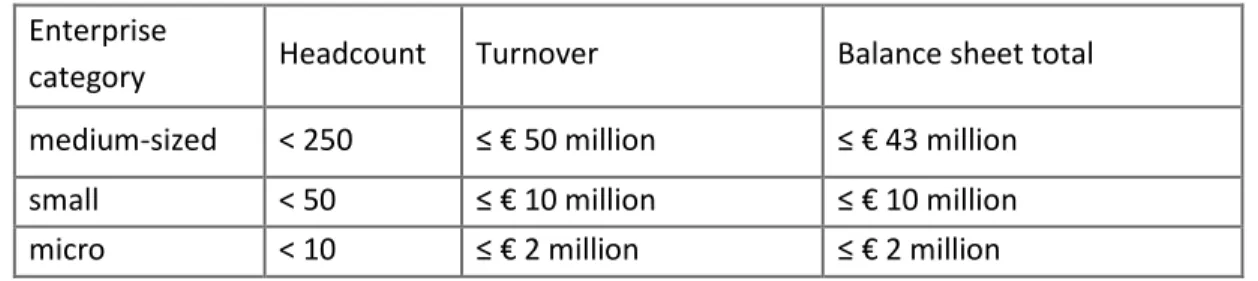
In this report,we follow the European Union definition: ‘ The category of micro, small and medium-sized enterprises is made up of enterprises which employ fewer than 250 persons and which have an annual turnover not exceeding 50 million euro, and/or an annual balance sheet total not exceeding 43 million euro.’ Small and medium enterprises are thus defined as firms with 10 to 250 employees, and more than 10 million euro turnover or annual balance sheet total.5 This definition is more encompassing, and much larger, especially with regards to turnover, than some others. The precise definition however, does not impact the overall conclusions and findings of this report.6
Figure 1 - Definition of micro-, small- and medium-sized enterprises7 Enterprise
category Headcount Turnover Balance sheet total
medium-sized < 250 ≤ € 50 million ≤ € 43 million
small < 50 ≤ € 10 million ≤ € 10 million
micro < 10 ≤ € 2 million ≤ € 2 million
3 As different organizations define SMEs differently, cross comparison can be difficult
4 Milken Institute, Stimulating Investment in Emerging-Market SMEs, October 2009. A range of definition is also included in the CGAP publication “Financial Access 2010” 5 European Commission, 2003, Extract of Article 2 of the Annex of Recommendation 2003/361/EC
6 The lack of a common definition has an effect on the eligibility of SME intervention schemes. For example, the Ghanaian definition allows support to all but 127 firms in the country (DEG Atrium dialogue on promoting SME) 7 European Commission, Enterprise and Industry, 2011. “Small and medium-sized enterprises (SMEs), SME Definition” http://ec.europa.eu/enterprise/policies/sme/facts-figures-analysis/sme-definition/index_en.htm
7
THE SME SECTOR IN THE GLOBAL ECONOMY
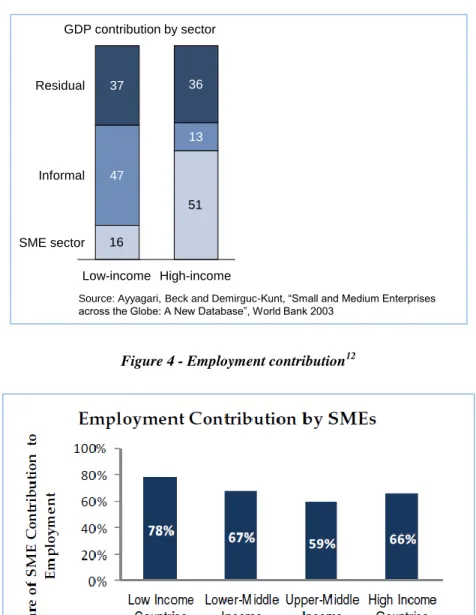
The SME sector is the backbone of the economy in high-income countries, but is less developed in low-income countries. The Organisation for Economic Co-operation and Development (OECD) reports that more than 95% of enterprises in the OECD area are SMEs. These enterprises account for almost 60% of private sector employment, make a large contribution to innovation, and support regional development and social cohesion.8 Also in low-income countries, the SME sector makes a critical contribution to GDP and employment, as shown in Figure 2, Figure 3 and Figure 4 below. 9
SMEs include a wide range of businesses, which differ in their dynamism, technical advancement and risk attitude. Many are relatively stable in their technology, market and scale, while others are more technically advanced, filling crucial product or service niches. Others can be dynamic but risk, high-tech “start-ups”.10 Researchers and practitioners agree that SMEs are crucial contributors to job creation and economic growth in both high and low-income countries.11
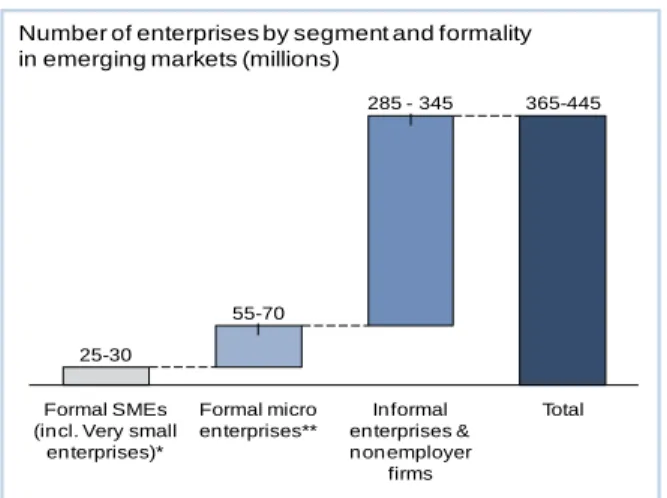
Figure 2 - Number of SMEs by segment and formality
8 OECD SME and Entrepreneurship Outlook 2005 Edition
9 Ayyagari, Demirguc-Kunt and Maksimovic , 2011. “Small vs. young firms across the world”, World Bank
10 David de Ferranti and Anthony J. Ody, “Beyond Microfinance: Getting Capital to Small and Medium Enterprises to Fuel Faster Development”. Policy Brief 159, The Brooking Institute, March 2007 11 SEAF, 2007. “From Poverty to Prosperity: Understanding the Impact of Investing in Small and Medium Enterprises Data Survey and Case Study Analysis of SEAF Investments”
*Registered enterprises typically with 5 or more employees **Registered enterprises typically with 1-4 employees
Source: International Finance Corporation, World Bank Group. “Posing the Challenge on SME Finance”. SME Finance DFI Meeting, Paris, March 2011
Number of enterprises by segment and formality in emerging markets (millions)
Formal SMEs (incl. Very small
enterprises)*
55-70
Informal enterprises & nonemployer
firms
Total 285 - 345
Formal micro enterprises**
365-445
8
Figure 3 - GDP contribution by sector
Figure 4 - Employment contribution12
12 Source: Aspen Network of Development Entrepreneurs, using data from Ayyagari, Demirguc-Kunt and Maksimovic, “Small vs. Young Firms across the World: Contribution to Job Creation, Employment, and Growth”, World Bank 2011
16
51 SME sector
Informal Residual
High-income 13 36
Low-income 47 37
Source: Ayyagari, Beck and Demirguc-Kunt, “Small and Medium Enterprises across the Globe: A New Database”, World Bank 2003
9
THE IMPACT OF ACCESS TO FINANCE ON SMEs
Access to finance is necessary to create an economic environment that enables firms to grow and prosper. SMEs in developing countries, however, face significant barriers to finance. Financial constraints are higher in developing countries in general, but SMEs are particularly constrained by gaps in the financial system such as high administrative costs, high collateral requirements and lack of experience within financial intermediaries. Increased access to finance for SMEs can improve economic conditions in developing countries by fostering innovation, macro-economic resilience, and GDP growth. Numerous studies highlight access to finance as one of the driving factors of an enabling economic environment. The World Bank and the International Finance Cooperation (IFC) rank economies according to their ease of doing business; in this framework, the ability for business to get credit is an important criterion.13 The Global Entrepreneurship Monitor (GEM) Entrepreneurship Framework Condition also highlights entrepreneurial finance, defined as the availability of financial resources for SMEs in the form of debt and equity, as one of the key factors for stimulating and supporting entrepreneurial activity.14
Access to finance helps all firms to grow and prosper.15 The Investment Climate Surveys of the World Bank show that access to finance improves firm performance. It not only facilitates market entry, growth of companies and risk reduction,16 but also promotes innovation and entrepreneurial activity. 17 Furthermore, firms with greater access to capital are more able to exploit growth and investment opportunities.18 In other words, aggregate economic performance will be improved by increasing the access to capital.19
SMEs face disproportionate barriers to finance, especially in developing countries.
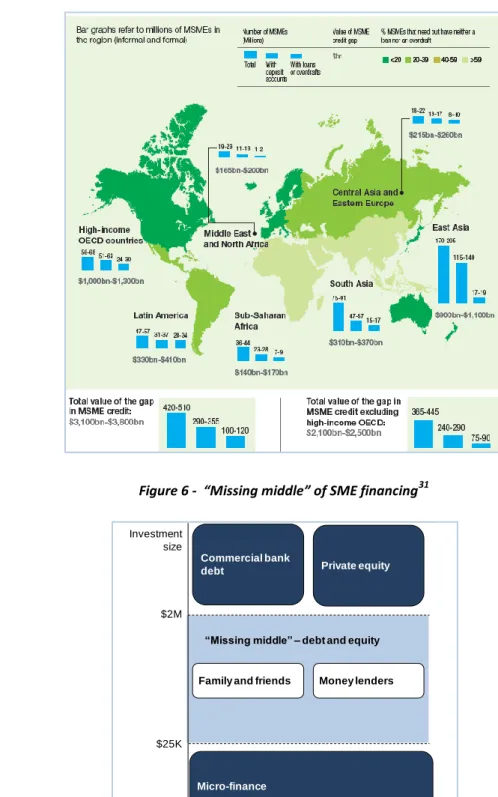
SMEs face a financing gap. Financing for SMEs is limited, particularly when compared to commercial debt for large firms and microfinance (see Figure
5
and Figure 7 below). When asked to name the most severe obstacles to growth, SMEs worldwide listed financing constraints as the second most-severe obstacle, while large firms placed it only fourth. 20Often, the costs and risks of serving SMEs are perceived to be too high by commercial finance. Microfinance loans, on the other hand, are too small to meet SME capital needs. For example, if a rural
13 World Bank, IFC, 2011. “Economy rankings” http://www.doingbusiness.org/rankings 14 Global Entrepreneurship Monitor, 2010. “GEM 2010 Global Report”
15 Interview with Thorsten Beck, March 2011
16 Beck, Thorsten and Demirgüç-Kunt, Asli , 2008. “Access to Finance: An Unfinished Agenda”. The World Bank Economic Review, Vol. 22, Issue 3, pp. 383-396, 2008 17 Klapper, Leora, Luc Laeven, and Raghuram Rajan. 2006. “Entry Regulation as Barrier to Entrepreneurship.” Journal of Financial Economics 82(3):591–629
18 Beck, Thorsten, Asli Demirgüç ¸-Kunt, and Vojislav Maksimovic. 2006. “The Influence of Financial and Legal Institutions on Firm Size.” Journal of Banking and Finance 30(11):2995–3015. 19 World Bank, Chapter 2: Firms’ Access to Finance: Entry, Growth, and Productivity http://siteresources.worldbank.org/INTFINFORALL/Resources/4099583-1194373512632/FFA_ch02.pdf 20 World Bank Group, Enterprise Surveys Database, 2010.; http://www.enterprisesurveys.org; “World Business Environment Survey” (WBES) of more than 10,000 firms in 80 countries
10
coffee producer needs a loan of $300,000, the request may be too large for the local microfinance institution, but too small, risky and remote for commercial banks. This financing gap is referred to as the “missing middle”, and is illustrated in Figure 6.
Financial constraints are greatest in low-income countries. The World Bank Enterprise Surveys reveal that, for example, in low-income countries, on average 43% of businesses with 20 to 99 employees rate access to finance or cost of finance as a major constraint to current operations. In high-income countries, only 11% of businesses of the same size rate access to finance as a constraint. 21 According to the IFC , the total financing gap for formal SMEs outside the high-income OECD countries is indicatively and preliminary estimated to be potentially as high as US$700-850 billion. 22, 23
Increased access to finance will foster efficient growth in the SME sector.
Small firms are disproportionately handicapped by a lack of finance, but they receive a stronger boost in growth than large firms if financing is provided.Financing obstacles affect small firms more than large firms. Small firms not only report higher financing obstacles, but they are also more adversely affected by these obstacles. 24,25 26,27 .
Figure
8 shows that financing obstacles in small firms have almost twice the effect as obstacles in large firms.28 This might be due partly to a lack of other financing sources, and partly because it hinders SMEs from taking advantage of economies of scale. Esther Duflo and Abhijit Banerjee have argued that production technologies follow a step-function, and that credit might be needed for SMEs to make the jump to the next step (e.g. move from manual to automatic production).2921 World Bank Group, Enterprise Surveys Database, 2010.; http://www.enterprisesurveys.org; “World Business Environment Survey” (WBES) of more than 10,000 firms in 80 countries 22 Excluding high-income OECD countries
23 IFC, 2011. “Posing the Challenge on SME Finance”, DFI Meeting in Paris
24 Beck, Thorsten, Aslı Demirgüç-Kunt, and Vojislav Maksimovic, 2005. “Financial and legal Constraints to Firm Growth: Does Firm Size Matter?” Journal of Finance 60 (1): 137–77. 25 The International Bank for Reconstruction and Development, The World Bank, 2008. “Finance for all? Policies and pitfalls in Expanding Access”
26 There is an alternative path, argued by among others Karlan and Appel (More than Good Intentions) that argues that evidence from the world of micro-finance shows that sometimes profitability is enhanced by using loans consolidate or shrink firms.
27 This effect has been observed in the field by among others Banerjee and Duflo, in their randomized study of SME lending in India, and described in Beck, Thorsten and Demirgüç-Kunt, Asli , 2008. “Access to Finance: An Unfinished Agenda”. The World Bank Economic Review, Vol. 22, Issue 3, pp. 383-396, 2008
28 Thorsten Beck, 2007. “Financing Constraints of SMEs in Developing Countries: Evidence, Determinants and Solutions” 29 Abhijit V. Banerjee and Esther Duflo, Poor Economics: A Radical Rethinking of the Way to Fight Global Poverty, PublicAffairs, 2011
11
Figure 5 - Total value of the gap in SME credit30
Figure 6 - “Missing middle” of SME financing31
30 Peer Stein, International Finance Corporation, Tony Goland, McKinsey & Company, Robert Schiff, McKinsey & Company, “Two trillion and counting - Assessing the credit gap for micro, small, and medium-size enterprises in the developing world”. International Finance Corporation, McKinsey, October 2010
31 The upper and lower limits of the missing middle and indicate, and subject to different interpretations and definitions among practicioners
Family and friends Money lenders
Micro-finance Commercial bank
debt Private equity
“Missing middle” – debt and equity
Source: CFED Desktop Study: SMEs and Poverty Reduction; Thorsten Beck, Ash Demirguc-Kunt and Vojislav Maksimovic, “Financing Patterns Around the World: Are Small Firms Different?”; Thorsten Beck and Asli Demirguc-Kunt, “Small and Medium Size Enterprises: Access to Finance as a Growth Constraint”
$25K $2M Investment
12
Figure 7 - Access to finance as a major constraint to operations
Figure 8 - Impact of growth limiting factors across firms of different sizes32
32 Beck, Thorsten, Aslı Demirgüç-Kunt, and Vojislav Maksimovic. 2005. “Financial and
legal Constraints to Firm Growth: Does Firm Size Matter?” Journal of Finance 60, 137-177
30 43
46
22 28
31
18 23
27
7 11
14
0 10 20 30 40 50
High income countries Upper middle income countries Lower middle income countries Low income countries
100+ employees 20-99 employees
<20 employees
Average % of businesses rating access to finance/ cost of finance a major constraint to current operations1
1. Countries weighted equally within income groups to calculate overall average Source: World Bank Enterprise Surveys; World Bank List of Economies
13
IMPLICATIONS OF SME GROWTH FOR DOMESTIC ECONOMIC DEVELOPMENT
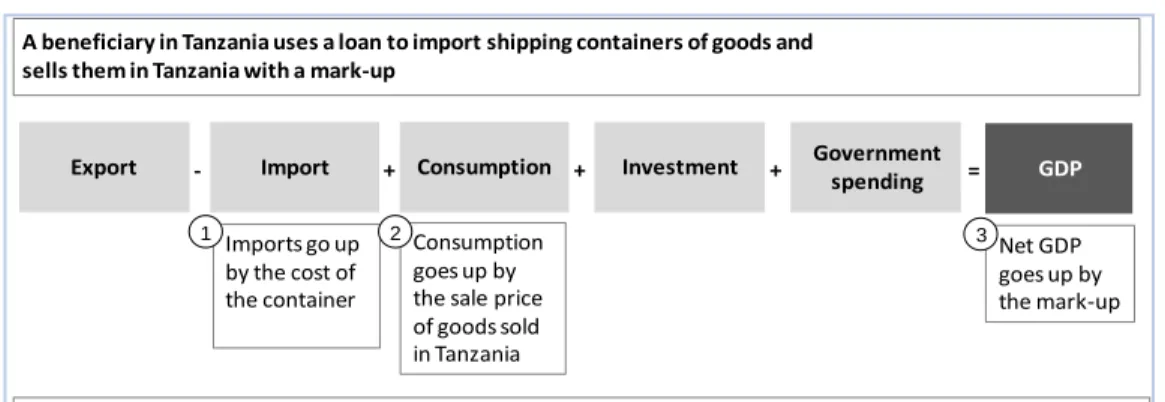
Increased SME growth has a direct effect on GDP growth due to increased output, value add and profits. The GDP contribution per SME is the difference between the return on capital and the cost of capital. Returns on capital are often high, with different datasets showing ranges up to 20-30% a month (for the most capital-strained firms), which is considerably higher than typical interest rates.33,34,35 The GDP contribution can be illustrated on a micro-level by looking at the additional economic activity generated by a hypothetical loan, as shown in figure 9 below. This example gives a simplified view on how a SME owner who invested his loan into the purchase of imported goods increases consumption and GDP. This example does not cover the significant multiplier effect in the wider economy, through the increased economic activity of employees and suppliers.36 The relationship between increased SME and GDP growth is touched upon in the World Bank’s report, Finance for All: “If entry, growth, innovation, equilibrium size, and risk reduction are all helped by access to and use of finance, it is almost
inescapable that aggregate economic performance will also be improved”.37
SME growth also impacts GDP indirectly, through increased innovation and macro-economic resilience of the overall economy. Every year new SMEs enter the market, representing 5 to 20% of the existing number of firms. Smaller firms are often the most dynamic and innovative, and can be a test ground for new business ideas. 38 Although nearly half of all start-ups will fail within 5 years, a few of them will grow to become large firms, and replace incumbents. This process yields positive structural changes to the economy, can lead to large productivity gains, and is shown to be linked to GDP growth.39,40,41,42
Finally, a stronger SME sector can bolster a country’s resilience by broadening and diversifying the domestic economy, thereby reducing the vulnerability to sector-specific shocks and fluctuations in international private capital flows.43,44
33For example, as described in http://siteresources.worldbank.org/INTFR/Resources/FPD_Issue_1.pdf, real returns to capital for SMEs in Mexico have been 20-33% per month 34 World Bank Surveys
35 A similar phenomenon was observed in microfinance with annualized returns on capital of 70% annually in one study (Karlan, Dean and Jacob Appel, More than good intentions, 2011, Penguin) 36 SEAF, 2007. “From Poverty to Prosperity: Understanding the Impact of Investing in Small and Medium Enterprises Data Survey and Case Study Analysis of SEAF Investments”
37 World Bank, “Finance for all, policies and pitfalls in expanding access”, 2008
38 Klapper, Leora, Luc Laeven, and Raghuram Rajan. 2006. “Entry Regulation as Barrier to Entrepreneurship.” Journal of Financial Economics 82(3):591–629 39 Global Entrepreneurship Monitor, 2010. “GEM 2010 Global Report”
40 Scarpetta, S., P. Hemmings, T. Tressel and J. Woo (2002), “The role of policy and institutions for productivity and firm dynamics: evidence from micro and industry data”, OECD Economics Department Working Papers, No. 329 41DEG Atrium dialogue, “Promoting small and medium Enterprises, Their importance and the role of Development Finance Institutions in supporting them, November 2010
42 Fogel, Kathy & Morck, Randall & Yeung, Bernard, 2008. "Big business stability and economic growth: Is what's good for General Motors good for America?," Journal of Financial Economics, Elsevier, vol. 89(1), pages 83-108, July. 43World Bank, “Finance for all, policies and pitfalls in expanding access”, 2008
14
More research is needed to understand the impact of SMEs on other economic development drivers. The annex to this document gives an overview of key economic studies on SMEs. However, the overall body of research is limited. As the World Bank’s report, Finance for All, concludes: “lack of systematic
information is one of the reasons why empirical research has been limited” and “little empirical evidence
links access to finance to development outcomes”.45 Many stakeholders want to understand the impact
of SME growth on cluster formation, formalization or gender and economic inequality. However, no or few studies exist on these topics, with exception of the study by Beck, Demirgüç-Kunt and Levine, which points out a lack of a link between SME growth and the alleviation of income equality or poverty alleviation.46 With a lack of empirical research, it is often hard to distinguish between an absence of evidence and evidence of absence.
Box 1: Examples of impact – the Small Enterprise Assistance Fund
A study conducted by Small Enterprise Assistance Fund (SEAF) highlights the economic impact of investments in SMEs. It found that:
o every dollar invested by SEAF in a SME generates an additional twelve dollars in the local economy
o 72% of new jobs generated go to unskilled or semi-skilled employees
o SEAF companies sustained an average annual employment growth rate of 26 percent and a wage growth rate of 25 percent in US dollar terms, surpassing national growth rates for each country
Note: SEAF is a privately managed investment fund that provides growth capital and business assistance to SMEs in emerging and transition markets, based in Washington DC
Source: SEAF, 2007. “From Poverty to Prosperity: Understanding the Impact of Investing in Small and Medium Enterprises Data Survey and Case Study Analysis of SEAF Investments”. Five of the firms studied are in Central and Eastern Europe and five are in Latin America. Their annual sales range from US$ 0.3 million to US$ 17 million. Their businesses range from handembroidered children’s clothes to electronic components and media products, though many are in food production and processing. Their numbers of employees range from 4 to 308.
Figure 9 - SME contribution to GDP growth
45World Bank, “Finance for all, policies and pitfalls in expanding access”, 2008
46Beck, Thorsten, Asli Demirgüç-Kunt, and Ross Levine, SMEs, Growth and Poverty: Cross-Country Evidence, 2005
GDP Consumption Investment Government
spending
+ + +
Imports go up by the cost of the container
Export - Import =
A beneficiary in Tanzania uses a loan to import shipping containers of goods and sells them in Tanzania with a mark-up
In general, SME owners earning a positive rate of return on additional capital are earning profits, which contribute directly to GDP
Net GDP goes up by the mark-up Consumption
goes up by the sale price of goods sold in Tanzania
15 Box 2: Impact on taxation
SME growth increases government income from taxation. Revenues and profits of SMEs contribute to governments’ corporate tax income. Moreover, they stimulate increased indirect taxes (such as value-added taxes). There might also be additional tax income through the taxation of the profits of the investment funds and banks, depending on the local capital gains taxation laws.
The location decision by funds is based on more factors than taxation. Funds make their location decision by combining the need for appropriate financial regulation (e.g. anti-money laundering legislation), political stability and rule of law, a developed financial system, and a financial service industry (e.g. accounting, auditing, legal), with the ability to facilitate cross-border capital transfers. Many African financial systems do not meet these criteria, as the systems are yet underdeveloped, with many systems smaller in size than a mid-sized bank in Continental Europe.47 Only a limited set of global financial hubs offer the required services at a competitive price. For example, Mauritius has by far the most developed financial, legal and administrative ecosystem for financial cross-border transactions in Africa. A large number of Africa-focused funds, with both African or international fund managers, have therefore chosen to locate their funds in Mauritius.
Tax revenues would, in some cases, be relatively higher if capital for SMEs was provided by a local rather than a foreign lender / investor. Some NGOs48 have criticized private equity funds that are not domiciled in mainland Sub-Saharan Africa. In order to understand this argument, it is helpful to split the tax burden in the three main components: 1) corporate taxes by the SME, 2) taxes paid by the limited partners, and 3) taxes paid by the general partners.49,50 As described above, regardless of the location of the investment fund financing them, SMEs pay corporate taxes in their countries of residence. The taxation of general and limited partners is influenced by their country of residence, the location of the SMEs, cross-border taxation legislation and overall capital gains tax rates. In some cases, the tax revenues from the limited and general partners to the government of the investment country would be higher if they were to be based in this same country. In other cases, there would be little to no difference, as there are many African countries that have low to no capital gains taxation.51
47Beck, Thorsten and Demirgüç-Kunt, Asli , 2008. “Access to Finance: An Unfinished Agenda”. The World Bank Economic Review, Vol. 22, Issue 3, pp. 383-396, 2008
48 For example, campaigns promoted by CEE Bankwatch Network, Bretton Woods Project, Both Ends, Urgewald, Les Amis de la Terre, Campagna per la riforma della Banca Mondiale, Weed 49 A diagram of the structure of a typical investment fund is included in the annex
50 There are other smaller tax components, such as the taxes paid between the fund management company and the income taxes of employees. This assumes a treatment of the investment vehicle as a “pass-through” or “look-through”.
16
This effect is less significant with regards to IFI investment. The limited partners in the fund, such as the IFIs, receive 80% of the capital gains of the fund. The location of the limited partners is independent of the location of the fund. For example, the EIB is based in Luxemburg, and furthermore, is tax-exempt due to its status as an international financial institution. By its mandate, however, it reinvests any capital returns, including capital gains and dividends of its private equity investments, back into developing countries. The taxation of the general partners (taxation on ~20% of the capital gains) is linked to the fund location and eventually to the countries of residence of the international partners and members of the management team.52 In summary, increased investment in SMEs will increase tax revenues, regardless of the location of the investment fund. The location of the fund will only influence the size of this increase. Especially in the case of IFI investment, this effect is relatively small. Investment funds will make location decisions largely based on their need for stable and sophisticated financial environments that facilitate cross-border investment. Thus, rather than regulating location decisions, the best course of action would be to support the improvement of local financial systems.
17
BARRIERS TO FINANCE FOR SMEs
The following section will first look at debt financing, and the reasons why regular banks provide insufficient debt to SMEs. It will demonstrate that the access to finance gap is a complex problem driven by several factors including lower returns, higher risk perceptions, an uninspiring regulatory environment, and a lack of intermediary skills, experience and capacity.
Debt financing
Banks are not adequately providing SMEs with capital in developing countries. As described in previous sections, there is large financing gap for SMEs in developing countries. The top five banks serving SMEs in non- OECD countries reach only ~20% of formal micro enterprises and SMEs.53 As shown in figure 10, in Sub-Saharan Africa, this number is even lower, at 5%. Nearly 25% of SMEs in emerging markets have a loan but are financially constrained, and almost 60% do not have a loan overdraft, but need one, as shown in Figure 11. This deteriorated further during the 2008-2010 financial crisis.
Banks can often earn high returns in their core markets, giving them little reason to take on additional risk in the SME market. Banks in countries with immature financial systems often face little competition and a low threat of entry and can therefore earn handsome returns by lending to large public and private players.54,55 Banks in Africa are among the most profitable, earning often returns in equity in the 15-25% range, as shown in Figure 12.56 They might realize the potential of the SME market, but they have little incentive to move outside of their comfort zone and develop SME products. 57 As Paul Collier observed: “African banks were operating profitably via the easier and safer role of lending to large firms,
and holding high-yielding government debt.” 58 As a result, in the words of a manager of one leading
African bank “we have only scratched the surface of the SME market.” 59,60
Banks incur higher administrative costs by lending to SMEs. The costs of lending to SMEs are relatively high, as loan sizes are small, and the transaction costs per loan are relatively constant. 61,62, 63 This
reduces incentives for regular banks to lend to them. The difference in fees, interest rates and relative share of loans to SMEs for African and non-African banks is shown in Figure 13.
Banks have difficulty providing long-term capital. Banks in developing countries are often reliant on short-term liabilities (such as deposits). There are few traditional long-term borrowers, such as pension
53 IFC, 2011 Posing the Challenge on SME Finance” DFI Meeting Paris, March 2011
54 USAID, Paul L. Freedman, 2004.” Designing loan guarantees to spur growth in developing countries” 55 Expert interviews
56 Mark Napier, Including Africa - Beyond Microfinance, CSFI, 2010
57 For example, a recent survey of 91 banks in 45 developed and developing countries found that over 80% of these banks perceived the SME sector as a large market with good prospects(Beck, Demirguc-Kunt, Martinez Peria, 2008)
58 Paul Collier, “Rethinking Finance for Africa’s small firms”. Proparco Private Sector Development, Issue 1, May 2009 59 Dalberg study for the AFD on credit guarantees (to be published)
60 Competition in the banking sector thus has a direct effect on the ease of financing for SMEs, as pointed out in Beck, Thorsten and Demirgüç-Kunt, Asli , 2008. “Access to Finance: An Unfinished Agenda”. The World Bank Economic Review, Vol. 22, Issue 3, pp. 383-396, 2008
61 Compared to e.g. lending to large companies
62 Costs per loan do not linearly decrease as the loan size declines
18
funds, that can provide long-term liabilities to banks. Banks are thus challenged, to avoid a mismatch in the maturities of assets and liabilities, in providing long-term capital to their borrowers (including SMEs). In some countries and regions, such as West Africa, local regulation might further curtail the banks’ ability to attract long-term funding64, leading the AFDB to conclude that “Maturity mismatch, stringent bank regulations, and an underdeveloped capital market characterize the West Africa Economic and
Monetary Union (UEMOA) region”.65 As shown in the next chapter, IFIs can play an important role in
addressing the duration gap by providing long-term capital at favourable rates.
Banks have difficulty providing tailored foreign exchange products. SMEs seek financing in currencies that match their income streams, to prevent foreign exchange mishaps. SMEs that have income in foreign currencies (e.g. USD for a cocoa trader) want debt in the same currency. Alternatively, an SME with only local currency income wants to avoid dollar-denominated debt. Banks in developing countries sometimes face restrictive local regulation and limited forex availability that make tailored foreign exchange solutions more difficult.66
Banks have limited information, skills and regulatory support to engage in SME lending. There are a variety of different forms of SME lending, as shown in
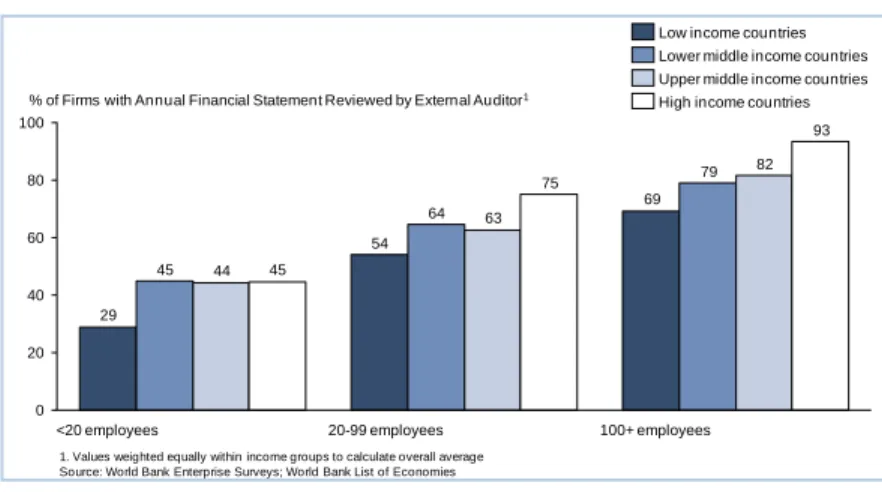
Figure 14. Many forms, however, are difficult to implement in developing countries. The countries often have weak accounting standards, and the SMEs have little to no accurate financial statements on their revenues, profits and ability to pay (see Figure 15). Furthermore, there is often little to no general market data available on the SME market and specific sub-sectors (e.g. default rates).67 This limits the
potential for lending based on financial statements or small business credit scores. Therefore, banks primarily engage in relationship-based or other forms of collateral-based lending, rather than cash-flow based lending. Banks tend not to provide financing for working capital to SMEs, which is cited by SMEs as one of the areas of greatest need. The lack of collateral for some borrowers and/or clear recourse legislation (e.g. ability to claim collateral) however, can complicate the possibilities to do collateral based lending (e.g. asset-based, real-estate or equipment lending). Finally, banks need specific skills to engage in the different forms of SME lending. A recent Dalberg survey showed that the difficulty in establishing credit-worthiness was a key barrier, with 80% of banks stating challenges in this area.68Lack of these skills can lead banks to shun the SME market in its entirety, and invest only in high-yielding sovereign government debt, or it can translate into inadequate risk management, leading to lower repayment rates and returns. Some recent initiatives, such as the IFC SME banking guide, are aimed at decreasing this skill gap.
These characteristics of the banking system generate unfavourable lending conditions for SMEs.69The higher costs, lack of skills and higher (perceived) risks of investment in SMEs translate into high interest rates and collateral requirements (see Figure 13 and Figure 16). Banks sometimes charge more than
64 The regulations by the Banque Centrale des Etats de l’Afrique de l’Ouest- (BCEAO) stipulate that the ratio of medium and long term loans to time deposits (transformation ratio) must not exceed 25 percent 65http://www.afdb.org/fileadmin/uploads/afdb/Documents/Publications/Development%20Research%20Brief%20%20No%203%202010%20Lenghening%20Financial%20Contracts.pdf
66 This effect is not present in dollarized economies (e.g. Nigeria, Ghana) or liberalized foreign exchange regimes (e.g. the CFA Zone) 67 For example, 70% of banks state that lack of credit bureaus in their country hampers SME lending (SME Banking Guide) 68 Dalberg study for AFD on credit guarantees (to be published)
19
150% of the loan amount in collateral, and interest rates might be 5 to 6% higher than in the rest of the world.70,71,72 Furthermore, posting collateral is complicated by the fact that most SMEs operate in environments with weak property rights and poor contract enforcement (see Figure 17), in which borrowers do not have legal titles to house or land, and therefore cannot use these as collateral.73,74,75 SME lending is further held back by a self-reinforcing market failure. The lack of SME lending leads to higher costs and lack of familiarity and knowledge, which in itself can lead to adverse selection (only the riskiest SMEs seek external financing), which in turn can lead to higher costs and interest rates, and less lending. Stiglitz and Weiss showed that this vicious cycle/market failure can lead to an end-state in which no SME lending takes place at all.76
Equity financing
A nascent industry of equity providers has emerged in developing countries. Whereas the previous sections discussed the barriers in the provision of debt, this section focuses on equity. As discussed in the previous chapter, SMEs can grow into large firms on a combination of equity investment by the founder77, debt and retained earnings. However, the provision of external equity (“private equity”) becomes relevant to facilitating changes in ownership of these larger SMEs, for example when the founder wants to retire. Secondly, there is a sub-set of SMEs, especially start-ups with highly uncertain and fluctuating cash-flows, that are harder to finance through a debt model, and are better suited to external equity investment (“venture capital”).
Historically, there were few external equity providers in developing countries, whether private equity or venture capital. The venture capital and private equity industry is still relatively new, and most players have not expanded beyond the developed world. Furthermore, equity financing is hampered by similar reasons as debt financing (e.g. asymmetric information, lack of reliable financial information).78 Finally, entrepreneurs in developing countries have little familiarity and affinity with the equity model. However, over the last decade a private equity industry for developing countries has surfaced, due to the efforts of pioneers such as Business Partners.79 Dalberg identified 192 private equity funds supporting SME investment in emerging markets and developing countries with an aggregated capital of US$7 billion. Many of these funds were created in the last five years, and 60% of them focused on Sub-Saharan Africa. 80
70 The collateral requirements should seen in the context of the other barriers. Collateral requirements in Germany are 124% for small firms and 130% for medium firms, yet access to finance is not considered a major barrier to SMEs in Germany
71 Brian Milde, 2008 “Closing the gap: Reaching the missing middle and rural poor through value chain finance” Enterprise Development and Microfinance; Green Leeds, Roger S. 2003. “Financing Small Enterprises in Developing Nations”, New York: Transnational Publishers
72 Maria Soledad Martinez Peria, “Bank financing to SMEs: What are Africa specificities”, Proparco Private sector magazine, May 2009 73 USAID, Paul L. Freedman, 2004.” Designing loan guarantees to spur growth in developing countries”
74 de Soto, Hernando. 2000. “The Mystery of Capital: Why Capitalism Triumphs in the West and Fails Everywhere Else”. New York: Basic Books
75 In Africa, “less than 10% of the continent’s land is formally owned, and barely one African in ten lives in a house with title deeds” Source: The Economist. January 17, 2004. “Survey: How to make Africa smile -, a survey of sub-Saharan Africa,” Special Section 6.
76 Stiglitz, J. E., and Weiss, A. (1981), Credit Rationing in Markets with Imperfect Information, American Economic Review 71, 393–410 77 Often augmented by friends and family
78 DEG Atrium dialogue, “Promoting small and medium Enterprises, Their importance and the role of Development Finance Institutions in supporting them, November 2010
79 Business Partners Limited is a specialist risk finance company for formal small and medium enterprises (SMEs) in South Africa, and selected African countries (http://www.businesspartners.co.za/) 80 Dalberg analysis, 2009
20
These players focus mostly on large- and medium-sized firms, and would commonly not invest in smaller SMEs. However, some specialized investment firms have emerged, such as Bamboo Finance 81, which focus on financing small enterprises that have an intentionally positive social impact and address poverty beyond local economic stimulation. In addition, albeit still at a very small scale, the first local venture capital funds have started to emerge in developing countries.
Box 3: Overall effects of the financial crisis on SMEs in developing countries
The financial crisis of 2008-2010 increased the financing gap for SME financing. Banks tightened lending standards during the financial crisis. This resulted in shortened maturities, increased collateral requirements and higher interest rates. Foreign banks reallocated liquidity from their overseas operations, and governments increased their borrowing to cover deficits. 1 This led to a crowding out of financing for market players, such as SMEs, who already had limited access to financial support, and were thus most affected by the tightened lending standards.
The impact of the crisis on companies (including large firms and SMEs) in the developing world has initially not been as marked as in the developed world or in emerging economies. This is mainly due to their comparatively lower reliance on foreign financing and weaker linkage (de-coupling) with the world markets. However, the economies still suffered from delayed effects (secondary shocks) due to the impact through trade and capital flows. Trade flows can be effected by lesser demand for exports (e.g. commodities), and financial flows can be effected due to reduced remittances and due to foreign banks reallocating funds back to their home markets82. As mentioned above, firms in all economies will suffer from reduced credit availability, while SMEs in developing countries also suffer from reduced trade credit by larger firms. 1
Countries in the ACP regions were, however, exposed to country-specific crises. Countries in Africa provide different levels of access to SME finance. Similarly, these countries are affected by different local crises (e.g. conflicts, disasters) and windfalls that accompanied the financial crisis, creating a divergence in impacts.
Impact data is only emerging slowly. The financial crisis is still a recent event. Sufficient data is not yet available to assess the impact of the recent financial crisis on SME access to finance.2 In addition, the effects of the economic crisis on financial regulation are still not clear. Changes in the international financial architecture might decrease the attractiveness of investing in developing countries. Thus, the impact of the financial crisis on developing countries, and on SMEs in particular, might only become clear in
81Bamboo Finance is a commercial investment firm specializing in the financing of global social entrepreneurship by supporting innovating enterprises addressing poverty through affordable healthcare, housing, water, energy and the like. (http://www.bamboofinance.com)
82 Due to the relative low levels of equity invested by foreign banks in African subsidiaries, it is unclear whether this reallocation of capital happened in practice (Beck and
21 the coming years.
Sources:
1 Paul Collier, “Rethinking Finance for Africa’s small firms”. Proparco Private Sector Development, Issue 1, May 2009 2 Scaling-Up SME Access to Financial Services in the Developing World; Financial Inclusion Experts Group, SME Finance Sub-Group; October 2010, International Finance Cooperation, World Bank Group, G 20 Seoul Summit 201
Figure 10 - Number of SMEs reached by banks83
Figure 11 - Financing constraints of SMEs84
83IFC, 2011 Posing the Challenge on SME Finance” DFI Meeting Paris, March 2011
84Formal SMEs consists off those SMEs that are incorporated and registered, for example with the tax authorities, in contrast to informal SMEs
as a % of formal enterprises in region
as % of formal enterprises with bank accounts in region
7 16 26 31 50 68 5 14 17 24 20 45 0 10 20 30 40 50 60 70 Eastern Europe & Central Asia
Sub-Saharan Africa Middle East &
North Africa
South Asia East Asia
Latin America
Numbers are approximations
Source: International Finance Corporation, World Bank Group. “Posing the Challenge on SME Finance”. SME Finance DFI Meeting, Paris, March 2011
Number of SMEs reached by the top five banks serving MSMEs in each region (in %)
Do not need a loan Do not have a
loan overdraft but need a loan 21-24
Hava a loan and/or overdraft and no financing constraint
8-10
Have a loand and/or overdraft but financing constraint 45-55 Total formal SMEs in emerging markets 16-20 100
Source: IFC and McKinsey Database 2010
Note: The number of SMEs unserved or underserved is calculated based on SME access to bank loans and overdrafts only (i.e. Not prise surveys, IFC MSME database, literature searches and McKinsey proprietary research)
Formal SMEs’ use of financial institutions loans and financing constraints
22
Figure 12 - Bank’s return on equity across regions85, 86
85Thorsten Beck, Tilburg University and the Centre for Economic Policy Research (CEPR), Michael Fuchs, The World Bank, Marilou Uy, The World, 2007. “BankFinance in Africa:Achievements and Challenges”
23
Figure 13 - Differences in SME lending within and outside Africa
Figure 14 – types of SME lending
There are different ways to lend to SMEs. (Taketa, Udell, 2006). The type of borrower, a lack of information and a lack of legislation can complicate / close off a number of these lending technologies.
Source: Taketa, K. and G. F. Udell (2007) Lending Channels and Financial Shocks: The Case of Small and Medium-Sized Enterprise Trade Credit and the Japanese Banking Crisis. Monetary and EconomicStudies25(2): 1-44.
24
Figure 15 - Availability of financial information of SMEs
Figure 16 - Financing obstacles for SMEs87
Figure 17- Cost/time taken to register property and enforce contracts
87Julien Lefilleur, “Financing SMEs in the context of strong asymmetry of information”. Proparco Private Sector Development, Issue 1, May 2009 69 54 29 79 64 45 82 63 44 93 75 45 0 20 40 60 80 100
High income countries Upper middle income countries Lower middle income countries Low income countries
100+ employees 20-99 employees
<20 employees
% of Firms with Annual Financial Statement Reviewed by External Auditor1
1. Values weighted equally within income groups to calculate overall average Source: World Bank Enterprise Surveys; World Bank List of Economies
43 61 100 4.5 5.6 8.4 0 50 100 150 6 8 4 2 0 High income 10 Middle income Low income
Time taken to register property (days)
Cost of registering property (% of income per capita)
526 649 605 53.6 Middle income 20.5 High income 0 33.3 Low income 800 600 200 400 0 20 60 40
Time taken to enforce contract (days) Cost of enforcing contract (% of income per capita)
Registering property Enforcing contracts
25
THE ROLE FOR IFIs IN SME FINANCING
IFIs play a substantial role in improving access to finance for SMEs in developing countries. They are often better placed to perform this role than individual donor governments or local governments, due to the IFI model of working through intermediaries, the provision of technical assistance, as well as benefits in cost efficiency, incentive alignment and sustainability.
IFIs have built up extensive portfolios of SME loans and investments. IFIs have exhibited strong interest in development interventions in the SME space. SME financing programs combine three IFI priority areas: private sector development, promotion of access to finance and SME growth.88 The total amount of capital committed by IFIs to SMEs in developing countries is difficult to estimate, as data isn’t available for every individual SME portfolio. Besides the provision of capital, IFIs have invested significantly in activities and programmes around policy advice, technical assistance and capacity building.89
It is likely that IFI engagement in the SME space will increase further in coming years. The interest of the global community in SMEs shows no sign of diminishing: they were on the agenda during recent G20 meetings, including the Pittsburgh meeting, which emphasized the need to “scale up successful models of SME financing”90, and the meeting in Seoul, where government leaders and IFIs launched a new facility to support innovative SME financing models.
IFIs target the barriers that limit access to finance for SMEs. IFIs provide capital and technical support to address the barriers outlined in the previous chapter. Through the provision of long-term capital and tailored foreign exchange products, they help to strengthen the matching of the type and structure of assets with the liabilities for intermediary banks. Their support helps overcome barriers in skills, information and regulatory support, both through the experience gained by intermediaries in on-lending of the provided capital, and through capacity-building interventions. Finally, they improve the wider lending environment by supporting regulatory frameworks and developing the overall lending infrastructure (e.g. supporting creation of credit agencies).
IFIs are generally better placed than other public actors to support SMEs in developing countries. The scale and skills of IFIs, combined with their operating model of working through local financial intermediaries, allow them to support SMEs more efficiently and effectively than individual member governments in donor countries or local governments in developing countries. The following paragraphs outline the main advantages:
88 IFIs include in the context of this chapter also bilateral financing institutions, such as development financing institutions (DFIs)
89 Scaling-Up SME Access to Financial Services in the Developing World; Financial Inclusion Experts Group, SME Finance Sub-Group; October 2010, International Finance Cooperation, World Bank Group, G 20 Seoul Summit 2010 90 The G20 Financial Inclusion Experts Group (FIEG) was launched in Pittsburg. From: DEG Atrium dialogue, “Promoting small and medium Enterprises, Their importance and the role of Development Finance Institutions in supporting them, November 2010
26
Alignment of incentives. Government schemes to support SME investment are common, but they have had mixed effectiveness.91 The effectiveness and efficiency of many attempts by local public actors to increase SME lending has been judged as “problematic”92 and “doubtful”.93,94 The lack of impact is sometimes linked to the direct management of credit facilities by public actors, the misuse of funds to foster political rather than economic objectives, or the subversion of loans for political goals.95 IFIs are much less likely to be captured by local interests, as they are significantly less sensitive to local stakeholders, focus explicitly on long-term sustainability, and operate at arm’s length by using financial intermediaries. Therefore, the incentives of IFIs are likely to be more compatible for sustainable SME support than those of local public actors.
Improved cost-efficiency. IFIs operate by working with financial intermediaries. This approach improves cost efficiency in comparison with direct lending to SMEs, the model used by some local governments. IFIs would face two main challenges if they lent directly to beneficiaries; first, IFIs do not possess the capacity to serve and monitor the large number of potential clients in emerging markets (350-450 million), and second, most IFIs based in developed countries have cost structures that would not allow cost-effective selection and monitoring of beneficiaries in developing countries. Working through local intermediaries not only reduces costs, but also enables IFIs to take advantage of the local intermediaries’ knowledge of and closeness to the final beneficiary. In addition, it allows IFIs to analyse and mitigate potential risks more effectively. 96 This argument is supported by IFC evaluations that suggest direct financing is costly and ineffective in meeting the needs of clients 97 , and historically there has been a shift away from direct investment toward “wholesaling” SME support through financial intermediaries.98 Other evaluations have shown that “some of the best-regarded schemes do not
conduct retail assessments but instead rely on an assessment of the intermediary.”99
Finally, the overall cost-efficiency of most IFIs’ SME facilities is corroborated by the fact that they are profitable and self-sustaining, which unfortunately is not true of many local government schemes.100
IFIs are capable of offering an integrated approach toward SME finance. The previous chapter described how the access to finance gap is a multifaceted problem, driven by a lack of capital, as well as by a lack of intermediary skills, experience and capacity, and a lacklustre regulatory environment. IFIs have an advantage in the sense that they can offer technical assistance and capacity building alongside financial support, and provide support and interventions to
91 Scaling-Up SME Access to Financial Services in the Developing World; Financial Inclusion Experts Group, SME Finance Sub-Group; October 2010, International Finance Cooperation, World Bank Group, G 20 Seoul Summit 2010 92 World Bank, 2004, “World Development Report 2005: A Better Investment Climate for Everyone”, Washington D.C.: Oxford University Press
93 Levitsky, Jacob, Credit guarantee schemes for SMEs – an international review, Small Enterprise development, 1997 94 World Bank, “Finance for all, policies and pitfalls in expanding access”, 2008, page 163
95 World Bank, “Finance for all, policies and pitfalls in expanding access”, 2008, page 163
96 Final beneficiary can be defined as the local SME receiving IFI financing through the local financial intermediary. Example: The IFC provides financing to a Kenyan Bank, which on-lends this money to a local SME, which uses the money to invest in its farming activities
97 Private sector development strategy – directions for the World Bank Group, April 9, 2002 98 Private sector development strategy – directions for the World Bank Group, April 9, 2002 99 World Bank, “Finance for all, policies and pitfalls in expanding access”, 2008
27
strengthen the lending environment. These interventions can help, for example, to reduce the probability and impact of defaults in the loan and portfolio, and to reduce the overall transaction costs to investors/lenders.101 Interventions to reduce the probability of default are linked to decreasing information asymmetries, such as investment in credit bureaus.102 An example of an intervention to reduce losses in case of a default would be the creation or streamlining of collateral recovery procedures.103 IFIs’ capabilities to operate integrated programs differentiate them from other actors.
The IFI model stimulates sustainable local financial systems. IFI support can play a crucial role in building strong and sustainable local financial systems in developing countries. First, IFIs do not “crowd-out” other private sector investors. They target market imperfections that result in a lack of financing for creditworthy borrowers. Thus, IFIs aim to provide capital that would not be provided by other parties, and do not replace the efforts of other private sector actors (i.e. the provided capital is “additional”). Secondly, by working through intermediaries, IFIs help these players gain skills, experience and a track record. Capital and support from IFIs in the form of credit appraisal and technical assistance can reduce the barriers for local institutions to operate in the SME sector. The lenders may eventually acquire sufficient skills and information to lend to SMEs without assistance.104 Thirdly, IFIs support both local and foreign intermediaries, in contrast to many other players. Foreign banks can play a beneficial role by introducing competition, increasing efficiency and transmitting knowledge and skills; in doing so, they contribute to a stronger local financial ecosystem.105,106 Beck, Fuchs and Uy observe that foreign bank activities tend to have a positive overall effect on the efficiency and stability of countries’ financial systems.107 Overall, the IFI model will help to strengthen the local financial system, and will allow intermediaries in poorer countries with currently underdeveloped capital markets to raise financial resources locally in the long term. In the meantime, however, intermediaries, the SME sector and the economy as a whole will benefit from the capital and skills provided by IFIs.108
Box 4: Breakdown of types of SME financing by IFIs: Credit lines
Credit lines are loans to intermediary banks and financing institutions. These institutions pass on the loans to local SMEs in support of their investment projects. Guarantees
101 Scaling-Up SME Access to Financial Services in the Developing World; Financial Inclusion Experts Group, SME Finance Sub-Group; OCTOBER 2010, International Finance Cooperation, World Bank Group, G 20 Seoul Summit 2010 102 Emilio Sacerdoti, “Credit to the private sector in Sub-Saharan Africa, developments and issues”. Proparco Private Sector Development, Issue 1, May 2009
103 Emilio Sacerdoti, “Credit to the private sector in Sub-Saharan Africa, developments and issues”. Proparco Private Sector Development, Issue 1, May 2009
104 Honahan, P., 2008. “Partial Credit Guarantees: Principles and Practice”, Trinity College Dublin, Prepared for the Conference on Partial Credit Guarantees, Washington DC, March 13-14, 2008 105 World Bank, “Finance for all, policies and pitfalls in expanding access”, 2008
106 Beck, Thorsten, Demirguc-Kunt, Asli, 2006. “Small and Medium-size enterprises: Access to Finance as a Growth Constraint” 107 Beck, Thorsten, Michael Fuchs, and Marilou Uy, Finance in Africa – Achievements and Challenges, 2009.
28
Credit guarantees insure/guarantee part of the credit risk for banks. The IFI takes on part of the credit risk for intermediaries by committing to reimburse the intermediary if the final beneficiary fails to repay a loan.109
Private equity investments
IFIs provide financing to private equity funds, whose managers in turn invest the IFIs’ and other private investors’ money in equity of businesses in developing countries. The private equity funds acquire a share of ownership of the SME’s business, and, by making additional capital available to them, enable them to grow and expand their economic activity.
Box 5: The IFI intermediary model: Controls and Incentives
IFIs aim to promote optimal behaviour by their intermediaries at the lowest possible costs. The following paragraphs outline the key elements of this model.
The IFI objective is to align incentives with the intermediary. IFIs are careful to minimize moral hazard (i.e. reckless conduct110) or adverse selection at the level of FIs or SMEs. The IFI support needs to be structured so that the incentives of the intermediary are aligned with those of the IFI, which is done by leaving part of the financial risk with the intermediary. This maintains incentives for the intermediary to screen beneficiaries thoroughly. Numerous 100% or near-100% government guarantee schemes have resulted in excessive defaults.111 Most IFIs do not take more than 50% of the financial risk of the final beneficiaries. There is on-going academic research on the optimal structure of credit guarantees and on on-lending standards that create the right incentives for the intermediary.112
IFIs have developed environmental, social and governance standards for their intermediaries. IFIs delegate the selection and the monitoring of final beneficiaries to the FIs. However, all IFIs have statutory policies on environmental, social and governance standards (ESG) issues, and thus have developed control frameworks to ensure that FIs follow these standards and improve the intermediaries’ internal monitoring processes. At the same time, the complexity of standards and the monitoring costs need to be as low as feasible, in order to reduce negative consequences for FI competitiveness.113
IFIs use similar approval and disclosure processes to safeguard the ESG impact of their investments. Dalberg completed a benchmark analysis between the different IFIs
109Guarantees can be partial or full, and can be at the level of individual borrowers or at the level of the portfolio. 110 Borrower might also engage in more risk-seeking behavior if he knows that the loan is guaranteed by a third party. 111 USAID, Paul L. Freedman, 2004.” Designing loan guarantees to spur growth in developing countries”
112 Scaling-Up SME Access to Financial Services in the Developing World; Financial Inclusion Experts Group, SME Finance Sub-Group; OCTOBER 2010, International Finance Cooperation, World Bank Group, G 20 Seoul Summit 2010 113 Expert interviews with IFIs
29
on their approval and disclosure processes. IFIs’ approval procedures are largely similar, regarding both debt and equity. For example, none of the IFIs can publicize the names of beneficiaries without their consent, due to the need to respect client confidentiality. The annexes of this document give a summary of this benchmark analysis.
Public discussions need to maintain a focus on the balance between the costs and benefits of intermediary monitoring. The IFI on-lending through financial intermediaries is a principal-agent problem where the principal (the IFI) needs to monitor the performance and actions of the agent (the financial intermediary).114 There needs to be a balance between the costs and benefits of monitoring the agent; it is possible that the costs of increased monitoring outweigh the marginal benefits.115Although it still might be possible to decrease the amount of undesired behaviour in this case, the overall monitoring cost increase would be disproportionally large. Public money in this case would be wasted, and the beneficiaries of the IFIs in the developing world would lose out. Dalberg cannot estimate at the moment whether the optimal trade-off between monitoring costs and benefits has been achieved, and we realize that donors and IFI management are highly sensitive to the performance shortcomings of the financial intermediary. However, we do observe that the realization that there is a trade-off between costs and benefits, and a potential optimum in which there might be a limited amount of incidents, is often absent from stakeholder discussions.
114 There are additional principal-agent problems between the funders of the IFI and the IFI, and between the FI and its borrowers