NATIONAL CENTER FOR EDUCATION STATISTICS
Technical Report
August 1990
National Education Longitudinal Study of 1988
Base Year Sample
Design Report
~'NELS
I
'IO88~
Bruce D. Spencer Martin R. Frankel Steven J. Ingels Kenneth A. Rasinski Roger Tourangeau
NORC, A Social Science Research Center University of Chicago
Jeffrey A. Owings Project Officer
National Center for Education Statistics
Data Series:
DR-NELS: 88-88-1.7
NCES 90-463 U.S. Department of Education
U.S. Department of Education Lauro F. Cavazos
Secretary
Off ice of Educational Research and Improvement Christopher T. Cross
Assistant Secretary
National Center for Education Statistics Emerson J. Elliott
Acting Commissioner Information Services Sharon K. Horn
Director
National Center for Education Statistics
"The purpose of the Center shall be to collect, and analyze, and disseminate statistics and other data related to education in the United States and in other nations."-Section 406(b) of the General Education Provisions Act, as amended (20 U.S.C. 1221 e-1).
August 1990
Contact:
Jeffrey A. Owings (202) 357-6777
Base Year Samnple Design Report
Preface
The purpose of this technical report is to document the sampling procedures and the results of data collection for the National Education Longitudinal Study of 1988 (NELS:88) base year survey of eighth graders. This version of the NELS:88 Base Year Sample Design Report is an abridgement, pre-pared by Kathryn L. Dowd, of a more extensive contractor report (Spencer et al., 1989) on the base year sample design. In accordance with the confidentiality provisions of Public Law 100-297, it was necessary to abridge the report in order to avoid reporting any information that could potentially be used to statistically disclose school identities. This version of the report is designed to be used as a companion to the NELS:88 Base Year Data File User's Manuals and is intended specifically to pro-vide additional documentation on sampling issues that may be of interest to users of the public release data tapes.
Copies of the data collection instruments; a description of the data collection, preparation, and processing procedures; and a guide to the data files and codebook, can be found in the four (student, parent, teacher and school administrator) NELS:88 Base Year Data File User's Manuals (Ingels et al.,
1990/a,b,c,d). The base year data tapes are available from the National Center for Education Statistics.
Base Year Sample Design Report
Executive Summary
The purpose of this technical report is to document the sampling procedures and the results of data collection for the National Education Longitudinal Study of 1988 (NELS:88) base year survey of eighth graders. Chapter 1 gives an overview of the NELS:88 base year survey. Chapter 2 summa-rizes the base year sample selection procedures and gives the results of data collection. Chapter 3 de-scribes the calculation of sample case weights and the adjustment of the weights for nonresponse. Chapter 4 examines survey and item nonresponse. Chapter 5 describes procedures for computing sam-pling errors and design effects.
Following is a brief summary of the major contents of the report:
The National Education Longitudinal Study of 1988 is a survey of the school-related experi-ences and accomplishments of a nationally representative sample of eighth graders. The target popula-tion consisted of all public and private schools containing eighth grades in the fifty states and District of Columbia. Included in the NELS:88 sample is a supplementary sample of Hispanic and
Asian/Pa-cific Islander students (and their parents and teachers) sponsored by the Office of Bilingual Education and Minority Language Affairs (OBEMLA), and a supplement of hearing-impaired children for which additional audiological data were obtained.
The student population excludes students with severe mental handicaps, students whose com-mand of the English language was not sufficient for understanding the survey materials (especially the cognitive tests), and students with physical or emotional problems that would make it unduly diffi-cult for them to participate in the survey (5.35 percent of the potential student sample). Because the excluded students from the base year are a possible source of undercoverage bias, plans have been made to follow a substantial subsample of them in the NELS:88 first and second follow-ups.
The NELS:88 survey used a two-stage stratified, clustered sample design. At the first stage, about 69 percent of the initially selected schools participated. School administrator data was obtained from ninety-eight percent of the participating schools. At the second stage, about 93 percent of the sampled students agreed to participate. Roughly equally high percentages of teachers and parents of the participating students also agreed to take part in the survey. Weights for school administrators and students were adjusted to compensate for nonresponse. Separate weights were not provided for par-ents or teachers.
School-level response rates were lower for public schools and for non-Catholic private schools. These results are similar to those in the High School and Beyond Base Year sample. School response rates were somewhat higher for urban schools than for suburban or rural schools, in contrast to High School and Beyond where urban schools were the least likely to participate.
Analysis of design effects indicates that the NELS:88 sample was slightly more efficient than the High School and Beyond sample. Based on student questionnaire data for all students, the aver-age design effect in NELS:88 was 2.54; the comparable figure was 2.88 for the High School and Be-yond sophomore cohort and 2.69 for the senior cohort. This difference is also apparent for subgroup estimates, especially for students attending Catholic schools. In NELS:88, the average design effect for Catholic schools is 2.70; in High School and Beyond, it was 3.60 for the sophomores and 3.58 for the seniors.
Base Year Sample Design Report
Acknowledgments
The authors wish to thank all those persons who contributed to the production of this report. Louis Rizzo conducted the school nonresponse analysis that formed the basis for adjustments of the
school weights. David Matheson assisted with the item response analysis reported in Chapter 4. Suzanne Erfurth conducted an extensive editorial review. Paul Buckley, Gloria Rauens, and David Pieper assisted with the computation of various statistics on the sample allocation, the case weights, and completion rates. Katy Dowd carefully reviewed and edited the documentation presented here to ensure compliance with the confidentiality provisions of Public Law 100-297. Our appreciation is also extended to Barbara Lockhart, Anthony Markward, James McDonald, Keith Privett, and Amelia Solorio, for their assistance during various stages of the production of this report, and to Laurie Hendrickson for carefully preparing the desktop-published version.
Finally, we would also like to thank those members of the staff of the National Center for Edu-cation Statistics who have worked closely with us on this project: Jeffrey A. Owings, Chief of the Longitudinal and Household Studies Branch, who served as the Project Officer for the base year study from its inception; and Anne Hafher, the Project Officer for the first follow-up of NELS:88. Thanks go also to Ralph Lee, Jerry West, Peggy Quinn, and Teresita Kopka.
Base Year Sample Design Report
Table of Contents
1 1.1 1.1.1 1.1.2 1.1.3 1.1.4 1.2 2 2.1 2.1.1 2.2 2.3 2.4 2.5 2.6 2.7 2.7.1 2.7.2 2.7.3 2.7.4 2.7.5 2.8 3 3.1
Page
Preface ... ... . ... 1
Executive Summary ... ... iv
Acknowledgments ... v
Introduction ... 1
Overview of NELS:88 ... .1...
NCES's Longitudinal Studies Program ... .1...
The National Longitudinal Study of the 1970s (NLS-72) ... .. 1
High School and Beyond of the 1980s (flS&B) .... ... 2
The NELS:88 Base Year Survey ... ... 2
Overview of Chapters 2 through 5 ... ... 4
Sample Design and Implementation ... ... 6
Base Year Survey Sample Design ... ... 6
Exclusions from the Sample ... ... 6
Sampling Frame...1 1 Stratification ... ... 12
Allocation of Numbers of Schools To Be Sampled .. ... 13
Selection of Schools within Strata ... ... 15
Design Allowance for School Nonresponse ... ... 16
Selection of Students, Parents, Teachers and School Administrators.. . 16
Selection of Students ... ... 16
Sample Updating ... ... 17
Selection of Parents ... ... 17
Selection of Teachers ... ... 18
Selection of School Administrators ... ... 20
Data Collection Results ... ... 20
Sample Weights ... ... 25
Weighting Procedures. ... 25
Nonresponse-Adjusted Weights for Schools. ... 26
Second-Stage Sample Design Weights for Students. ... 27
Nonresponse Adjusted Weights. ... 30
School And Item Nonresponse Analysis. ... 33
School Nonresponse. Rate. ... 34
Estimating the Magnitude of School Nonresponse Bias. ... 36
Item Nonresponse Analysis. ... 39
Standard Errors And Design Effects. ... 49
Estimation Procedure. ... 49
Design Effects for NELS:88. ... 50
Design Effects and Approximate Standard Errors. ... 53
References. ... 56
APPENDICES
Appendix 1: Standard Errors and Design Effects for Student Questionnaire Data Appendix 2: Standard Errors and Design Effects for Parent Questionnaire Data ...
Appendix 3: Standard Errors and Design Effects for School Questionnaire Data ...
57
73
89 Base Year Sample Design Report
3.2 3.2.1 3.2.2 3.2.3
4
4.1 4.2 4.3 5 5.1
5.2
5.3
Base Year Sample Design Report
Exhibits
Figure 1-1 Development of Key Research Issues. ... 2
Figure 2-1 Number and Percentage of Students Who Fall int
Excluded Categories... 9
Table 2.3. Number of Schools in Sample Frame and Number
of Schools Sampled by Sampling Strata. ... 14
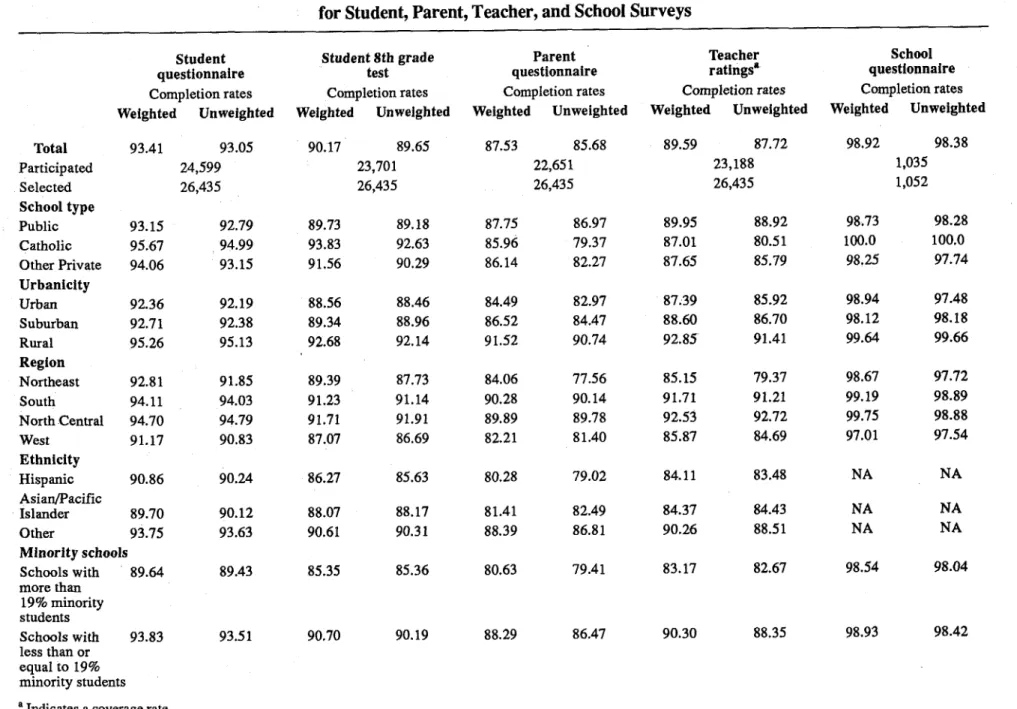
Table 2.8 -1 Summary of NELS:88 Completion Rates. ... 21
Table 2.8-2 NELS:88 Base Year School Sample Selection and Realization. .... 21 Table 2.8-3 NELS:88 Base Year Completion Rates by Sample
Eligibility for Student, Parent, Teacher, and School Surveys. ... 23 Table 2.8-4 NELS:88 Base Year Completion Rates by Sample Selection
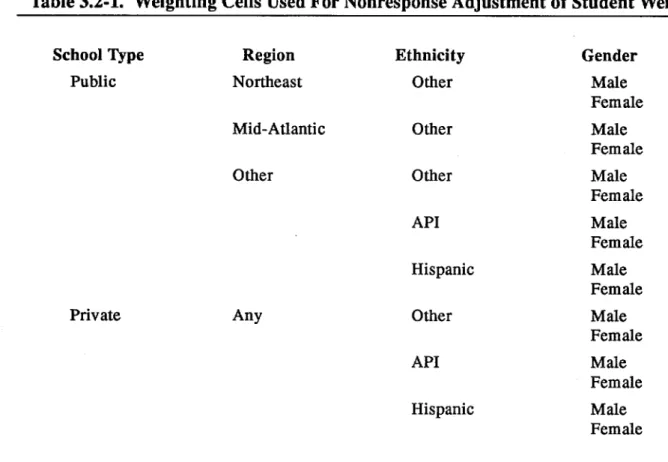
for Student, Parent, Teacher, and School Surveys. ... 24 Table 3.2-1 Weighting Cells Used for NonresponseAdjustment
of Student Weights. ... 31
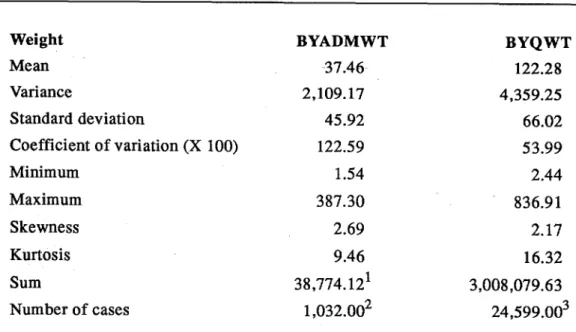
Table 3.2-2 NELS:88 Base Year Statistical Properties of
Sample Case Weights. ... 32
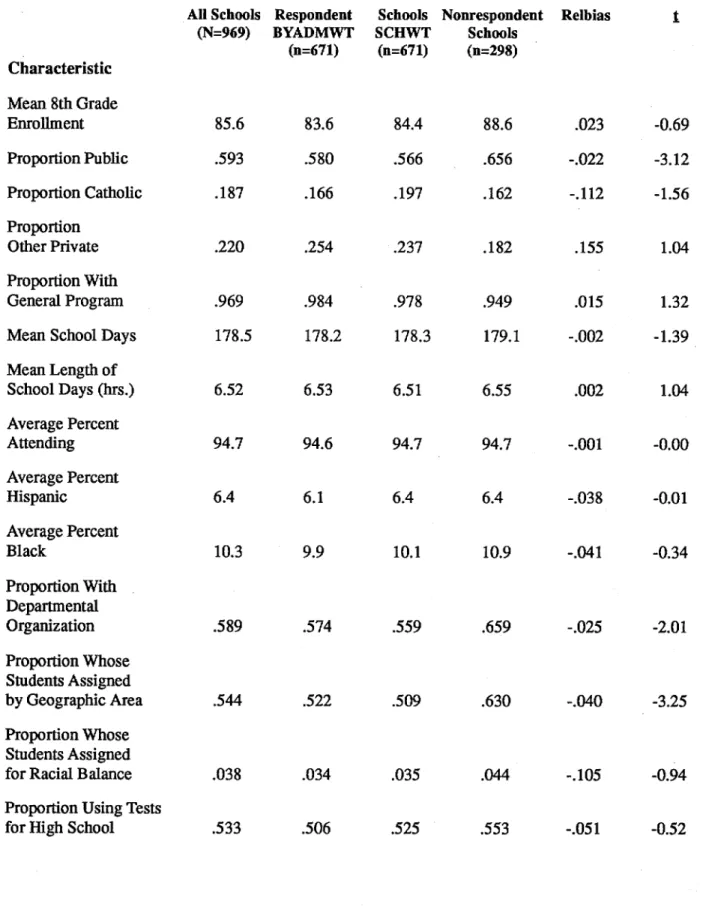
Table 4.2-1 School Nonresponse Bias Estimates. ... 37
Table 4.2-2 Frequency Distribution of Unsigned Relative Estimates. ... 38 Table 4.3-1 Statistics on Proportion Nonresponding by
Various Item Characteristics. ... 41
Table 4.3-2 Average Proportion Nonresponding to Critical Items. ... 44
Table 4.3-3 Nine Items with the Highest Nonresponse Rates. ... 45
Table 4.3-4 Proportion Nonresponding to Nine Items with Highest
Nonresponse Rates by Selected Student Characteristics. ... 46 Table 4.3-5 Average Number of Items Not Attempted on
Four Cognitive Tests by Selected Student Characteristics. ... 48 Table 4.3-6 Speededness Indices for Test by Racial/Ethnic
and Sex Groups (Percent of Sample Who Reached Last Item). ... 48 Table 5.2-1 Mean Design Effects and Root Design Effects
for Student Questionnaire Data. ... 51
Table 5.2-2 Mean Design Effects and Root Design Effects
for Parent Questionnaire Data. ... 52
Table 5.2-3 Mean Design Effects and Root Design Effects
Base Year Sample Design Report
1.
Introduction
The National Education Longitudinal Study of 1988 (NELS:88) base year survey was con-ducted during the winter, spring, and summer of 1988. This report provides information that fully documents major technical aspects of the sample selection and implementation, describes the weight-ing procedures, examines the possible impact of nonresponse on sample estimates, and evaluates the precision of estimates derived ftom the sample.
1.1 Overview of the National Education Longitudinal Study of 1988 1.1.1 NCES's Longitudinal Studies Program
The U.S. Department of Education's National Center for Education Statistics (NCES) is man-dated to "collect and disseminate statistics and other data related to education in the United States"
and to "conduct and publish reports on specific analyses of the meaning and significance of such sta-tistics" (Education Amendments of 1974-Public Law 93-380, Tidle V, Section 501, amending Part A of the General Education Provisions Act).
Consistent with this mandate and in response to the need for policy-relevant, time-series data on nationally representative samples of elementary and secondary students, NCES instituted the Na-tional Education Longitudinal Studies (NELS) program, a continuing long-term project. The general
aim of the NELS program is to study the educational, vocational, and personal development of stu-dents at various grade levels, and the personal, familial, social, institutional, and cultural factors that may affect that development. The NELS program currently consists of three major studies: The Na-tional Longitudinal Study of the High School Classof 1972 (NLS-72), High School and Beyond (HS&B), and the National Education Longitudinal Study of 1988 (NELS:88). Figure 1-1 illustrates the increasing number of issues that have become part of NCES 's National Education Longitudinal Studies research agenda. A brief description of these studies is followed by a review of NELS:88. 1.1.2 The National Longitudinal Study of the 1970s (NLS-72)
The first of the NELS projects, the National Longitudinal Study of the High School Class of 1972 (NTLS-72), began in the spring of 1972 with a survey of a national probability sample of 19,001 seniors from 1,061 public, private, and church-affiliated high schools. The sample was designed to be representative of the approximately three million high school seniors in more than 17,000 schools in the spring of 1972. Each sample member was asked to complete a student questionnaire and a 69-min-ute test battery. School administrators were also asked to supply survey data on each student, as well as information about the school's programs, resources, and grading system. At the time of the first fol-low-up, an additional 4,450 students from the class of 1972 were added to the sample. Five follow-ups, conducted in 1973, 1974, 1976, 1979, and 1986 have been subsequently completed. For the Fifth Follow-Up a subsample consisting of 14,489 of the 22,652 students who participated in at least one of the five previous waves were interviewed.
In addition to background information, the NLS-72 base year and follow-up surveys collected data on respondents' educational activities, such as schools attended, grades received, and degree of satisfaction with their educational institutions. Participants were also asked about work experiences, periods of unemployment, job satisfaction, military service, marital status, and children. Attitudinal information on self-concept, goals, participation in political activities, and ratings of their high schools are other topics for which respondents have supplied information.
Figure 1-1.--Deveiopment of Key Research Issues
[Preparation
for
adult roles
Work related activities
servce
scholig
formation
HS&B
Effective
NELS:88
Language minority (Hispanics)
Friendship networks
Twins and siblings
Mahand science programs
Laguge minority (Hipanics/Asians)
Transition to high school
groups
NLS-72
Goals and aspirations
I MoMMEM
Base Year Sample Design Report
1.1.3 High School and Beyond of the 1980s (HS&B)
The next major longitudinal study sponsored by NCES was High School and Beyond
(HS&B). HS&B was initiated in order to capture changes that had occurred in educational and social conditions, federal and state programs, and needs and characteristics of students since the time of the earlier survey. Such changes have been particularly prominent over the succeeding decade and are clearly continuing. Thus, HS&B was designed to maintain the flow of educational data to policy mak-ers at all levels who need to base their decisions on information that is reliable, relevant, and current.
Base year data collection was conducted in the spring of 1980. As in NLS-72, students were selected using a two-stage probability sample with schools as the first-stage units and students within schools as the second-stage units. There were 1,015 public, private, and church-affiliated secondary schools in the sample and a total of 58,270 participating students (sophomores and seniors). Unlike NLS-72, HS&B cohorts included both tenth graders and twelfth graders. Since the base year data col-lection in 1980, three follow-ups of the HS&B cohorts have been completed, one in the spring of 1982, one in the spring of 1984, and the last in the spring of 1986.
1.1.4 National Education Longitudinal Study of 1988
The National Education Longitudinal Study of 1988 (NELS:88) is the most recent in a series of longitudinal studies conducted by the National Center for Education Statistics (NCES) at the U.S. Department of Education. As in the preceding studies, students were selected using a two-stage proba-bility'sample with schools as the first-stage units and students within schools as the second-stage units. The NELS:88 survey obtained participation from 1,057 public, private, and church-affiliated secondary schools and 24,599 participating students. Similar to the previous longitudinal education studies, NELS:88 begins with a baseline assessment of school experiences, with the purpose of relat-ing these experiences to current academic achievement and to later achievement in school and in life. However, NELS:88 has been designed with a number of enhancements that will increase the analysis and policy-informing potential of the NELS:88 data.
Like the two preceding longitudinal studies conducted by the NCES, the National Longitudinal Study of the High School Class of 1972 and the High School and Beyond study of the 1980 sophomore and senior cohorts, NELS:88 examines school experiences of a national probability sample of stu-dents. Unlike the two previous studies, NELS:88 begins with a survey of eighth graders. This focus, combined with a series of planned follow-up surveys of the NELS:88 sample, will enable a longitudi-nal data base to be created that will give researchers the opportunity to study the ways eighth grade ex-periences affect high school performance and relate to high school completion. Because the majority
of students who drop out are still enrolled in school during the eighth grade, the NELS:88 base year survey will also provide researchers with baseline data for a representative sample of the majority of future high school dropouts in this age cohort. Representativeness of the NELS:88 student
sample--Base Year Sample Design Report
hence also comparability to the High School and Beyond and NLS-72 samples--will be main-tained by sample "freshening" in the first (1990) and second (1992) follow-ups of NELS:88.
The NELS:88 base year survey comprises four components. First, the study examines charac-teristics of the school itself, providing data on admissions and academic policies, school climate, and teacher and student composition. Second, the study examines students' school experiences, both in terms of their own reports and in terms of repo rts of teachers. The teachers' reports contain substan-tial detail about classroom instructional practices. Finally, the study provides data on the student's
family and home experiences. This is done first by obtaining students' reports but is supplemented and enhanced by interviewing parents. Whidle the previous longitudinal education studies have ob-tained some inform-ation from teachers and parents for subsamples of students, NELS:88 provides ex-tensive information from these sources for all students.
1.2 Overview of Chapters 2 through 5
Chapter 2 summarizes the base year sample selection procedures, including procedures for oversampling, stratification, and sample allocations. Chapter 3 describes the calculation of sample case weights that adjust for differential probabilities of selection and for nonresponse within weight-ing cells.
Chapter 4 examines the possible impact of survey nonresponse, a potential source of bias. The amount of bias depends on the proportion of nonrespondents and the magnitude of any difference between respondents and nonrespondents on variables of interest. Often in surveys it is impossible to estimate accurately the amount of bias because, although the proportion of nonrespondents is known, there is usually no satisfactory way to estimate the difference between respondents and
non-respondents. Fortunately, we were able to collect background information on a substantial proportion of noriresponding base year schools, providing a basis for studying the impact of school nonresponse.
Chapter 4 provides the details for this analysis. We also report extensive item nonresponse analysis for the student questionnaire and cognitive tests. Because item nonresponse on the teacher and school
1 While most NELS:88 eighth graders will be in tenth grade in 1990, it should be noted that some students who were in the eighth grade in 1988 will not be in school in 1990, while oilier 1988 NELS:88 eighth graders will be in a grade other than the tenth grade in the spring of 1990. Moreover, the population of students enrolled in the tenth grade in 1990 contains students who were not in the eighth grade in 1988. Sample freshening will give 1990 tenth graders who were not in the eighth grade in 1988 some chance of selection into the NELS:88 first follow-up survey, so that the first follow-up sample may represent tenth grade students in the United States in the 1989- 1990 schoolyear. A four step freshening procedure will be used to ensure that a valid probability sample of all students enrolled in the tenth grade in 1990 is achieved: 1) For each school that contains at least one base year tenth grade student selected for interview in 1990 a complete alphabetical roster of all tenth grade students will be obtained; 2) An examiination will be made of the student immediately following the selected base year student on the roster, If the base year student is last on the roster, the examination will be undertaken for the first student on the roster; 3) If the student designated for examination is enrolled in the eighth grade in the United States
in 1988 the process will terminate for that school. If the designated student is not enrolled in eighth grade he or she will
become part of the freshened sample; 4)11 a student is added to the freshened sample step 3 will be applied to the next student listed on the roster. The step 3 and 4 sequence will be repeated (and students added to the sample) until a student who was in the eighth grade in the United States in 1988 is reached on the roster. Assuming that the tenth grade rosters are complete, this method wrnl generate a probability sample of tenth grade students who were not enrolled in the eighth grade in the United States in 1988. The procedure explicitly 'links" each tenth grade student not in the eighth grade in 1988 with one and only one student who was in the eighth grade in 1988. Thus students in the former population have a known non-zero probability of selection, a probability sample of the elements (students) of this population is achieved, and a 'freshening" sample is obtained to add to the NELS:88 eighth grade cohort sample members who have been followed in 1990.
Base Year Sample Design Report administrator questionnaires was extremely low (typically around 1 percent), we did not undertake an analysis of it. We do, however, report summary nonresponse statistics for the parent questionnaire.
Chiapter 5 describes procedures for computing sampling errors and design effects. Because it is clustered, stratified, and disproportionately allocated, the NELS:88 base year sample presents some special difficulties in estimating sampling errors. Chapter 5 discusses the approach NORC has taken to solve this problem. Sampling errors and design effects are presented for a number of variables for both the entire sample and for important domains or subgroups. Finally, several "rules of thumb" are offered for estimating standard errors under various circumstances.
Base Year Sample Design Report
2.
Sample Design and Implementation
2.1 Base Year Survey Sample Design
The sample design for NELS:88 is similar in many respects to the designs used in the two prior studies of the National Education Longitudinal Studies Program, the NLS-72 and High School and Beyond. The principal difference between NELS:88 and these other two studies is that in its base year NELS:88 sampled a cohort of eighth graders rather than high school students. Included in the NELS:88 sample is a supplementary sample of Hispanic and Asian/Pacific Islander students (and their parents and teachers) sponsored by the Office of Bilingual Education and Minority Language Affairs (OBEMLA). A few states contracted separately to supplement the NELS:88 sampled schools in their state with additional schools for the purpose of obtaining reliable state estimates. In describing the sampling it is sometimes necessary to refer to these schools in this document even though most of these additional schools are not represented in the public use data files. When these additional schools are mentioned, they will be referred to as "augmentation schools" or "state sample augmenta-tions".
In the base year survey of NELS:88, students were sampled through a two-stage process. First, stratified random sampling and school contacting resulted in the identification and contacting of
1,655 eligible public and private schools from a universe of approximately 40,000 schools containing eighth grade students (see chapter 2 for a discussion of school eligibility and for a discussion of how sampled schools were divided into primary and secondary, or backup, sampling pools). Of the eligi-ble schools contacted, 1,057 participated in the survey. A full discussion of the sampling plan and
re-sponse rates is presented in chapters 2 and 3. The principal, headmaster, or headmistress of each of these schools was asked to provide school-level information for the school-based component of the
survey. The second stage included random selection of about 26 students per school (on average, 24
regularly sampled students and 2 OBEMLA supplement Hispanic and Asian/Pacific Islander students) from these cooperating schools. The number of students sampled in each school ranged from 1 (6 schools) to 73 (1 school). Owing to the greater representation of small private schools, and to the im-pact of a within-school strategy of oversampling Hispanics (and Asians), there is considerably greater variability in within-school sample size in the NELS:88 base year sample than in the HS&B base year sample.
The target population for the base year consisted of all public and private schools containing eighth grades in the fifty states and District of Columbia. Excluded from the NELS:88 sample are Bu-reau of Indian Affairs (BIA) schools, special education schools for the handicapped, area vocational schools that do not enroll students directly, and schools for dependents of U.S. personnel overseas. The student population excludes students with severe mental handicaps, students whose command of the English language was not sufficient for understanding the survey materials (especially the cogni-tive tests), and students with physical or emotional problems that would make it unduly difficult for them to participate in the survey.
2.1.1 Exclusions From the Sample
Exclusion of students. To better understand how excluding students with mental handicaps, language bafflers, and severe physical and emotional problems affects population inferences, data
Base Year Sample Design Report Seven ineligibility codes defining categories of excluded students were employed at the time of student sample selection:
A - attended sampled school only on a part-time basis, primary enrollment at another
school.
B - physical disability precluded student from filling out questionnaires and taking tests.
C- mental disability precluded student from filling out questionnaires and taking tests. D - dropout: absent or truant for 20 consecutive days, and was not expected to return to
school.
E - did not have English as the mother tongue AND had insufficient command of
English to complete the NELS:88 questionnaires and tests. F - transferred out of the school since roster was compiled. G - was deceased.
The desi gnation of students as ineligible could occur either before sampling or after sampling but before or on survey day.
Before sampling, school coordinators were asked to examine the school sampling roster and annotate each excluded student's entry by assigning one of the exclusion codes. Because eligibility decisions were to be made on an individual basis, special education and Limited English Proficiency (LEP) students were not to be excluded categorically. Rather, each student's case was to be reviewed to determine the extent of limitation in relation to the prospect for meaningful survey participation. Each individual student, including LEPs and physically or mentally handicapped students, was to be designated eligible for the survey if school staff deemed the student capable of completing the NELS:88 instruments, and excluded if school staff judged the student to be incapable of doing so. School coordinators were told that when there was doubt, they should consider the student capable of participation in the survey. Exclusion of students after sampling occurred either during the sample up-date or on survey day. Such exclusion after sampling normally occurred because of a change in stu-dent status (for example, transfer or death) although in rare instances such exclusions reflected be-lated recognition of a student's pre-existing ineligibility.
Regardless of when an exclusion designation occurred, excluded students were divided into those who were full-time students at the school (categories B, C, and E) and those who were not (cate-gories A, D, F, & G). Our main concern here is with students who were full-time students at the school but were excluded from the sample, because excluding these students may have an effect upon estimates made from the sample. Students in categories A (n=-329), D (n--733), F (n=-3,325), and G (n=6) were either not at the school or were present only part time (with primary regristration, hence a chance of selection into NELS:88 associated, at another school). Thus excluding them has no implica-tions for making estimates to the population of eighth grade students. It should be noted that students in category F, those who had transferred out of the sampled school, had some chance of being selected into the sample if they transferred into another NELS: 88 sampled school just as transfers into
NELS: 88 schools from non-NELS:8 8 schools had a chance of selection, at the time of the sample up-date. The sampling of transfer-in students associated with the sample update allowed us to represent transfer students in the NELS:88 sample. It should also be noted that a follow-up study NORC con-ducted of the students designated as dropouts by the school coordinators suggested that most of the
Base Year Sample Design Report
students originally designated as dropouts had actually transferred to another school (for details, see Appendix E of the NELS:88 Base Year: Student Component Data File User's Manual). 2Thus, as in the case of students properly designated as transfers out, all but the 29 true dropouts (as identified by the NORC dropout study) had a chance of being selected into the sample.
Figure 2-1 gives the number and percentage of students who fall into each of the three exclu-sion categories (B, C, and E) that may have implications for estimates drawn from base year sample
and subsequent study waves.
The total eighth grade enrollment for the NELS:88 sample of schools was 202,996. Of these students, 10,853 were excluded owing to limitations in their language proficiency or to mental or physical disabilities. Thus 5.35 percent of the potential student sample (the students enrolled in the eighth grade in the 1,052 NELS :88 schools from which usable student data were obtained) were ex-cluded. Less than one half of one percent of the potential sample was excluded for reasons of physi-cal or emotional disability (.41 percent), but 3.04 percent was excluded for reasons of mental disabil-ity, and 1.90 percent because of limitations in English proficiency (we estimate that this is about 45 percent of the total number of LEP students in the schools).
Put another way, of the 10,853 excluded students, about 57 percent were excluded for mental disability, about 35 percent owing to language problems, and less than 8 percent because of physical or emotional disabilities. Because current characteristics and probable future educational outcomes for these groups depart in many ways from the national norm, the exclusion factor should be taken into consideration in generalizing from the NELS:88 sample to eighth graders in the nation as a whole. This implication for estimation carries to future waves. For example, if the overall propensity to drop out between the eighth and tenth grades is twice as high for excluded students as for non-ex-cluded students, the dropout figures derivable from the NELS:88 First Follow-Up (1990) study would underestimate these early dropouts by about ten percent.
It should be noted that in a school-based longitudinal survey, such as NELS:88, excluded stu-dents have a second implication for future waves, in addition to their possible impact on estimation. To achieve a thoroughly representative tenth grade (1990) and twelfth grade (1992) sample compara-ble to the High School and Beyond 1980 sophomore cohort (or, for 1992, the HS&B 1980 senior
co-hort and the base year of NLS-72), the follow-up samples must approximate those which would have come into being had a new baseline sample independently been drawn at either of the later time points. In 1990 (and 1992) one must therefore freshen, to give "out of sequence" students (for exam-ple, in 1990, those tenth graders who were not in eighth grade in the spring of 1988) a chance of selec-tion into the study. But also one should ideally accommodate excluded students whose eligibility sta-tus has changed--for they too (with the exception of those who fell out of sequence in the progression through grades) would potentially have been selected had a sample been independently drawn two years later, and must have a chance of selection if the representativeness and cross-cohort comparabil-ity of the follow-up sample is to be maintained. Thus, for example, if a base year student excluded be-cause of a language barrier achieves the level of proficiency in English that is required for completing the NELS:88 instruments in 1990 or 1992, that student should have some chance of re.-entering the sample. It is planned, subject to availability of funds, to follow a substantial subsample of the base
2 Ingels. S.J. et al. National Education Longitudinal Study of 1988 (NELS:88) Base Year:- Student Component Data File
Figure 2-1.--Number and Percentage of Students Who Fall into Excluded Categories
Non-excluded
94.65%
Excluded (10,853)
Physical disability 0.41% (840) Mental disability
3.04% (6,182)
Language problem 1.90% (3,831)
Base Year Sample Design Report
year ineligibles in the NELS:88 first and second follow-ups, and to reassess their eligibility sta-tus and gather information about their demographic characteristics, educational paths, and life outcomes. Data on persistence in school to be obtained from this subsample will be used to de-rive an adjustment factor for national estimates of the eighth grade cohort's dropout rates be-tween spring of 1988 and spring of 1990, and later, bebe-tween 1990 and 1992.
Exclusion of schools. Just as certain students were considered to be ineligible, so too certain kinds of schools were ineligible for selection. The eligible populations of schools are restricted to
"1regular" schools in the U.S., private as well as public. Excluded from the sample are Bureau of In-dian Affairs (BIA) schools, special education schools for the handicapped, area vocational schools that do not enroll students directly, and schools for dependents of U.S. personnel overseas. Addition-ally, a sample list school was considered ineligible if the school no longer existed (closed or merged) or did not enroll any eighth grade students in the spring. term of 1988. Most of the sample list schools declared ineligible were schools that had closed or were small, private schools that had no eighth grad-ers enrolled in the spring of 1988. Finally, a school was ineligible if it had opened its door after the final sampling frame was constructed. 3 The number of schools in this category is likely to be small.
We believe that these exclusions will not have a large impact on estimates made from the cur-rent NELS:88 sample. Information from various sources suggests that approximately 90 percent of American Indian school children attend schools not affiliated with BIA (by "affiliated" we mean schools directly operated by BIA and those operated by American Indian communities under contract to BIA). Investigators should take this degree of undercoverage into account when attempting popula-tion estimates. If this group is substantially different fromi American Indian eighth graders not attend-ing BIA schools a substantial bias in estimates may result.
Other sources suggest that fewer than 10,000 eighth graders attended Department of Defense Dependent Schools (DODDS) sewving dependents of U.S. personnel overseas in the 1987-8 8 school year. This estimate suggests that fewer than .3 percent of all eighth graders are in DODDS schools. To the extent that these students resemble the general eighth grade population in the 1987-88 school year, the rate of undercoverage is not alarming. To the extent that certain characteristics are dis-proportionately represented in DODDS students, the undercoverage problem becomes more serious. 'However, since such a small number of students fall into this group, the undercoverage is not likely to result in serious bias in population estimates unless the DODDS students are extremely homogeneous on certain important education-related characteristics, and these characteristics occur rarely among other eighth graders. It should be noted that DODDS students who returned to the U.S. between spring of 1988 and autumn of 1989 and who are enrolled in tenth grade during the 1989-90 school year, have a chance of selection into the NELS:88 First Follow-up survey through sample "freshen-ing".
Of course, students who are educated at home or in private tutorial settings, and those who have dropped out of school before reaching the eighth grade, also fall outside the NELS:88 base year
sample. The size of the pre-&3rade 8 dropout population in winter-spring 1988 is uncertain. The Na-tional Center for Education Statistics has recently reported that 12 percent of dropouts ages 16-24 in 1988 had completed six or fewer years of school (Frase, 1989). However, over 31 percent of Hispa-nic. dropouts age 16-24 had completed only six, or fewer, years of schooling. This finding both
Base Year Sample Design Report firms the fact that there is a sizable group of students who leave school before entering eighth grade, and suggests that the biasing effect of this phenomenon on NELS:88 data may be much more pro-nounced for some subgroups than others. Any of the school-level exclusions may have implications for national inferences based on NELS data, although their impact on such estimates is generally ex-pected to be small.
Minimizing NAEP/NELS Building-Level Overlap. In order to minimize burden to
individ-ual participating schools and protect response rates for both studies, the NELS:88 core sample was de-signed to minimize the overlap with the NAEP sample for the 1987-88 school year. To accomplish this goal, the selection of the NELS:88 schools involved a two-phase process. The first phase was the NAEP selection. Any schools that were not selected for NAEP were eligible for NELS:88 selection and any schools that were selected for NAEP were not eligible for NELS:88 selection. In principle, then, no school was eligible for selection in both surveys. Exceptions to this principle could have oc-curred in practice because not all of the schools originally selected for NAEP agreed to participate, and therefore substitute schools were selected. While NORC was able to eliminate the originally se-lected NAEP schools from the NELS: 88 sample, it was not able to screen out NAEP substitute schools.
Substitutions. Additional sample selections within superstrata were made for schools that
re-fused to participate in NELS:88. No additional selections were made for students who, for whatever reason; failed to participate. Each school (and student) was assigned a weight equal to the inverse of the unit's selection probability. The derivation of student case weights is discussed below. Use of weights properly projects estimates (within sampling error) to the population of eighth grade schools and eighth grade students in United States schools in the 1987-1988 academic year, and for specific subgroups within that population.
The current weights give estimates reasonably close to those from other data sources. For ex-ample, the 1989 Digest of Education Statistics estimates the fall 1987 public school eighth grade en-rollment to be 2,838,671. The estimate derived from the NELS:88 data by summing the nonresponse-adjusted student weight for respondents in public schools is 2,633,959. The 6.9 percent underestimate can be accounted for by the fact that the NELS: 88 sample excluded certain classes of ineligible dents. While the overall ineligibility rate is around 5.4 percent for the entire sample, ineligible stu-dents were proportionally more likely to be found in public schools than in private schools; therefore, the ineligibility rate for public schools is expected to be higher than the overall rate.
The Current Population Survey Report No. 429 estimates the total number of eighth graders in public and private schools in 1986 to be 3,235,000 students, composed of 1,679,000 male and
1,556,000 female students. This is reasonably close to the corresponding NELS:88 estimates of 3,008,080 students, 1,507,074 males and 1,501,005 females. Once again, the discrepancy can be ac-counted for fairly well by the excluded students, because males are generally known to be dis-proportionately represented in the specified population.
2.2 Sampling Frame
In designing a sample frame, one can use either an explicit or an implicit list of the elements to be sampled. For NELS:88, the creation of an explicit list of all eighth grade students in the U.S. would have been an impossible task. NORC therefore elected to use an implicit list of students by using a list of public and private schools in the U.S. It was important that the list of schools be com-plete and accurate and have comcom-plete data for variables to be used in the subsequent stratification.
Base Year Sample Design Report
Investigation of various sources indicated that the most readily available source for a com-plete and accurate frame was the data base compiled by Quality Education Data, Inc. (QED) of Den-ver, Colorado. The data base includes both public and private (parochial and non-parochial) schools.
QED performs annual, late-summer updates by telephoning each public school district, each Catholic diocese, and all private schools on its records. In addition, QED frequently receives updated informa-dion from agencies such as the National Catholic Educational Association (NCEA), the Council of
American Private Education (CAPE), the Association of Christian Schools, and others, regarding school openings and closings, enrollments, and so forth. The QED records were successfully em-ployed in the five-state field test and proved highly accurate. The number of eighth-grade students at-tending schools not included in the QED lists is estimated by QED, Inc. to be less than 1 percent and
comprised mostly of a small number of schools that had opened after a particular data file was created and released, and a small number of home schools in rural areas. An analysis undertaken by NORC comparing the QED files with files from Department of Education's Common Core of Data (CCD) showed a very high correspondence between the files both in the public schools listed and their characteristics.
The QED data base contained Census information about whether a school's location was urban, suburban, or rural. NORC used this informnation for stratification purposes. The QED list did not contain information about the racial/ethnic composition of public schools usable for constructing the NELS:88 sampling frame. NORC obtained racial/ethnic composition data (on public schools only) from Westat, Inc., a subcontractor for the NELS:88 survey. As part of another federal contract (the National Assessment of Educational Progress, NAEP), Westat had obtained data from the Office of Civil Rights (OCR) and from other sources (e.g., district personnel) that indicated those public schools with a combined black and Hispanic enrollment of greater than 19 percent. The schools for which the OCR data were available tended to be large schools in large SMSAs.
Westat also obtained black and Hispanic percentages directly from district personnel in public school districts that, according to the QED list, had large proportions of black or Hispanic students. These data were compiled only for public schools in the primary sampling units of the Year- 17 NAEP survey. In all, less than half of the eighth-graders in the NELS:88 frame came from schools for which such racial composition data were available. However, this partial data allowed NORC to create sam-pling strata containing public schools with very large percentages of black or Hispanic students. In
addition, data from the QED list allowed identification for stratification purposes of schools as public, Catholic (private), or other private. The stratification procedures are discussed in more detail in the following sections.
2.3 Stratification
The sampling frame was sorted in such a way as to create groups of schools, called strata, that were contiguous on the frame. Each stratum contained schools that were relatively similar in termis of certain variables deemed relevant to the survey's objectives (public/private, region, urbanicity, and percent minority). The actual selection of schools occurred independently within each stratum.
Schools were stratified by superstrata and substrata. First, schools were sorted into combina-tions of school type and geographic region (superstrata). Next, substrata were formed according to values on an urbanization variable, (i.e., whether the location of a school was urban, suburban, or
rural), and according to the minority classification mentioned previously; minority substrata were not created for private schools. Finally, within substrata schools were sorted in order of their estimated
Base Year Sample Design Report
eighth grade enrollment. The sort order alternated between ascending and descending from one sub-stratum to the next.
In the following tables and on the data tape, the divisions that comprise the public and private schools' superstrata are the same as those used by the Census Bureau. During sample construction, however, nine large states constituted nine of the individual public school superstrata. Similarly, one private school stratum was comprised entirely of schools in one state. Because Public Law 100-297 mandates the protection of respondents to NCES surveys from the risk of disclosure, including disclo-sure through statistical means, the public use data file collapses schools in these strata into their re-spective census division strata and completely suppresses information on substrata. This collapsing of strata will lead to standard errors being slightly overstated when CTAB, or other programs that ac-count for the sample design, are used to calculate or approximate standard error estimates. 4Table 2.3 shows the number of schools in the sampling frame and the number of schools sampled for each of the strata reported in the public use data file. It should be noted that a certain percentage of schools were found to be ineligible after they were sampled-and contacted. These schools were excluded from the sample (see section 2.1.1 for a discussion of excluded schools) and were replaced with schools from an additional pool of schools sampled to accommodate such occurrences. The numbers in Table 2.3 do not reflect these schools. However, subsequent descriptions of the sample do account for the ineligible schools, which is why the number of schools reported in subsequent tables differs slightly from the numbers reported here.
2.4 Allocation of Numbers of Schools to Be Sampled
The number of public schools to be selected for the core sample from each su perstratum was set to be proportional to the aggregate estimated eighth grade enrollment of all the schools in that su-perstratum. For this calculation, the eighth grade enrollment in each school was estimated by dividing the enrollment figure from the QED list by the number of grades in the school; this procedure implic-itly assumes an equal number of students in each grade in the school. The allocation of the sample size to substrata within the public school superstrata. was proportional to the sum of a measure of size (MOS) of the schools in the substrata. The calculation of the measure of size is discussed in section 2.5; the measures of size were proportional to the eighth grade enrollments.
The determination of the numbers of schools to be selected from each of the private strata re-flected a compromise between competing analytic needs. Private schools as a whole were
over-sampled relative to public schools. Policy analysts are particularly interested in certain types of pri-vate schools, and oversampling these types has the obvious benefit of increasing the number of cases available for analysis, but at the cost of decreased precision for statistics based on the other types of private schools. The allocation was designed to give policy analysts the minimum numbers of schools necessary for their work, while not deviating too far from allocation proportional to eighth grade en-rollment, so that statistics based on all types of private schools would not lose too much precision.
4 CTAB is the name of a program designed to calculate standard errors for two-stage cluster samples. See Carroll, C. Dennis, (October, 1988). Tabulation Routines for Means and Percentages with Taylor Standard Error Estimates. Washington, D.C., National Center for Education Statistics, PC Software Documentation.
Base Year Samnple Design Report
Table 2.3. Number of Schools in Sample Frame and Number of Schools Sampled by Sampling Strata
Public Schools
N.E./Mid-Atlantic E. North Central W. North Central
South Atlantic E. South Central
W. South Central
Mountain Pacific Total Public
Schools in Frame Schools Sampled
3,650 273
4,101 224
3,217 100
2,604 225
1,976 91
2,994 168
1,629 76
2,647 193
. ... 22,818. ... 1,350
Private Schools
Catholic, Suburban/Rural
Northeast North Central South
West
Catholic, Urban
Northeast North Central South
West
Other Private
Schools in Frame Schools Sampled
1,233 1,762 539 521
33 32 10 9
515 1,450 569 362
17 28 11 6
Northeast 1,072
North Central 3,038
South 2,808
West 2,179
Total Private. ... 16,048
Total (Public and Private) . . 38,866
69 52 71 46 * 384
Base Year Sample Design Report 2.5 Selection of Schools within Strata
A sample design objective was that each student sampled from the selected schools would
have an equal chance of selection. To accomplish this, a measure of size (MOS) was calculated for each school that was not selected by NAEP:
MOS = F * G * maxf 24, G8 enrollment}. (1)
Schools selected by NAEP had MOS set to zero. The MOS was equal to an adjustment factor, F, times another factor, G, times the maximum of 24 (which was the desired number of regular
stu-dents per school to be sampled) or the estimated eighth grade enrollment of the school. The factor F varied from school to school and was designed to adjust for the fact that NAEP did not select schools with equal probability. F was set equal to the reciprocal of 1-P, where P was set equal to each
school's probability of selection into NAEP,5 ensuring that choosing schools with probabilities
propor-tional to MOS would yield school selection probabilities proporpropor-tional to the estimated eighth grade en-rollments. The latter is desirable because if the school selection probabilities are proportional to the eighth grade enrollments and if 24 students (or all students, if fewer than 24 are enrolled) are to be se-lected at random from each sese-lected school, then all students have equal probabilities of selection. The effect of G is to undersample small private schools where very few students could be sampled. With a fixed school sample size, this has the effect of increasing the number of large other private schools thus increasing the total number of other private students in the sample.
The factor G is present in (1) to ensure that a sufficient number of "other private" school stu-dents are included in the sample. Many of the "other private" schools had estimated eighth grade en-rollments considerably under 24, and if the factor G were not present in (1) then the number of sam-pled students in "other private" schools would be undesirably low. The factor G was set equal to 1 for all schools in all strata except for the superstratumn of "other private" scool. For the schools inth latter superstratumt, G was set equal to 1 if the estimated eighth grade enrollment was 8 or more, and G was set equal to 0.5 if the estimated eighth grade enrollment was less than 8. The selection of the public schools was accomplished using systematic sampling with random starts in each public super-stratum and sampling intervals in each supersuper-stratumn that were proportional to MOS. The selection of the private schools was accomplished using systematic sampling with random starts in each private substratum and with the sampling intervals proportional to MOS. Use of systematic sampling in this way produced the beneficial effect of implicit stratification by estimated eighth grade enrollment within each substratum.
5 For each school, define the following probabilities: P(NELS) = probability of selection into NELS
P(NELS/NAEP) = probability of selection into NELS given selection into NAEP
P(NELS/not NAEP) = probability of selection into NELS given nonselection. into NAEP P = probability of selection into NAEP
Also, let ENROLL denote an estimate of the grade 8 enrollment in the school. Then, P(NELS) = P(NELS/NAEP) * P + P(NELS/not NAEP) * (l-P) Note that P(NELS/NAEP)=-O.
Thus, P(NELS)=P(NELS/not NAEP) * (Il-P)
Base Year Samnple Design Report
2.6 Design Allowance for School Nonresponse
Despite the best efforts of any data collection agency, not all units selected for a survey agree to participate. One problem caused by nonresponse is possible systematic error in statistics calculated from data from just the participating schools (see section 4 for further discussion of systematic error
due to nonresponse). A second problem is a decrease in the size of the sample from which data are ob-tained. To cope with the latter problem NORC drew extra schools in the initial selection process. The extra schools were brought into the sample in order to attain the desired sample sizes despite nonpar-ticipation by some of the schools. The extra schools were chosen at random from the same superstra-tum and substrasuperstra-tum as nonresponding schools. Specifically, the sample drawn was larger than the sample NORC intended to field; schools were randomly assigned to two pools, with pool 1 as the tar-get sample and pool 2 containing backup schools. Our best attempts were made to obtain cooperation from each pool 1 selection, but when cooperation was impossible, an additional school was taken at random from pool 2 from the same superstratum and substratum as the nonresponding school. This procedure had the effect of controlling the number of cooperating schools from each superstratum and substratum.
Schools selected randomly within each substrata were alternately assigned to either pool I or pool 2. That is, each school had an equal chance of being in pool 1 or pooi 2. All of the pool 1
schools were fielded. If the number of responding schools in a stratum was below a prespecified tar-get number (see Table 2.8-2) schools from pool 2 were contacted. It is important to note that not all of the pool 2 schools were fielded. Once the target number of schools within a stratum was obtained, additional pool 2 schools were not fielded. School weights were dervied conditional on the number of pool I and pool 2 schools that were contacted, ignoring the pool to which the school was initially assigned.
Our final sample size consisted of all pool 1 schools and all pool 2 schools from whom eration was requested; pool 2 schools that we did not contact (because we had already obtained coop-eration from a sufficient number of schools in the corresponding superstratum. and substratum) were not counted. That final sample size (adjusted for numbers of ineligible schools) was used as the de-nominator of the unweighted response rate for schools. The sample design weight for each extra (pool 2) school that was brought into the survey was calculated in the same manner as the weights for the pool 1 schools, i.e., as the reciprocal of the selection probability conditional on the final sample size for the school's superstratum. and substratum.
2.7 Selection of Students, Parents, Teachers and School Administrators. 2.7.1 Student Selection.
The basic sampling procedure resulted in the selection of up to 24 students per school, or all of the eighth grade students in the school if they numbered fewer than 24. An additional procedure was implemented to augment this basic sample of 24 students per school with an oversample of Asian-Pacific Islander and Hispanic students. The target was to achieve a total oversample of 2,200 ad-tional students with these ethnic characteristics. The oversampling was done only for those schools that fell into the "core" sample.
The student sampling procedure can be described as follows. First, three lists of eighth grad-ers were obtained from each participating school, one of Asian students, one of Hispanic students, and one of all the other students (see section 2.1.1 for a discussion of determining which students were eli-gible to be sampled and which were excluded from the sample). Second, random samples of Asians,
Base Year Sample Design Report
Hispanics, and others were independently selected from each of the three lists. Sample sizes were cal-culated using the following fonnulae:
nH= (CS *CH * NH/F) + (24 * NH/N), nA = (CS *CA * NA/F) + (24 * NA/N), nO = 24 * NO/N,
where nH, nA, and nO are sample sizes for the sample of Hispanic, Asian, and Other students. NA, NH, and NO denote the numbers of students on the lists of Asians, Hispanics, and others, re-spectively, and N denotes the total number of students on all the lists. F denotes the first-stage selection probability of the school, CA and CH are constants used for the selection of Asian and Hispanic students, and CS is a constant used for the selection of Asian or Hispanic students in stratum S. CA, CH, and CS were constants of proportionality constructed to obtain desired total sample sizes for Asian, Hispanic and other students across schools.
Upper limits on nH and nA were set to ensure that the number of students per school did not get impractically large. The specifications of CS, CA, and CH were empirically determined to ensure that two goals were achieved: (1) sufficient numbers of Asian and Hispanic students were sampled, and (2) selection probabilities did not vary excessively across students. By keeping selection probabil-ities relatively homogeneous across students, design effects were also kept from becoming too large. 2.7.2 Sample Updating
A representative from each school submitted a list of eligible students from which a sample was drawn (see Section 2. 1.1 for criteria used to determine student eligibility). These lists, called school rosters, were submitted and an initial sample was drawn, starting in November of 1987. To ad-just the student sampling frame for student attrition and change in the eighth grade population of the
sampled school, NORC conducted a sample update seven to ten days prior to the school's scheduled survey session. The NORC survey representative went over the sample list with the school coordina-tor to ascertain whether all sampled students were still eligible and to ensure that transfer-ins--that is, any student who had joined the school's eighth grade between the time of original sampling and the time of the update--were added to a supplementary roster from which additional students would be se-lected. The supplementary roster was annotated for eligibility and ethnicity and the transfer-in stu-dents were sequentially numbered. Selections for inclusion in the sample were based on the same set of computer-generated random numbers used to select the original sample and Asianx/Hispanic over-samples for that particular school. Whifle in the High School and Beyond Base Year Survey tions were made for students who were ineligible or had died, there were no student-level substitu-tions in NELS:88.
2.7.3 Selection of Parents
Conceptually, the universe of parents of eighth grade students consisted of all parents or legal guardians of eligible eighth grade students in the winter-spring 1988. The selection of parents thus did not require the construction of a formal universe or list.
One parent questionnaire was sought per student, regardless of whether the student resided in a one- or two-parent household (or joint custody arrangement, in the case of divorced parents of a NELS:88 eighth grader). Once the student sample had been selected, the parent who was "best in-formed" about the child's educational activities was asked to complete a NELS:88 parent
question-Base Year Sample Design Report
naire. The parent questionnaire was delivered by means of an envelope addressed "To the Parents of (Name of Student)" and was accompanied by a letter introducing the study to the parent. Both the let-ter and the instructions printed on the parent survey instrument stressed that "the questionnaire should be completed by the parent or guardian who is most familiar with the student's current school situation and educational plans." The questionnaire packet was initially carried home by the student, who was instructed to give it the parent who was best informed about the student's school situation. In a few cases, schools insisted that the questionnaire be mailed to the home rather than distributed in
school, in which case the packet was again addressed "To the Parents of (NAME OF STUDENT)". Nonresponse follow-up was by mail and telephone for households with telephones and by mail and in person for households lacking telephones. Telephone and in-person interviewer scripts stressed once more the requirement that the initial contact in the household be asked to identify the more
knowl-edgeable parent respondent. Thus, the parent respondent was essentially self-selected, though most certainly the mode of delivery, the screening selection exercised by the eighth grade student, and chance factors created unequal opportunities for self-selection between the two-parent home or be-tween multiple households with dual child custody arrangements.
No effort was made to identify parents who had more than one chance of selection (that is, had more than one child in the eighth grade). After parent and student data had been collected, the parent sample was further restricted to the parents/guardians of participating base year students. Thus parent data from the base year nonparticipants was systematically excluded from the final data file. 2.7.4 Selection of Teachers
All full- and part-time teachers who were teaching classes in mathematics, science, En-glish/language arts, and social studies to eligible eighth graders in the winter-spring of 1988 were in-cluded in the NELS:88 universe of eighth grade teachers. The actual sample was restricted to teach-ers who provided instruction in the four subject areas to the selected sample of eighth grade students within the sampled schools. Thus there was no need to construct a formal universe list of eighth
grade mathematics, science, English and social studies teachers prior to their selection. In cases where the teacher had changed between the autumn and spring terms, the spring term teacher was des-ignated as the preferred respondent. To achieve the objective of "linking information from the teacher to data about individual students in the NELS:88 sample," two teachers were identified as respondents to the teacher questionnaire for each student.
Selection of respondents to the teacher questionnaire for each student was based on the assign-ment of two curriculum areas per school included in the NELS :88 base year sample. Specifically, .each of the sample schools was assigned one of the following combinations of curriculum areas:
* Science and English; • Science and Social Studies;
* Mathematics and English; or * Mathematics and Social Studies.
Each sampled student's current teacher in each of the two designated curriculum areas was se-lected to receive a teacher questionnaire.
The assignment procedure was designed to achieve approximately balanced representation of the four combinations of curriculum areas across the sampling variables of school type and levels of
Base Year Sample Design Report urbanicity and/or minority population. Additionally, there was an attempt to balance assignments within geographical categories and by school size. Finally, the assignment process was intended to
en-sure representation of mathematics or science and English or social studies in all base year sampled schools.
Once the data file listing all sampled schools was compiled, it was sorted in the order of sam-pie selection; that is, by geographical category within school type, then by urbanicity/minority level, by whether the school was selected initially as a sample school or a replacement school, and finally by a measure of size. Next, the four curriculum combination areas were ordered in a random se-quence and the start combination randomly selected. This start combination (mathematics and social studies) was assigned to the first school in the sorted listing, and curriculum combination areas were assigned to the schools in repeating cycles of the sequence (iLe, mathematics and social studies, mathe-matics and English, science and English, and science and social studies).
Following the assignment of curriculum combination areas to sampled schools and the selec-tion of the student sample in a participating school, a matrix of student-subject-teacher informaselec-tion was obtained from school records. A Class Schedule Form used in the teacher-respondent selection process contained 30 rows (one per sampled student) and two columns (one for each assigned curricu-lum area). For each cell in the form, that is, for each student-curricucurricu-lum combination (subject), the following information was entered:
* Class identification (e.g., usually period number or hour); * Course tidle; and
* Name of the student's current teacher in that subject.
In completing the teacher matrix, the school coordinator was asked to report the current teacher, or where there were multiple current teachers, to report the teacher who had the greatest as-signed responsibility for teaching the sampled student. The assignment of subject matter pairs to schools ensured that data were collected from two teachers of each student (assuming more than two teachers for the eighth grade class, and that both the student's teachers chose to participate in the study) and that survey response burden for teachers in the school was limited.
Because of the universality of the four subject mailers in the required curriculum of the eighth grade, virtually all sampled students were enrolled in classes in the assigned subject combination dur-ing some portion of the 1987-8 8 school year. Thus no subject substitution was necessary. However, occasionally, a student was enrolled in more than one spring term class in a particular subject. When this was so, the following decision rule was invoked to determine which class would be entered on the teacher matrix: when there are two or more candidate classes in the same subject for a given student, take the course in which the student will have spent the most class time between the start of school and survey day; if this rule is not sufficient to eliminate all but one of the candidate classes, select the class that involves the most advanced subject matter. Other cases were encountered in which there was more than one teacher for a designated class (for example, team teaching arrangements). In these cases, the teacher with the greatest assigned responsibility (identified from the Class Schedule Form) was chosen to complete the teacher questionnaire.
The use of the this sampling scheme for the NELS:88 base year resulted in the identification of varying numbers of teacher-respondents per participating school, ranging from I to 19, with an av-erage number of 5.5 teachers per school. It should be noted that the resulting NELS:88 base year