DATA USERS GUIDES
1: Digital Line Graphs from 1:24,000-Scale Maps 2: Digital Line Graphs from 1:100,000-Scale Maps 3: Digital Line Graphs from 1:2,000,000-Scale Maps
4: Land Use and Land Cover from 1:250,000- and 1:100,000-Scale Maps 5: Digital Elevation Models
6: Geographic Names Information System 7: Alaska Interim Land Cover Mapping Program
Data Users Guides 1-7 generally replace the Geological Survey Circular 895.
Questions regarding availability and ordering of US GeoData (all types of digital cartographic and geographic data produced and distributed by the U.S. Geological Survey) should be addressed to:
Earth Science Information Center U.S. Geological Survey
507 National Center Reston, Virginia 22092
(703) 648-6045
Technical questions and comments should be addressed to: Branch of Technical Standards
and Product Development U.S. Geological Survey 510 National Center Reston, Virginia 22092
UNITED STATES DEPARTMENT OF THE INTERIOR
U.S. GEOLOGICAL SURVEY
DIGITAL ELEVATION MODELS
__________________________________________________________________________________________ Data Users Guide 5
Reston, Virginia
First printing, 1987 Second printing (revised), 1990
CONTENTS ___________ Page
Introduction... 1
7.5-minute Digital Elevation Models... 2
Characteristics ... 2
Data production... 3
1-degree Digital Elevation Models ... 5
Characteristics... 5
Data production ... 6
30-minute Digital Elevation Models... 7
Characteristics... 7
Data production... 7
15-minute Alaska Digital Elevation Models... 8
Characteristics... 8
Data production... 8
7.5-minute Alaska Digital Elevation Models... 9
Characteristics... 9
Data production... 9
Geometry ... 10
Accuracy ... 10
Classification levels ... 14
Level 1 ... 14
Level 2 ... 14
Level 3 ... 14
Digital Elevation Model caveats ... 15
Data records ... 15
Sample data records ... 16
Sample applications ... 16
Appendix A. Digital Elevation Model data elements-- logical record type A... 29
Appendix B. Digital Elevation Model data elements-- logical record type B... 35
Appendix C. Digital Elevation Model data elements-- logical record type C... 37
Appendix D. Sample quadrilateral coordinates ... 38
Appendix E. Codes for State plane coordinate zones ... 39
Appendix F. Universal Transverse Mercator zone locations and central meridians... 41
Appendix G. Parameters required for definition of map projections... 42
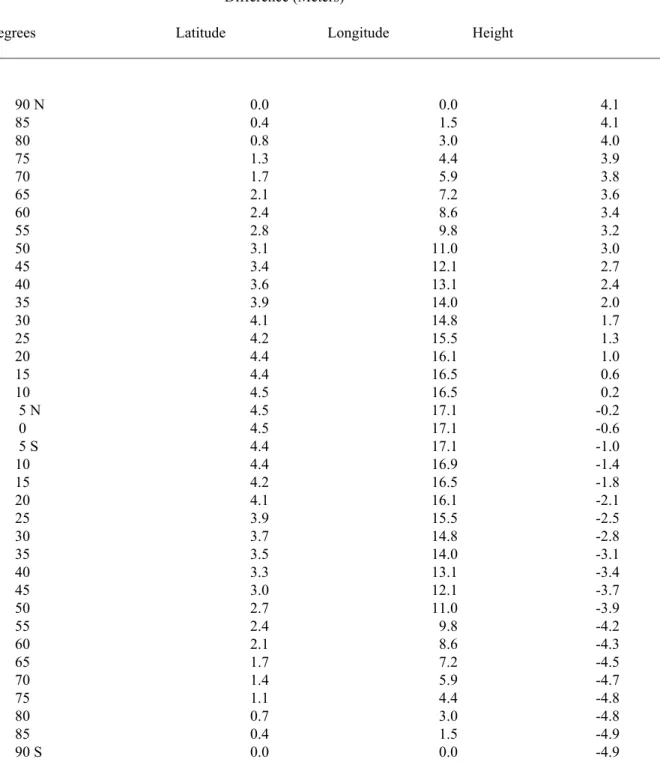
Appendix H. National and international datums used for digital elevation data ... 47
ILLUSTRATIONS __________ Page
Figure 1. Structure of a 7.5-minute Digital Elevation Model,
UTM meter grid ... 4
2. Structure of a 1-degree Digital Elevation Model, arc-second grid ... 6
3. Computation of a first data point in a 7.5-minute Digital Elevation Model west of the central meridian ... 11
4. Computation of first data point in a 7.5-minute Digital Elevation Models east of the central meridian... 12
5. Geometry and nomenclature of the Digital Elevation Models file ... 13
6. Preeruption isometric plot of Mount St. Helens Digital Elevation Models ... 25
7. Posteruption isometric plot of Mount St. Helens Digital Elevation Models ... 25
_________________ TABLES __________ Page Table 1. Sample Digital Elevation Model type A logical records--Mannboro, Virginia, quadrangle (7.5 minute)... 17
2. Sample Digital Elevation Model type B logical records--Mannboro, Virginia, quadrangle (7.5 minute)... 20
3. Sample Digital Elevation Model type C logical records--Mannboro, Virginia, quadrangle (7.5 minute)... 21
4. Sample Digital Elevation Model type A logical records--Reno, Nevada-California,quadrangle (west half) (1 degree) 22
5. Sample Digital Elevation Model type B logical records--Reno, Nevada-California, quadrangle (west half) (1 degree)... 24
DIGITAL ELEVATION MODELS
__________________________________________________________________________________________ ____
INTRODUCTION The Earth Science Information Center (ESIC) distributes digital cartographic/geographic data files produced by the U.S. Geological Survey (USGS) as part of the National Mapping Program. Digital cartographic data files may be grouped into four basic types. The first of these, called a Digital Line Graph (DLG), is the line map information in digital form. These data files include information on base data categories, such as transportation, hypsography, hydrography, and boundaries. The second type, called a Digital Elevation Model (DEM), consists of a sampled array of elevations for a number of ground positions at regularly spaced intervals. The third type is Land Use and Land Cover digital data which provides information on nine major classes of land use such as urban, agricultural, or forest as well as associated map data such as political units and Federal land ownership. The fourth type, the Geographic Names Information System, provides primary information for all known places, features, and areas in the United States identified by a proper name.
The digital cartographic data files from selected quadrangles currently available from ESIC include the following:
• Digital Line Graphs (DLG's)
- 1:24,000-scale
- 1:62,500-scale
- 1:63,360-scale
- 1:100,000-scale
- 1:2,000,000-scale
• Digital Elevation Models (DEM's)
- 7.5-minute
- 15-minute
- 30-minute
- 1-degree
• Land Use and Land Cover digital data
- 1:250,000- and 1:100,000-scale land use and land cover and associated maps
- 1:250,000-scale Alaska Interim Land Cover Maps
• Geographic Names
The digital data are useful for the production of cartographic products such as plotting base maps and for various kinds of spatial analysis. A major use of these digital cartographic/geographic data is to combine them with other geographically referenced data, enabling scientists to conduct automated analyses in support of various decision making processes.
______________________
Any use of trade, product, or firm names in this publication is for descriptive purposes only and does not imply endorsement by the U.S. Government. Manuscript approved for publication August, 1993.
This document describes five distinct digital elevation products that are distributed by the USGS in the standard DEM format:
1. 7.5-Minute DEM (30- x 30-m data spacing, cast on Universal Transverse Mercator (UTM) projection). Provides coverage in 7.5- x 7.5-minute blocks. Each product provides the same coverage as a standard USGS 7.5-minute map series quadrangle.
2. 1-Degree DEM (3- x 3-arc-second data spacing). Provides coverage in 1- x 1-degree blocks. Two products (three in some regions of Alaska) provide the same coverage as a standard USGS 1- x 2-degree map series quadrangle. The basic elevation model is produced by or for the National Imagery and Mapping Agency (NIMA), but is distributed by USGS in the DEM data record format. 3. 30-Minute DEM (2- x 2-arc-second data spacing). Consists of four 15- x 15-minute DEM blocks.
Two 30-minute DEM's provide the same coverage as a standard USGS 30- x 60-minute map series quadrangle. Saleable units will be 30- x 30-minute blocks, that is, four 15- x 15-minute DEM's representing one half of a 1:100,000-scale map (30- x 60-minute coverage).
4. 15-minute Alaska DEM (2- x 3-arc-second data spacing, latitude by longitude). Provides coverage similar to a 15-minute DEM, except that the longitudinal cell limits vary from 20 minutes at the southernmost latitude of Alaska to 36 minutes at the northernmost latitude limits of Alaska. Coverage of one DEM will generally correspond to a l:63,360-scale quadrangle.
5. 7.5-minute Alaska DEM (1- x 2-arc-second data spacing, latitude by longitude). Provides coverage similar to a 7.5-minute DEM, except that the longitudinal cell limits vary from 10 minutes at the southernmost latitude of Alaska to 18-minutes at the northernmost latitude limits of Alaska. The UTM-based DEM's (7.5-minute DEM) and the geographic-based DEM's (30-minute, Alaska, and 1-degree DEM's) are identical in logical data structure but differ in sampling interval, geographic reference system, areas covered, and horizontal and vertical accuracy. Knowledge of all of these properties is essential to ensure that the user does not exceed the useful limits of the data for required applications. The 7.5-minute UTM DEM's are available for selected quadrangles, which are indicated on a status graphic published biannually by USGS. The 1-degree DEM's are available for all of the contiguous United States, Hawaii, and portions of Alaska, Puerto Rico, and the Virgin Islands. Many of the original 1-degree DEM's are being replaced with more accurate digital models through a cooperative regridding project with NIMA, scheduled for completion in 1995. As they become available, these 1-degree DEM's will replace their corresponding product. The 30-minute and Alaska DEM's are new DEM series and are available on a limited basis as projects are completed.
7.5-MINUTE DIGITAL ELEVATION MODELS Characteristics
A 7.5-minute DEM has the following characteristics:
• The data consist of a regular array of elevations referenced horizontally in the UTM coordinate system. The reference datum may be North American Datum of 1927
(NAD 27), North American Datum of 1983 (NAD 83), Old Hawaiian Datum (OHD), or Puerto Rico Datum of 1940 (PRD).
• The unit of coverage is the 7.5-minute quadrangle. Overedge coverage is not provided. • The data are ordered from south to north in profiles that are ordered from west to east. • The data are stored as profiles in which the spacing of the elevations along and between each
profile is 30 m.
• The profiles do not always have the same number of elevations because of the variable angle between the quadrangle's true north and the grid north of the UTM coordinate system.
• Elevations for the continental U.S. are either meters or feet referenced to the National Geodetic Vertical Datum of 1929 (NGVD 29). Elevations for Hawaii and Puerto Rico are either in meters or feet referenced to local mean sea level. DEM's of low-relief terrain or generated from contour maps with intervals of 10 ft (3 m) or less are generally recorded in feet. DEM's of moderate to high-relief terrain or generated from maps with terrain contour intervals greater than 10 ft are generally recorded in meters.
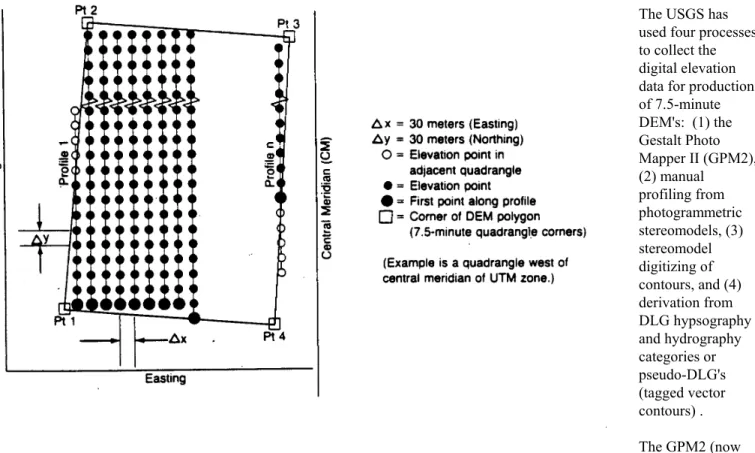
Profiles for 7.5-minute DEM's are generated by using a UTM cartesian coordinate system as a base. The profiles are clipped to the straight-line intercept between the four geographic corners of the quadrangle--an
approximation of the geographic map boundary (neatline) as shown in figure 1. The resulting area of coverage for the DEM is a quadrilateral, the opposite sides of which are not parallel. (See appendix D for an example of UTM coordinates describing a 7.5-minute quadrilateral figure.)
The UTM coordinates of the four corners (bounds) of the DEM's are listed in the type A record, as shown in table 1, data element 11; the UTM coordinates of the starting points of each profile are listed in the type B record (profiles), table 2, data element 3. These coordinates describe the shape of the quadrilateral and the variable x, y starting position of each profile. Because of the variable orientation of the quadrilateral in relation to the UTM coordinate system, profiles intersect the east and west neatlines as well as the north and south neatlines as shown in figure 1. In addition, DEM's have profile easting values that are continuous from one DEM to the adjoining DEM only if the adjoining DEM is contained within the same UTM zone.
Data Production
The 7.5-minute DEM data are produced in 7.5- x 7.5-minute blocks either from map contour overlays that have been digitized, or from automated or manual scanning of National Aerial Photography Program (NAPP) quarter quad-centered photographs or from the National High-Altitude Photography Program (NHAP) quad-centered photographs. The NHAP program was formally discontinued in 1988, however limited production using this scale source is permitted. The data are processed to produce a DEM having a 30-m sampling interval. The structure of a 7.5-minute DEM data file is shown in figure 1. (See tables for sample data records.)
Figure 1.--Structure of a The USGS has
used four processes to collect the digital elevation data for production of 7.5-minute DEM's: (1) the Gestalt Photo Mapper II (GPM2), (2) manual profiling from photogrammetric stereomodels, (3) stereomodel digitizing of contours, and (4) derivation from DLG hypsography and hydrography categories or pseudo-DLG's (tagged vector contours) . The GPM2 (now discontinued) was an automated photogrammetric system designed to produce orthophotographs, digital terrain data, and contours. An electronic image correlation component of the GPM2 measured the parallax of 2,444 points within each 9- x 8-mm area of a photogrammetric stereomodel. Of these 2,444 correlated points, subunits of 576, 1,024, or 1,600 points were collected for inclusion in the elevation model. These subunits were called patches, and the patch size was selected to accommodate various terrain conditions. The horizontal (x and y) spacing of the elevation points within each patch was approximately 182 mm at photographic scale (equivalent to a ground distance of
approximately 47 ft when using photographs at 1:80,000 scale). Each of the two NHAP stereomodels used to cover a standard 7.5-minute quadrangle contained over 500,000 correlated points; these were regridded to form a DEM in the standard format. Before discontinuance, approximately 15,000 DEMs were added to the NDCDB using this autocorrelation system.
The manual profiling process uses stereoplotters, equipped with three-axis electronic digital profile recording modules, for scanning of stereomodels along successive terrain profiles. High-altitude aerial photographs are used as source material. The scan speed and distance between profiles are selected by the operator to accommodate steepness in topographic slope. The most commonly used profile separation is approximately 90-m, with elevations normally recorded every 30 m along each profile. The profiled elevation data are
reformatted and regridded using a weighted four-nearest-neighbor interpolation to a regular 30-m UTM spacing, written in standard DEM format, and tested for vertical accuracy before placement in the National Digital Cartographic Data Base. Digital profile data of this type are collected as companion products during the production of orthophotographs.
For stereo model digitizing of contours (now deactivated), digital contours were acquired in digital form on stereoplotters equipped with three-axis digital recording modules. Digital data were acquired as the contours were stereocompiled for 7.5-minute quadrangle maps. The contours were assigned elevation values (attributes) during the acquisition phase. The contour data were processed into profile lines, and the elevation matrix was computed at a 30-m spacing using a bilinear interpolation.
Derivation of DEM's from DLG's or pseudo-DLG's is a process that involves the use of hardware such as scan-ners, manual digitizers, and (or) semiautomated line followers. The hypsography and hydrography categories of DLG or pseudo-DLG data are required as input to DEM processing. Contours and spot elevations in
three-dimensional coordinates are required from the hypsographic category. Lake and shoreline data are required from the hydrographic category for water body flattening. Drainage data are also extracted from the hydrography file. Elevations are computed where contours merge with the hydrographic data. Ridge lines, the opposite of drainage lines, are normally interpolated automatically by computer programs using trends within the hypsographic overlay. If necessary, the delineation of ridge lines may be accomplished by manual inputs or sophisticated medial axis computation algorithms. The DLG or pseudo-DLG are reformatted as tagged vector line strings and are input to gridding software to interpolate gridded elevations for the DEM. A subsequent processing step involves trimming the grid along the quadrangle perimeter and formatting the data into a DEM file structure. The DEM is finally processed by the DEM Editing System to validate and test the accuracy before entry into the National Digital Cartographic Data Base.
1-DEGREE DIGITAL ELEVATION MODELS Characteristics
A 1-degree DEM has the following characteristics:
• The product consists of a regular array of elevations referenced horizontally on the geographic (latitude/longitude) coordinate system of the World Geodetic System 1972 Datum (WGS 72) or the World Geodetic System of 1984 (WGS 84).
• The unit of coverage is a 1- x 1-degree block. Elevation data on the integer degree lines (all four sides) correspond with the same profiles on the surrounding eight blocks.
• Elevations are in meters relative to NGVD 29 in the continental U.S. and local mean sea level in Hawaii and Puerto Rico.
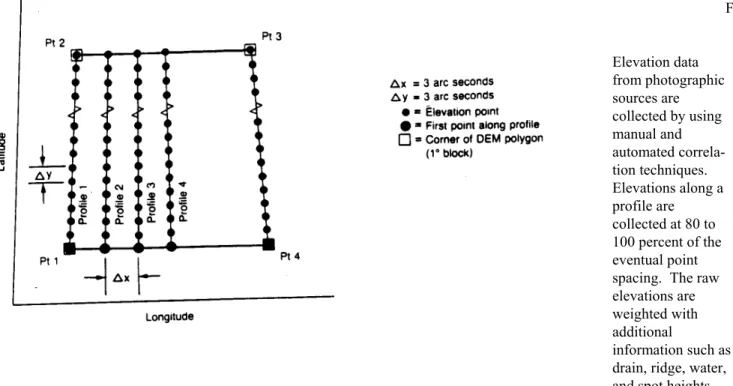
• The data are ordered from south to north in profiles that are ordered from west to east.
• Spacing of the elevations along each profile is 3 arc-seconds. The first and last data points are at the integer degrees of latitude. A profile will therefore contain 1,201 elevations.
• Spacing between profiles varies by latitude; however, the first and last data points are at the integer degrees of longitude. North of 50° degrees N and south of 70° N, the spacing is 6 arc-seconds with 601 profiles per product. For the remainder of Alaska north of 70° N the spacing is 9 arc-seconds with 401 profiles per product.
Data Production The majority of the 1-degree Digital Elevation Models are produced by NIMA from cartographic and
photographic sources. Under a cooperative agreement, selected 1-degree DEM's are being regridded by USGS from 7.5-minute DEM's and 30-minute DEM's. These data sets will be available upon completion of quality control and exchange between NIMA and USGS.
Elevation data from cartographic sources are collected from any map series 7.5 minute through 1 degree (1:24,000 scale through 1:250,000 scale). The hypsographic features (contours, drain lines, ridge lines, lakes, and spot elevations) are first digitized and then processed into the required matrix form and interval spacing. The structure of a 1-degree DEM data file is shown in figure 2 (see tables for sample data records).
Figure 2.--Structure of a Elevation data
from photographic sources are collected by using manual and automated correla-tion techniques. Elevations along a profile are collected at 80 to 100 percent of the eventual point spacing. The raw elevations are weighted with additional
information such as drain, ridge, water, and spot heights during the resampling process in which final elevations are determined for the required matrix form and interval spacing.
The digital elevation models distributed within the Department of Defense cover 1- x 1-degree blocks but are called Digital Terrain Elevation Data Level 1 (DTED-1). These blocks are referenced by their southwest corner coordinates rather than by the name of a corresponding map sheet. The header records and profile records are considerably different in their structure than those in the corresponding USGS-distributed version; however, in reformatting the product, the USGS does not change the basic elevation information.
The accuracy of the NIMA product, together with the data spacing, adequately support computer applications that analyze hypsographic features to a level of detail similar to manual interpretations of information as printed at map scales not larger than 1:250,000. The plotting of contours from the 1-degree DEM at scales larger than 1:250,000, or reliance on the elevation heights without incorporating the National Map Accuracy Standard (NMAS) horizontal error tolerance, will lead to less reliable results.
Note that NIMA 1-degree DTED-l data and USGS-distributed 1-degree DEM's are gridded by using the WGS 72 or WGS 84 datum, which is significantly different than the NAD 27 datum used by the USGS for gridding 7.5-minute DEM's. At the present time, policy issues concerning the transformation algorithms and procedures to convert to or from NAD 27 and WGS 72 to WGS 84 and (or) NAD 83 are being developed. See appendix H for additional information related to these datums.
30-MINUTE DIGITAL ELEVATION MODELS Characteristics
A 30-minute DEM has the following characteristics:
• The product consists of a regular array of elevations referenced horizontally to the geographic (latitude/longitude) coordinate system of NAD 27 or NAD 83.
• The unit of coverage is a 30- x 30-minute block. Saleable units are four 15-minute DEM's covering a 30- x 30-minute area. Elevation data on the integer minute lines (all four sides) correspond to the same profiles on the surrounding eight blocks.
• Elevations are in meters or feet relative to NGVD 29 in the continental U.S. and local mean sea level in Hawaii and Puerto Rico.
• The data are ordered from south to north in profiles that are ordered from west to east.
• Spacing of the elevations along each profile is 2 arc-seconds. The first and last data points are at the integer 15 minutes of latitude. A 15-minute profile will therefore contain 451 elevations.
Data Production
The USGS uses two processes to collect the digital elevation data for production of 30-minute DEM's: (1) derivation from DLG contours of any map series 7.5 minute to 30 x 60 minute (1:24,000 scale to 1:100,000 scale), (2) resampling from digital elevation models with a source spacing equal to or less than 2-arc second sampling interval (if the data is resampled from preexisting DEMs, it is arbitrarily archived as level 1). DEM data for this series are tested according to level 2 (see Level 2, p. 14) accuracy specifications.
The accuracy of the DEM data, together with the data spacing, adequately support computer applications that analyze hypsographic features to a level of detail similar to manual interpretations of information as printed at map scales not larger than 1:100,000. The plotting of contours from 30-minute DEM data at scales larger than 1:100,000, or reliance on the elevation heights without incorporating the NMAS horizontal error tolerance, will lead to less reliable results.
15-MINUTE ALASKA DIGITAL ELEVATION MODELS Characteristics
15-minute Alaska DEM's have the following characteristics:
• The product consists of a regular array of elevations referenced horizontally on to the geographic (latitude/longitude) coordinate system of NAD 27 or NAD 83.
• The unit of coverage corresponds to four basic quadrangle sizes for 1:63,360-scale graphics (depending on latitude):
Cell size limits
15 x 36 minutes State of Alaska north of 68° N latitude 15 x 30 minutes Between 62° N and 68° N latitude 15 x 22.5 minutes Between 59° N and 62° N latitude 15 x 20 minutes State of Alaska south of 59° N latitude
• The longitudinal limits of these cells are computed east and west of the -150 degree meridian. The north-south cell limits conform to even multiples of 15 minutes of latitude.
• The data are collected with a 2- x 3-arc-second spacing in latitude, and longitude, respectively. The first and last data points along a profile are at the integer degrees of latitude. A profile will
therefore contain 451 elevations.
• Elevation data on the quadrangle neatlines (all four sides) share edge profiles with the surrounding eight quadrangles.
• Elevations are in meters or feet relative to NGVD 29.
• The data are ordered from south to north in profiles that are ordered from west to east.
Data Production
The 15-minute Alaska DEM data are produced to match the spatial format of the 1:63,360-scale source contours. The primary process used for production of Alaska DEM's is to combine digitized hypsographic and
hydrographic data from 1:63,360-scale graphics. Processing can include all of the scanning, resampling, and contour interpolation programs previously mentioned. Data production for this series, if derived from hypsography overlays, is classified according to level 2 specifications.
The accuracy of the DEM data, together with the data spacing, adequately support computer applications that analyze hypsographic features to a level of detail similar to manual interpretations of information as printed at map scales not larger than 1:63,360. The plotting of contours from the 15-minute Alaska DEM's at scales larger than 1:63,360, or reliance on the elevation heights without incorporating the NMAS horizontal error tolerance, will lead to less reliable results.
7.5-MINUTE ALASKA DIGITAL ELEVATION MODELS Characteristics
7.5-minute Alaska DEM's have the following characteristics:
• The product consists of a regular array of elevations referenced horizontally to the geographic (latitude/longitude) coordinate system of NAD 27 or NAD 83.
• The unit of coverage corresponds to four basic quadrangle sizes for 1:24,000- and 1:25,000-scale graphics (depending on latitude):
Cell size limits
7.5 x 18 minutes State of Alaska north of 68° N latitude 7.5 x 15 minutes Between 62° N and 68° N latitude 7.5 x 11.25 minute Between 59° N and 62° N latitude
7.5 x 10 minutes State of Alaska south of 59° N latitude
• The longitudinal limits of these cells are computed east and west of the -150 degree meridian. The north-south cell limits conform to even multiples of 7.5 minutes of latitude.
• The data are collected with a 1- x 2-arc-second spacing in latitude and longitude, respectively. The first and last data points along a profile are at the integer degrees of latitude. A profile will therefore contain 451 elevations.
• Elevation data on the quadrangle neatlines (all four sides) share edge profiles with the surrounding eight quadrangles.
• Elevations are in meters or feet relative to NGVD 29.
• The data are ordered from south to north in profiles that are ordered from west to east.
Data Production
The 7.5-minute Alaska DEM data are produced to match the spatial format of the 1:24,000- and 1:25,000-scale source contours. The collection of elevation data is primarily by raster-to-vector digitizing of map separates and gridding the resultant vectors. Data production for this series, if derived from hypsography overlays, is classified according to level 2 specifications.
The accuracy of the DEM data, together with the data spacing, adequately support computer applications that analyze hypsographic features to a level of detail similar to manual interpretations of information as printed at map scales not larger than 1:24,000. The plotting of the contours from the Alaska DEM's at scales larger than 1:24,000, or reliance on the elevation heights without incorporating the NMAS horizontal error tolerance will lead to less reliable results.
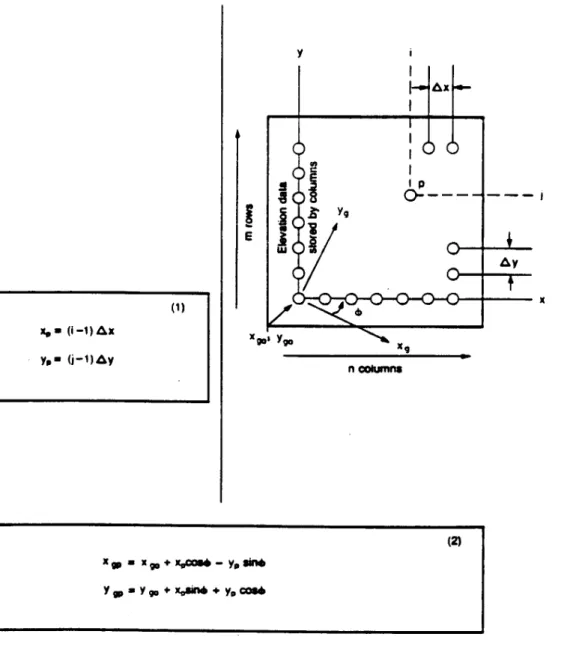
GEOMETRY Profiles are the basic building blocks of DEM's and are defined as one-dimensional arrays, that is, arrays of dimension in m rows x 1 column, where m is the length of the profile (variable length for 7.5-minute DEM's or fixed length for 30-minute, Alaska, and 1-degree DEM's).
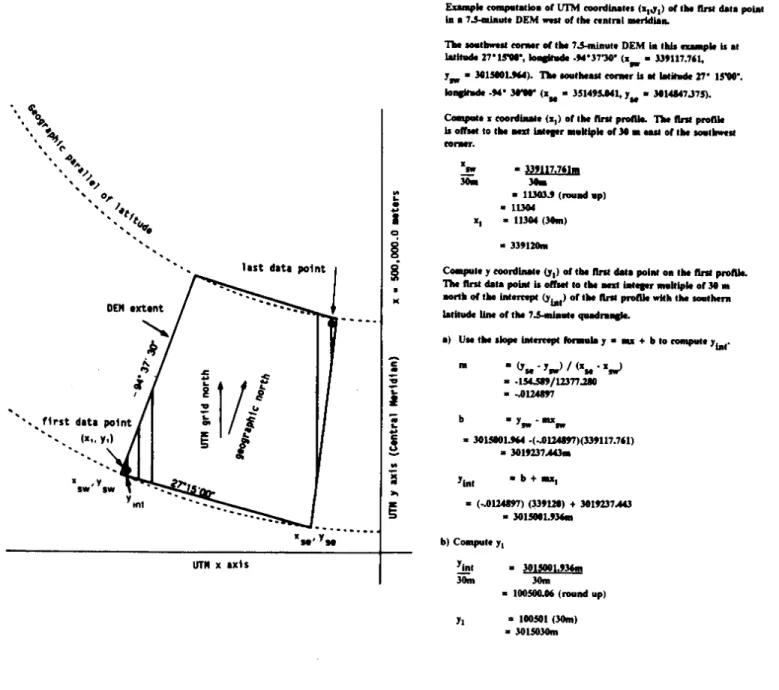
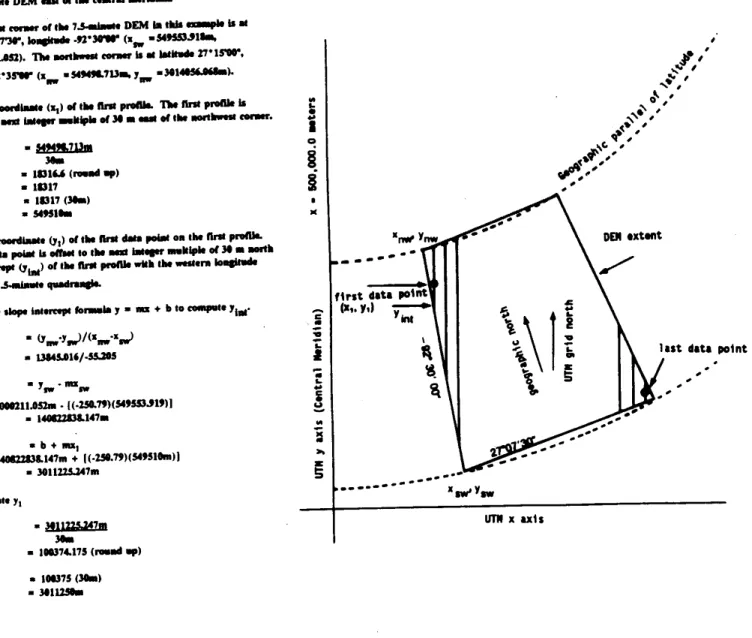
Figure 3 provides an example of the computation for the first data point inside the quadrilateral representing a 7.5-minute DEM west of the UTM central meridian. Figure 4 provides a similar example for a quadrangle east of the central meridian.
Figure 5, formula 1, illustrates the internal horizontal relationship (xp, yp) of elevations ordered as profiles in which the spacing of the elevations along each profile is ∆y and the spacing between profiles is ∆x. Figure 5, formula 2, relates the internal array structure to actual ground coordinates (xgp, ygp) based on an origin of the DEM at the lower left corner (xgo, ygo), and a rotation angle measured from quadrangle north, if any. The rotation angle of 7.5-minute DEM's is normally set to zero (see record A, element 13 in table 1). The rotation angle for a 1-degree DEM is always set to zero (see record A, element 13, in table 4). In general the mathematics is simpler for a 1-degree DEM. Each 1-degree DEM profile is composed of the same number of elevations per profile and the array is a square or rectangle. Therefore, the equations of figure 5 are greatly simplified.
ACCURACY The accuracy of a DEM is dependent upon the level of detail of the source and the grid spacing used to sample that source. The primary limiting factor for the level of detail of the source is the scale of the source materials. The proper selection of grid spacing determines the level of content that may be extracted from a given source during digitization. For example, 1:250,000-scale topographic maps are the primary source of 1-degree DEM's. Larger scale maps, such as 1:100,000 and 1:24,000, are used to generate higher accuracy DEM's. Scales smaller than 1:250,000 have not been used as a DEM source.
Another factor is the horizontal and vertical dimension of the DEM. Horizontal accuracy of DEM data depends on the horizontal spacing of the elevation matrix. Within a standard DEM, most terrain features are generalized by being reduced to grid nodes spaced at regular intersections in the horizontal plane (7.5-minute DEM interval is 30 m; 1-degree DEM interval is 3 arc-seconds). This generalization reduces the ability to recover positions of specific features less than the internal spacing during testing and results in a de facto filtering or smoothing of the surface during gridding.
Vertical accuracy of DEM data depends on the spatial resolution (horizontal grid spacing), quality of the source data, collection and processing procedures, and digitizing systems. As with horizontal accuracy, the entire process, beginning with project authorization, compilation of the source data sets, and the final gridding process, must satisfy accuracy criteria customarily applied to each system. Each source data set must qualify to be used in the next step of the process. Errors are compounded in each step of the process. For this reason, significant effort is expended in each phase of the production process to minimize errors.
Fig ure 3.--Computation of first data point in a 7.5-minute Digital Elevation Model west of the
Figure 4.-- Computation of first data point in a 7.5-minute Digital Elevation Model east of the
Figure 5.--Geometry and nom The method of
determining 7.5-minute DEM accuracy involves computation of the root-mean- square error (RMSE) for linearly interpo-lated elevations in the DEM and corresponding "true" elevations from the published maps. Test points are well
distributed, are representative of the terrain, and have "true" elevations well within the DEM accuracy criteria. Test points are located on contour lines, bench marks, or spot elevations. A minimum of 28 test points per DEM is required (20 interior points and 8 edge points). Collection of test point data and comparison of the DEM to the quadrangle hypsography are conducted by the quality-control units within the USGS.
The broad NIMA production objective for a 1-degree DTED-1 is to satisfy an absolute horizontal accuracy (feature to datum) of 130 m, circular error at 90-percent probability; and an absolute vertical accuracy (feature to mean sea level) of ±30 m, linear error at 90-percent probability. The relative horizontal and vertical accuracy (feature to feature on the surface of the elevation
model), although not specified, will in many cases conform to the actual hypsographic features with higher integrity than indicated by the absolute accuracy.
CLASSIFICATION LEVELS
The following is a description of the general data characteristics used to classify DEM's into one of three levels of quality. There are varying methods of data collection and degrees of editing available for DEM data. Classification levels are indicated in the DEM record A (appendix A).
Level 1
Level 1 DEM's are elevation data sets in a standardized format. The intent is to reserve this level for 7.5-minute DEM's or equivalent that are derived from scanning National High-Altitude Photography Program, National Aerial Photography Program, or equivalent photography.
A vertical RMSE of 7 m is the desired accuracy standard. A RMSE of 15 m is the maximum permitted. The intent for 7.5-minute DEM data at this level is that an absolute elevation error tolerance of 50 m (approximately three times the 15-meter RMSE) be set for blunders for any grid node when compared to the true elevation, or that an array of points not encompass more than 49 contiguous elevations and be in error by more than 21 m (three times the 7-m RMSE). Systematic errors within the stated accuracy standards are tolerated at this level. DEM data acquired photogrammetrically by using manual profiling or image correlation techniques are restricted to the level 1 category. DEM's with a RMSE of from 7 to 15 meters in elevation are being retained as an
intermediate product and eventually will be replaced by higher accuracy DEM's. The DEM record C (appendix C) contains the RMSE accuracy statistics acquired during quality control.
A 30-minute DEM product has been produced by regridding level 1 or level 2 source 7.5-minute DEM data. These grid derivative DEM's are arbitrarily labeled as level 1 DEM's and carry a measured RMSE in record C. A tolerance has not been set for this RMSE, as a minimum level of accuracy has been satisfied previously with the data sets origin in the 7.5-minute DEM program. Alternatively, 30-minute DEM's are labeled as level 2 if gridded from 1:100,000-scale hypsography and hydrography stable base separates. The tolerance for level 2, 30-minute DEM's, is one-half contour interval (see level 2 specifications, below).
Level 2
Level 2 DEM's are elevation data sets that have been processed or smoothed for consistency and edited to remove identifiable systematic errors. DEM data derived from hypsographic and hydrographic data digitizing, either photogrammetrically or from existing maps, are entered into the level 2 category after review on a DEM Editing System. An RMSE of one-half contour interval is the maximum permitted. There are no errors greater than one contour interval in magnitude. The DEM record C contains the accuracy statistics acquired during quality control.
Level 3
Level 3 DEM's are derived from DLG data by using selected elements from both hypsography (contours, spot elevations) and hydrography (lakes, shorelines, drainage). If necessary, ridge lines and hypsographic effects of major transportation features are also included in the derivation. A RMSE of one-third of the
contour interval is the maximum permitted. There are no errors greater than two-thirds contour interval in magnitude. The DEM record C contains the accuracy statistics acquired during quality control.
DIGITAL ELEVATION MODEL CAVEATS
The majority of the 7.5-minute DEM's produced to date are level 1. The current priority for authorization of 7.5-minute DEM production is now oriented to level 2, interpolation from digital contours. The USGS does not currently produce level-3 DEM data.
All 30-minute DEM's derived from contours are level 2. All 30-minute DEM's derived from 7.5-minute DEM's are level 1.
All 1-degree NIMA DTED-l's have been classified as level 3 because the hypsographic information, when plotted at 1:250,000 scale is consistent with the planimetric features normally found on 1:250,000-scale topographic maps. Inconsistencies may exist, but these are regarded as isolated cases to be tempered by the 90-percent confidence level for the overall product. NOTE: The USGS classification of "level 3" for 1-degree DEM's is not to be confused with the NIMA'S "DTED level 1." In the NIMA, the term "level" is related to the spatial resolution of the data and not to the source of the data. For example, DTED level 2 (which the USGS does not distribute) would have an array spacing of 1 x 1 arc-second for latitudes south of 50° N.
DATA RECORDS
A DEM file is organized into a series of three logical records are formatted as shown in appendixes A, B, and C. Because of the restructuring of new elements within what was formerly defined as element 1, record type A, the element counts of old record type A elements 2-15 (see table 1) have been incremented by one to elements 3-16 (see appendix A). A one-to-one correspondence still exists between the informational content of byte positions of elements in the old and new records. Therefore, DEM programs that expected elements 2-15 in specific byte positions in the DEM file will find the same information in those byte positions in the new files. In essence, this change is transparent to old DEM applications programs. Also, new data elements 17-29 have been appended to the end of the record A (see appendix A). These elements are contained in the end of the previously blank filled portion of the 1,024 byte record. This change is also expected to be transparent to existing DEM programs. Appendixes D-G consist of code definitions that are needed to interpret various data elements in the three records. The type A record contains information defining the general characteristics of the DEM, including descriptive header information relating to the DEM's name, boundaries, units of measurement, minimum and maximum data values, number of type B records, and projection parameters. There is only one type A record for each DEM file, and it appears as the first record in the data file. The type B record contains elevation data and associated header information. All type B records of the DEM files are made up of data from one-dimensional arrays called profiles. The number of complete profiles covering the DEM area is synonymous with the number of type B records in the DEM. In a UTM structured DEM, an occasional profile that exists within the bounds of the DEM quadrilateral but is void of elevation grid points is not represented in the DEM. (This is called the "missing profile condition" and occurs occasionally as the first or last hypothetical profile of the DEM.) The type C record contains statistics on the accuracy of the data in the file.
The physical structure of the DEM distributed to the user is as follows:
• Data recorded in fixed-block format on unlabeled or ANSI-labeled 9-track magnetic tape at 1,600 or 6,250 bpi density.
• Logical record size of 1,024 bytes. No more than one logical record type (A, B, or C) recorded in any 1,024-byte record. However, more than one 1,024-byte record is usually required to store a single record type B. The logical record is padded with blanks if necessary to fill to the end of the logical record. Bytes 1,021-1,024 of each logical record are padded with blanks.
• Physical record size of 4,096 bytes; that is, 4 logical records per physical record. • Data written as ANSI-standard ASCII characters.
Sample Data Records
Following are sample sets of A, B, and C records, corresponding to a typical 7.5-minute DEM (tables 1, 2, and 3), and sample sets of A and B records for a typical 1-degree DEM (tables 4 and 5). Included in these samples are literal ASCII listings of records directly from DEM distribution tapes. Following the literal listings are tabular explanations of each element in the type A, B, and C records. The tabular explanations may be used as direct references between the literal listings and the logical record type formats shown in appendixes A-C. Appendixes D-G consist of code definitions that are needed to interpret various data elements in the three records.
SAMPLE APPLICATIONS
The DEM files may be used in the generation of graphics such as isometric projections displaying slope, direction of slope, and terrain profiles between designated points. They may also be combined with other data types such as stream locations and weather data to plan forest fire control, or with remote sensing data to classify vegetation. Many nongraphic applications such as modeling terrain gravity data for use in locating energy resources, determining the volume of proposed reservoirs, calculating the amount of material removed during strip mining, and determining landslide probability have also been developed. Figures 6 and 7 show two graphic applications of DEM's.
Table 1.--Sample DEM Type A Logical Record--Mannboro, Virginia, Quadrangle (7.5 minute)
MANNBORO,VA Free form information field ---|Blank Filler field ---| 3 EMC 2 1 1 18 0.0 0.0 0.0 0.0 0.0
0.0 0.0 0.0 0.0 0.0 0.0 0.0 0.0 0.0 0.0 2
2 4 0.244998676000000D+06 0.412627656700000D+07 0.245420930000000D+06 0.414014832600000D+07 0.256491863000000D+06 0.4 13981850700000D+07 0.256087907000000D+06 0.412594681300000D+07 0.470000000000000D+02 0.114000000000000D+03 0.0 10.300000E+020.300000E+020.100000E+01 1 383 00 10163008908I5 0 2 1 1
Data
Element Content Explanation
1 MANNBORO, VA Quadrangle name field.
TEXT Bytes 41-80, free format textual information
FILLER Bytes 81-135 reserved for future use.
PROCESS 3 Indicates DEM was made from a DLG hypso overlay
FILLER Byte 137, blank fill
SECTIONAL INDICATOR Bytes 138 -140 specific to 30-minute DEM, left blank for 7.5-minute DEM
2 EMC Mapping Center origin code indicating that DEM was created in Eastern Mapping Center.
3 2 DEM level code indicating DEM level 2, synonymous with file created from DLG to DEM interpolation software.
4 1 Pattern code indicating either a regular or random elevation pattern; 1 indicates a regular pattern.
5 1 Planimetric reference system code; 1 indicates UTM coordinate system.
6 18 Code defining the zone in the ground planimetric reference system (i.e., UTM zone 18).
Table 1.--Sample DEM Type A Logical Record--Mannboro, Virginia Quadrangle (7.5 minute)--continued
Data
Element Content Explanation
7 0.0 Map projection parameters; all 15 fields are set to zero for the UTM (15 sets of 0.0) coordinate system and should be ignored.
8 2 Units code; 2 represents meters as the unit of measure for ground planimetric coordinates throughout this file.
9 2 Units code; 2 represents meters as the unit of measure for elevation coordinates throughout this file. 10 4 Number (n) of sides in the polygon which defines the coverage of the DEM file (usually equal to 4). 11 0.2449986...D+06 A 4,2 array containing the ground coordinates of the four corners of the DEM.
... Translation to decimal format yields: 244998.7, 4126276.6; 245420.9, ... 4140148.3; 256491.9, 4139818.5; 256087.9 4125946.8.
12 0.47...D+02 Minimum and maximum elevations for the DEM.
0.114....D+03
13 0.0 Counterclockwise angle (in radians) from the primary axis of ground planimetric reference to the primary axis of the DEM local reference system.
14 1 Accuracy code; 1 indicates that a record of accuracy exists and is contained in record type C. 15 0.3000000E+02 A three-element array containing DEM spatial resolution (x, y, z); usually set
0.3000000E+02 to 30, 30, 1. 0.1000000E+01
16 1 383 A two-element array containing the number of rows and columns of profiles in the DEM. The row value m is usually set to 1 as an indication that the arrays are actually one-dimensional profiles. The column value n equaling 383 indicates that the DEM file consists of a total of 383 profiles.
Table 1.--Sample DEM Type A Logical Record--Mannboro, Virginia Quadrangle (7.5 minute)--continued
Data
Element Content Explanation
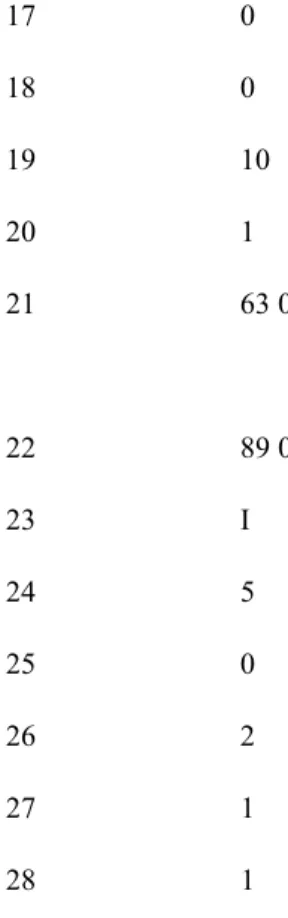
17 0 Indicates no largest contour interval.
18 0 Contour interval (set to 0 if previous data field is 0).
19 10 Smallest contour interval; indicates a standard 10-foot contour interval for the source quadrangle. 20 1 Contour units; 1 represents foot contours in multiples specified in the previous data field.
21 63 00 Data source date; this DEM was generated from contours which were compiled photogrametrically in 1963. Numbers 00 indicate month is not specified. The quadrangle was photorevised in 1987; however, no significant changes were made to the contours, therefore the date of 1963 takes precedence.
22 89 08 Data inspection date; this DEM was tested and inspected on the DES on August 1989.
23 I Inspection/revision flag; in this case, this is a new data set which has been inspected but not revised.
24 5 Data validation flag; qualitative and quantitative tests appropriate to DEM level 2 data have been performed.
25 0 Suspect/void flag; 0 indicates none.
26 2 Vertical datum; 2 indicates DEM vertical datum is National Geodetic Vertical Datum 1929 (NGVD 29). 27 1 Horizontal Datum; 1 indicates DEM horizontal datum is North American Datum of 1927 (NAD 27).
28 1 Data edition; 1 indicates this is the first edition.
29 Percent void, element 25 is 0, therefore this field is blank.
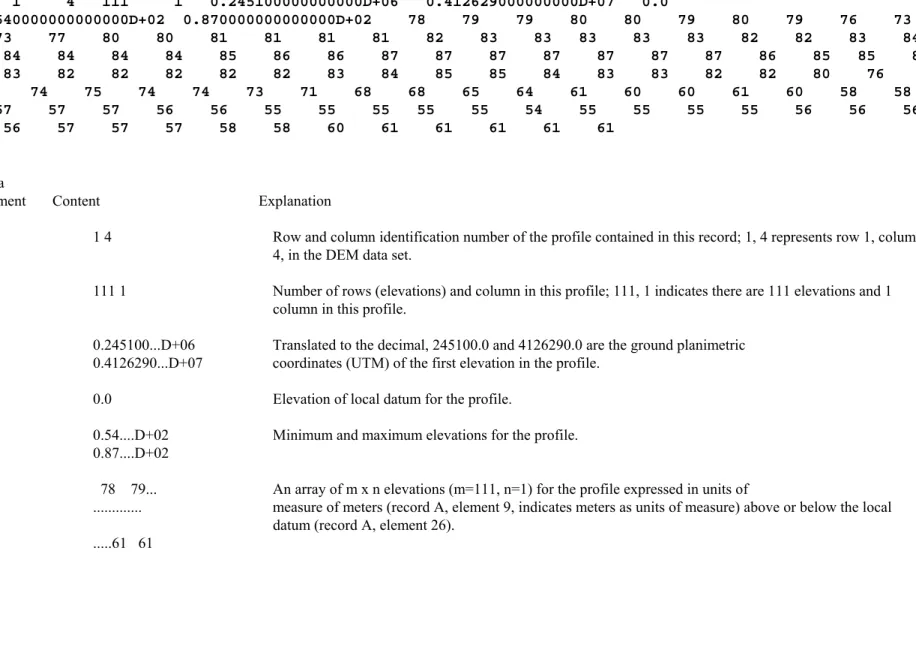
Table 2.--Sample DEM Type B Logical Record--Mannboro, Virginia Quadrangle (7.5 minute)
1 4 111 1 0.245100000000000D+06 0.412629000000000D+07 0.0
0.540000000000000D+02 0.870000000000000D+02 78 79 79 80 80 79 80 79 76 73 73 77 80 80 81 81 81 81 82 83 83 83 83 83 82 82 83 84 84 84 84 84 85 86 86 87 87 87 87 87 87 87 86 85 85 84 83 82 82 82 82 82 83 84 85 85 84 83 83 82 82 80 76 75 74 75 74 74 73 71 68 68 65 64 61 60 60 61 60 58 58 57 57 57 56 56 55 55 55 55 55 54 55 55 55 55 56 56 56 56 57 57 57 58 58 60 61 61 61 61 61
Data
Element Content Explanation
1 1 4 Row and column identification number of the profile contained in this record; 1, 4 represents row 1, column 4, in the DEM data set.
2 111 1 Number of rows (elevations) and column in this profile; 111, 1 indicates there are 111 elevations and 1 column in this profile.
3 0.245100...D+06 Translated to the decimal, 245100.0 and 4126290.0 are the ground planimetric 0.4126290...D+07 coordinates (UTM) of the first elevation in the profile.
4 0.0 Elevation of local datum for the profile.
5 0.54....D+02 Minimum and maximum elevations for the profile. 0.87....D+02
6 78 79... An array of m x n elevations (m=111, n=1) for the profile expressed in units of
... measure of meters (record A, element 9, indicates meters as units of measure) above or below the local datum (record A, element 26).
...61 61
Table 3.--Sample DEM Type C Logical Record--Mannboro, Virginia Quadrangle (7.5 minute)
1 0 0 3 0 1 0 0 1 23
Data
Element Content Explanation
1 1 Availability code; 1 indicates that an absolute accuracy estimate does exist for this file.
2 0 0 3 Absolute accuracy RMSE estimate (in x, y, and z); the first two zeros indicate that the x and y relative statistics are not available. A 3 in this field indicates that a vertical solution of 3 meters or less was computed for the source data control network.
3 0 A 0 implies that this test occurred prior to and is independent of the DEM collection process and that the number of test points is irrelevant.
4 1 Availability code; 1 indicates that statistics are available in the next element.
5 0 0 1 RMSE of DEM data relative to datum (in x, y, and z); the first two zeros indicate that the x and y relative statistics are not available. The value 1 meaning 1-meter RMSE indicates that the DEM met relative vertical (z) accuracy criteria for the 7-meter data base.
6 23 Sample size code; 23 indicates that the relative statistic of element 5 is based on 23 vertical test points.
Table 4.--Sample DEM Type A Logical Records--Reno, Nevada-California, Quadrangle (West Half) (1 degree)
NJ11-01W
3 1 0 0 0.0 0.0 0.0 0.0 0.0 0.0 0.0 0.0 0.0 0.0 0.0 0.0 0.0 0.0 0.0 3
2 4 -0.428400000000000D+06 0.140400000000000D+06 -0.428400000000000D+06 0.144000000000000D+06 -0.424800000000000D+06 0.1 44000000000000D+06 -0.424800000000000D+06 0.140400000000000D+06 0.999000000000000D+03 0.264100000000000D+04 0.0 00.300000E+010.300000E+010.100000E+01 1 1201
Data
Element Content Explanation
1 NJ11-01W Quadrangle name field (144 characters); NJ11-01W is the designation for the DEM covering the west half of the Reno, Nevada-California, sheet.
2 3 DEM level code; 3 reflects processing by NIMA which includes registration to planimetric features appearing on the source 1-degree topographic map.
3 1 Pattern code; 1 indicates a regular elevation pattern.
4 0 Planimetric reference system code; 0 indicates geographic coordinate system.
5 0 Zone code; there are no zones in the geographic system. Therefore, the zone code is set to zero. 6 0.0 Map projection parameters; all 15 fields are set to zero for the geographic
(15 sets of 0.0) system and should be ignored. Presence of non-zero parameters are not related to the geographic coordinate system and should also be ignored.
7 3 Units code; 3 represents arc-seconds as the unit of measure for ground planimetric coordinates throughout the file.
8 2 Units code; 2 represents meters as the unit of measure for elevation coordinates throughout the file. 9 4 Number (n) of sides in the polygon which defines the coverage of the DEM file (usually equal to 4).
Table 4.--Sample DEM Type A Logical Records--Reno, Nevada-California, Quadrangle (West Half) (1 degree)--continued
Data
Element Content Explanation
10 -0.4284...D+06, A 4,2 array containing the ground coordinates of the four corners of the DEM.
0.1404...D+06 In this case translation from arc-seconds to degrees, minutes, and seconds ... yields: -119 00 00, 39 00 00; -119 00 00, 40 00 00; -118 00 00, 40 00 00;
... -118 00 00, 39 00 00.
-0.4248...D+06
0.1404...D+06
11 0.9990...D+03 Minimum and maximum elevations for the DEM.
0.2641...D+04
12 0.0 Counterclockwise angle from the primary axis of ground planimetric reference to the primary axis of the DEM local reference system.
13 0 Accuracy code; 0 indicates that a record of accuracy does not exist and that no record type C will follow. 14 0.3000000E+01 A three-element array containing DEM spatial resolution (x, y, z); set to
0.3000000E+01 3, 3, 1; or 3, 6, 1; or 3, 9, 1 depending on the latitude of the product. 0.1000000E+01
15 1 1201 A two-element array containing the number of rows and columns of profiles in the DEM. The row value m is usually set to 1 as an indication that the arrays are actually one-dimensional profiles. The column value n set to 1,201 indicates that the DEM file consists of a total of 1,201 profiles.
Table 5.--Sample DEM Type B Logical Record--Reno, Nevada-California, Quadrangle (West Half) (1 degree)
1 1 1201 1 -0.428400000000000D+06 0.140400000000000D+06 0.0
0.121200000000000D+04 0.177200000000000D+04 1538 1539 1539 1534 1529 1520 1513 1508 1501 1493 1488 1483 1479 1475 1474 1473 1472 1469 1469 1467 1466 1464
(As per 7.5-minute DEM's, element 6 contains elevations for the NIMA DEM. This field always contains 1,201 data elements per record. See Data Element 6.)
1422 1417 1412 1405 1401 1396 1391 1392 1394 1397 1398 1397 1398 1398 1397 1394 1390 1386 1383 1380 1377 1374 1372 1369 1367 1366 1367 1368 1368 1369 1369 1370 1371 1371 1371 1371 1370 1371 1372 1370 1373 1373 1372 1376 1375 1374 1374 1372 1372 1374 1374 1374 1374 1376 1378 1381
Data
Element Content Explanation
1 1 1 Row and column identification number of the profile contained in this record; 1, 1 represents row 1, column 1, in the DEM data set.
2 1201 1 Number of rows (elevations) and columns in this profile; 1201, 1 indicates there are 1,201 elevations and 1 column in this profile.
3 -0.4284...D+06 Translated to the decimal, -428400.0 and 1404000.0 are the ground planimetric
0.1404...D+06 coordinates (arc-seconds) of the first elevation in the profile, thus computed equal to -119 and 39 degrees. 4 0.0 Elevation of local datum for the profile. Always zero for 1-degree DEM, the reference is mean sea level. 5 0.1212...D+04 Minimum and maximum elevations for the profile.
0.1772...D+04
6 1538 1539... An array of m x n elevations (m=1201, n=1) for the profile expressed in units ... of measure of meters (record A, element 8, indicates meters as units of ..1378 1381 measure) above or below the local datum (record a, element 4).
Figure 6.--Preeruption isometric plot of Mount St. Helens 7.5-minute Digital Elevation
Models generated from data obtained from July 15, 1979, photographs. View is from the northeast at a 45° altitude angle; vertical exaggeration is 3:1.
Figure 7.--Posteruption isometric plot of Mount St. Helens 7.5-minute Digital Elevation
Models generated from data obtained from September 6, 1980, photographs.
View is from the northeast at a 45° altitude angle; vertical exaggeration is 3:1.
APPENDIX A.--Digital Elevation Model Data Elements Logical Record Type A
____________________________________________________________________________________________________________________________________________________________________ ___
Type Physical Record Format
Data (FORTRAN ASCII Starting Ending Comment
Element Notation) Format byte byte
____________________________________________________________________________________________________________________________________________________________________ ___
1 File name ALPHA A40 1 40 Authorized DEM quadrangle name.
Free Format Text ALPHA A40 41 80 Free format descriptor field, contains useful information related to
digital process such as digitizing instrument, photo codes, slot widths, etc.
Filler --- --- 81 135
Process Code ALPHA A1 136 Code 1=GPM
2=Manual Profile
3=DLG2DEM (includes any DLG type process such as CTOG or LINETRACE)
4=DCASS
Filler --- --- 137
Sectional Indicator ALPHA A3 138 140 This code is specific to 30-minute DEM's. Identifies 1:100,000-scale
sections. Formatted as XNN, where X is "s"=7.5-minute, "F"=15-minute, and NN is a two-digit sequence number.
2 MC origin code ALPHA A4 141 144 Mapping Center origin Code. Valid codes are EMC, WMC,
MCMC, RMMC, FS, GPM2.
3 DEM level code INTEGER*2 I6 145 150 Code 1=DEM-1
2=DEM-2 3=DEM-3
4 Code defining INTEGER*2 I6 151 156 Code 1=regular
elevation pattern 2=random is reserved for
(regular or random) future use.
APPENDIX A.--Digital Elevation Model Data Elements Logical Record Type A--continued
____________________________________________________________________________________________________________________________________________________________________ ___
Type Physical Record Format
Data (FORTRAN ASCII Starting Ending Comment
Element Notation) Format byte byte
____________________________________________________________________________________________________________________________________________________________________ ___
5 Code defining INTEGER*2 I6 157 162 Code 0=Geographic
ground planimetric 1=UTM
reference system 2=State plane
For codes 3-20, see appendix F.
Code 0 represents the geographic (latitude/longitude) system for 30-minute, 1-degree and Alaska DEM's. Code 1 represents the current use of the UTM coordinate system for 7.5-minute DEM's.
6 Code defining INTEGER*2 I6 163 168 Codes for State plane and UTM coor-
zone in ground dinate zones are given in appendixes
planimetric D and E for 7.5-minute DEM's. Code
reference system is set to zero if element 5 is also set to zero defining data as
geographic.
7 Map projection REAL*8 15D24.15 169 528 Definition of parameters for various projections
parameters (see is given in appendix F. All 15 fields of this
appendix F) element are set to zero and should be ignored when geographic,
UTM, or State plane coordinates are coded in data element 5.
8 Code defining unit INTEGER*2 I6 529 534 Code 0=radians
of measure for 1=feet
ground planimetric 2=meters
coordinates through- 3=arc-seconds
out the file Normally set to code 2 for 7.5-minute DEM's. Always set to code 3
for 30-minute, 1-degree, and Alaska DEM's.
APPENDIX A.--Digital Elevation Model Data Elements Logical Record Type A--continued
____________________________________________________________________________________________________________________________________________________________________ ___
Type Physical Record Format
Data (FORTRAN ASCII Starting Ending Comment
Element Notation) Format byte byte
____________________________________________________________________________________________________________________________________________________________________ ___
9 Code defining unit INTEGER*2 I6 535 540 Code 1=feet
of measure for 2=meters
elevation coordinates Normally code 2, meters, for
throughout the file 7.5-minute, 30-minute, 1-degree, and Alaska DEM's.
10 Number (n) of sides INTEGER*2 I6 541 546 n=4.
in the polygon which defines the coverage of the DEM file
11 A 4,2 array con- REAL*8 4(2D24.15) 547 738 The coordinates of the quadrangle
taining the ground corners are ordered in a clockwise
coordinates of the direction beginning with the
four corners for southwest corner. The array is
the DEM stored row-wise as pairs of eastings and northings.
12 A two-element array REAL*8 2D24.15 739 786 The values are in the unit of
containing minimum measure given by data element 9 in
and maximum eleva- this record.
tions for the DEM
13 Counterclockwise REAL*8 D24.15 787 810 See figure 5. Set to zero to align
angle (in radians) with the coordinate system specified
from the primary in element 5.
axis of ground
planimetric refer-
ence to the pri- mary axis of the DEM
local reference
system
APPENDIX A.--Digital Elevation Model Data Elements Logical Record Type A--continued
____________________________________________________________________________________________________________________________________________________________________ ___
Type Physical Record Format
Data (FORTRAN ASCII Starting Ending Comment
Element Notation) Format byte byte
____________________________________________________________________________________________________________________________________________________________________ ___
14 Accuracy code for INTEGER*2 I6 811 816 Code 0=unknown accuracy
elevations 1=accuracy information is given
in logical record type C.
15 A three-element array REAL*4 3E12.6 817 852 These elements are usually set to; 30, 30, 1 for
of DEM spatial resolu- 7.5-minute DEM's; 2, 2, 1 for 30-minute DEM's;
tion for x, y, z. Units of 3, 3, 1 for 1-degree DEM's.
measure are consistent 2, 1, 1 for high resolution DEM's in Alaska
with those indicated by data 3, 2, 1 for low resolution DEM's in Alaska.
elements 8 and 9 in this 7.5-minute DEM'S will eventually be converted
record to geographics, i.e., 1,1,1.
16 A two-element array INTEGER*2 2I6 853 864 When the row value m is set to 1 the
containing the num- n value describes the number of
ber of rows and columns in the DEM file. Raw GPM
columns (m,n) of data files are set to m=16, n=16.
profiles in the DEM
Note: Old format stops here
---
17 Largest primary INTEGER*2 I5 865 869 Present only if two or more
contour interval primary intervals exist.
18 Source contour INTEGER*1 I1 870 Corresponds to the units of the map
interval units largest primary contour interval
0=N.A., 1=feet, 2=meters.
19 Smallest primary INTEGER*2 I5 871 875 Smallest or only primary contour interval
20 Source contour INTEGER*1 I1 876 Corresponds to the units of the map
interval units smallest primary contour interval.
1=feet, 2=meters.
APPENDIX A.--Digital Elevation Model Data Elements Logical Record Type A--continued
____________________________________________________________________________________________________________________________________________________________________ ___
Type Physical Record Format
Data (FORTRAN ASCII Starting Ending Comment
Element Notation) Format byte byte
____________________________________________________________________________________________________________________________________________________________________ ___
21 Data source date INTEGER*2 I4 877 880 YYMM two-digit year and two-digit month
MM = 00 for source having year only.
22 Data inspection/ INTEGER*2 I4 881 884 YYMM two-digit year and two-digit month.
revision date
23 Inspection/ ALPHA*1 A1 885 "I" or "R"
revision flag
24 Data validation INTEGER*1 I1 886 0= No validation performed.
flag
1=TESDEM (record C added) no quali- tative test (no DEM Edit System [DES] review).
2=Water body edit and TESDEM run. 3=DES (includes water edit) no qualitative test (no TESDEM). 4=DES with record C added, qualita- tive and quantitative tests for level 1 DEM.
5=DES and TESDEM qualitative and quantitative tests for levels 2 and 3 DEM's.
25 Suspect and void INTEGER*1 I2 887 888 0=none
area flag
1=suspect areas
2=void areas 3=suspect and void areas
APPENDIX A.--Digital Elevation Model Data Elements Logical Record Type A--continued
____________________________________________________________________________________________________________________________________________________________________ ___
Type Physical Record Format
Data (FORTRAN ASCII Starting Ending Comment
Element Notation) Format byte byte
____________________________________________________________________________________________________________________________________________________________________ ___
26 Vertical datum INTEGER*1 I2 889 890 1=local mean sea level
2=National Geodetic Vertical
Datum 1929 (NGVD 29)
3=North American Vertical
Datum 1988 (NAVD 88)
27 Horizontal datum INTEGER*1 I2 891 892 1=North American Datum 1927 (NAD 27)
2=World Geodetic System 1972 (WGS 72)
3=WGS 84
4=NAD 83
5=Old Hawaii Datum
6=Puerto Rico Datum
7=NAD 83 Provisional (shifts in horizontal coordinates are computed, but old DEM nodes are not resampled)
28 Data Edition INTEGER*2 I4 893 896 01-99 Primarily a NIMA specific field.
29 Percent Void INTEGER*2 I4 897 900 If element 25 indicates a void, this field (right justified) contains the
percentage of nodes in the file set to void (-32,767).
____________________________________________________________________________________________________________________________________________________________________ ___
APPENDIX B.--Digital Elevation Model Data Elements Logical Record Type B
____________________________________________________________________________________________________________________________________________________________________ ___
Type Physical Record Format
Data (FORTRAN ASCII Starting Ending Comment
Element Notation) Format byte byte
____________________________________________________________________________________________________________________________________________________________________ ___
1 A two-element array INTEGER*2 2I6 1 12 See figure 5. The row/column
containing the row numbers may range from 1 to m and
and column identifi- 1 to n. The row number is normally
cation number of the set to 1. The column identification
DEM profile con- is the profile sequence number.
tained in this record
2 A two-element array INTEGER*2 2I6 13 24 See figure 5. The first element in the field
containing the number corresponds to the number of rows and columns
(m, n,) of elevations of nodes in this profile. The second
in the DEM profile element is set to 1,
specifying 1 column per B record.
3 A two-element array REAL*8 2D24.15 25 72 See figure 5.
containing the
ground planimetric
coordinates (X
go,Ygo) of
the first elevation in
the profile
4 Elevation of local REAL*8 D24.15 73 96 The values are in the units of
datum for the measure given by data element 9,
profile logical record type A.
APPENDIX B.--Digital Elevation Model Data Elements Logical Record Type B--continued
____________________________________________________________________________________________________________________________________________________________________ ___
Type Physical Record Format
Data (FORTRAN ASCII Starting Ending Comment
Element Notation) Format byte byte
____________________________________________________________________________________________________________________________________________________________________ ___
5 A two-element array REAL*8 2D24.15 97 144 The values are in the unit of
of minimum and measure given by data element 9 in
maximum elevations logical record type A.
for the profile
6 A m,n array of INTEGER*2 mn(I6) 6x(146 or 170) See data element 15 in appendix A.
elevations for the 146 = max for A value in this array would be
profile. Elevations first block. 170 = max multiplied by the spatial resolution
are expressed in for subsequent blocks value and added to the elevation of the
units of resolution local elevation datum for the element profile (data element 4 in this
record) to obtain the elevation for the point. The planimetric ground coordinates of the point X
gp, Ygp, are computed according to
the formulas in figure 5.
____________________________________________________________________________________________________________________________________________________________________ ___
APPENDIX C.--Digital Elevation Model Data Elements Logical Record Type C
____________________________________________________________________________________________________________________________________________________________________ ___
Type Physical Record Format
Data (FORTRAN ASCII Starting Ending Comment
Element Notation) Format byte byte
____________________________________________________________________________________________________________________________________________________________________ ___
1 Code indicating INTEGER*2 I6 1 6 Code 1=available
availability of 0=unavailable
statistics in data
element 2
2 RMSE of file's datum INTEGER*2 3I6 7 24 In same units as indicated by
relative to absolute elements 8 and 9 of logical record
datum (x, y, z) type A.
3 Sample size on which INTEGER*3 I6 25 30 If 0, then accuracy will be assumed
statistics in data to be estimated rather than
element 2 are based computed.
4 Code indicating INTEGER*2 I6 31 36 Code 1=available
availability of 0=unavailable
statistics in data
element 5
5 RMSE of DEM data INTEGER*2 3I6 37 54 In same units as indicated by
relative to file's elements 8 and 9 of logical record
datum (x, y, z) type A.
6 Sample size on INTEGER*2 I6 55 60 If 0, then accuracy will be assumed
which statistics in to be estimated rather than
element 5 are based computed.
____________________________________________________________________________________________________________________________________________________________________ ___
APPENDIX D.--Sample Quadrilateral Coordinates Geographic Coordinates UTM Coordinates Quad Corner
No. Latitude Longitude Easting Northing
1 35°30' 107°37’30" 261897 3931463
2 35°37’30" 107°37’30" 262267 3945330
3 35°37’30" 107°30’ 273590 3945036
4 35°30’ 107°30’ 273238 3931169